



The market is in a choppy phase, and sentiment is uncertain. Lao K brings you the latest market analysis and trend outlook.
The Macro Tug-of-War: Oil Prices, Geopolitics, and U.S. Treasury Yields
In Saturday’s analysis last week, based on both subjective judgment and objective market action, we suggested that the market could see a “turnaround” this week. The main factors include the following dimensions:
Oil Prices and Political Pressure: Crude oil prices have reached a key resistance level. During the midterm elections, beyond financial factors, could political forces use artificial means to push oil prices down and curb inflation? This is one of the core subjective biases.
NASDAQ technical support: The Nasdaq pre-market index pulled back to the middle of the range that previously saw heavy accumulation, and touched support from the daily Vegas channel. With key technical support, extremely oversold indicators, extreme market fear, and the midterm elections all converging—and Bitcoin itself not having broken down—we expect a high probability of a major market rebound.
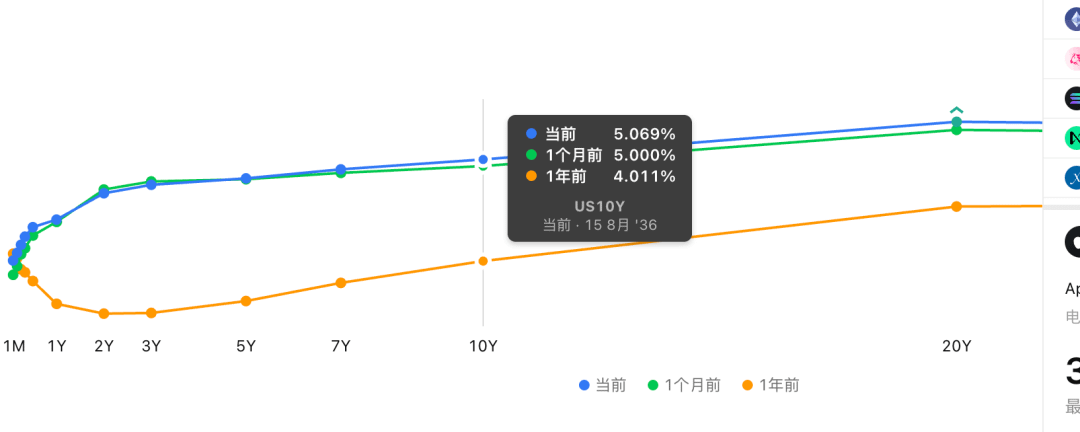
Latest geopolitical and macro developments: The market action suggests our forecast is playing out. U.S. stock futures successfully dipped to just above the upper edge of the bull flag and attempted to break upward. Oil consolidated and pulled back after hitting a high of $101, confirming significant overhead resistance. On the news front, the Iranian foreign minister’s proposal to reopen the Strait of Hormuz within seven days remains on the table, leaving the decision to the United States. Meanwhile, the 10-year Treasury yield has quickly fallen from 5.2% to near 5.0%. Given severe inflationary pressure and the need for votes in the midterm elections, whether the U.S. will seize this opportunity is key.
Bitcoin (BTC) Market Analysis: Key Support Confirmed and a Short-Term Bear Trap
· Weekly timeframe: Although the weekly chart shows two consecutive down weeks, both weekly candles managed to close above $80,000. This “line in the sand” at $80,000 has held for now, and the chart has formed a pattern resembling a “double pin-bar bottom,” suggesting that selling pressure has been effectively absorbed or is showing signs of exhaustion.
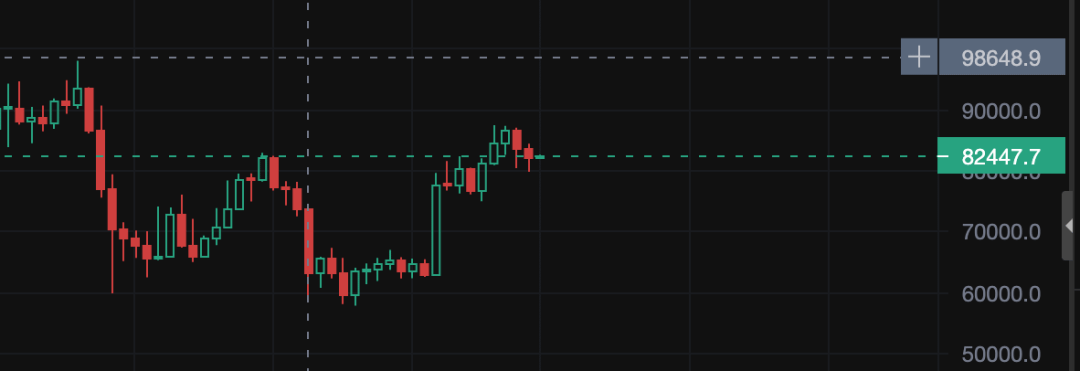
· Daily and 4-hour timeframes: The candlestick pattern formed from last Friday through the weekend came close to forming a standard bullish “Morning Star.” The 4-hour rebound has shown healthy volume, almost engulfing the large bearish candle to its left.
· 1-hour timeframe and liquidity hunting: The 1-hour chart broadly shows a liquidity-sweep structure of “breaking down and then reclaiming the level.” The quick breakdown and recovery last Friday formed a consolidation range, which came under pressure from the 1-hour Vegas channel. As we forecast on Saturday’s show, a second retest was likely given the relative vacuum in the order book. We specifically predicted that $79,700 would be difficult to break decisively, and that the worst-case scenario would be a second retest or a deeper pullback. This forecast proved entirely accurate.
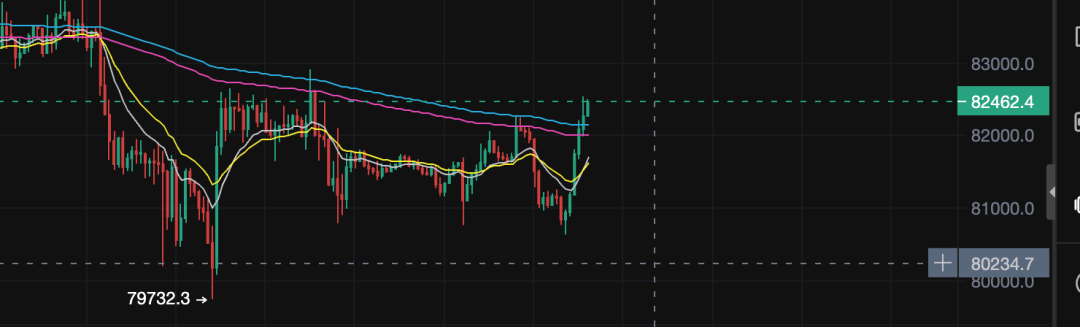
· Short covering and liquidations: After breaking below the lower edge of the range early this morning, the funding rate briefly turned to an extremely low positive value, or even negative. Price then quickly recovered, while open interest fell sharply—indicating a typical short-covering move and short squeeze, with bears once again becoming fuel for the rally. This short-term breakdown was not a structural breakdown, but rather a move by major players to sweep stop-loss liquidity to the downside. The 1-hour chart is now attempting to break above resistance from the Vegas channel. If one or two consecutive hourly candles close strongly higher, the first target above is $84,400, with the next target at the parallel highs above $87,000.
The Nature of Inflation and Reflections on a Potential Bubble in the AI Supply Chain
Whether Treasury yields can quickly break below 5.0% is a key macro threshold. If they do, it would mean the market is taking a more measured view of inflation data:
· The inflation transmission chain: The main reason inflation remains elevated is oil prices and their knock-on effects. Higher oil prices have sharply increased transportation and logistics costs, which then feed into the prices of goods across the global supply chain. Rising prices, in turn, drive up wage demands—and that is the key factor that can cause inflation to worsen across the board.
· A clear-eyed assessment of the AI supply chain: Once fear subsides, the market should take an objective view of the default risks facing companies such as CoreWeave. These are financial problems specific to individual companies, not issues shared by the entire AI supply chain. In our weekend special, we systematically analyzed how CoreWeave could trigger a domino effect in an AI bubble and identified quality companies with ample cash flow. During this deep correction, investors need to learn to distinguish genuine “junk stocks” from undervalued quality assets that have been unfairly punished by sentiment.
Outlook for Ethereum (ETH) and the Nasdaq
· Ethereum (ETH): Overhead resistance for Ethereum is very clear. The area around $2,600, just above the Vegas channel and near the parallel highs, is a liquidity-heavy zone and a technical level where large orders are concentrated. Until the three key macro factors change, this area is likely to become a near-term high and a point where panic sellers exit.
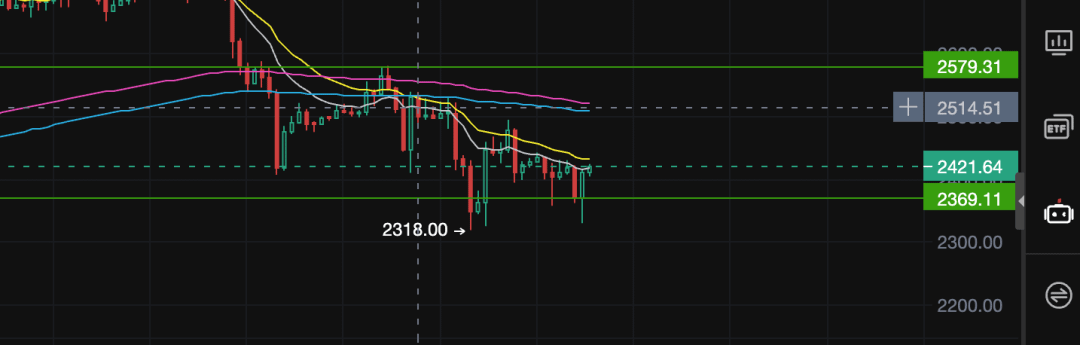
· Nasdaq: We maintain our “up first, then down” scenario. The key going forward is whether macro indicators, such as support and resistance flipping, shift—and whether this week’s macro improvement can be further confirmed.
Summary and Trading Strategy: Stay Calm and Avoid Blind Optimism
Overall, Bitcoin remains in a broad trading range. The ADX indicator is below 25, indicating a non-trending market. Although the short-term chart has formed an AMD pattern—a breakdown followed by a reclaim—and could test the upper edge of the range ($87,300), we cannot yet say that a new major bull market has begun before the December rate path and the macro environment improve decisively.
Avoid being blindly optimistic in your trading. After reaching take-profit targets, watch the market closely and consider reducing some positions in stages when appropriate. The market is driven by actual price action, not by anyone’s personal forecast. If Treasury yields plunge this week, oil falls below $90, geopolitical tensions ease significantly, and U.S. stocks continue to surge, we will adjust our “up first, then down” outlook accordingly.
· Want timely updates on the latest market trends and forecasts? Follow and subscribe to our social media channels!