


Let's take a look at the current technical picture for GTC (Gitcoin), which is showing a confident recovery after a local correction, gaining +12.64% over the past 24 hours and trading at 0.25874 USDT.
Key points and technical analysis from the chart:
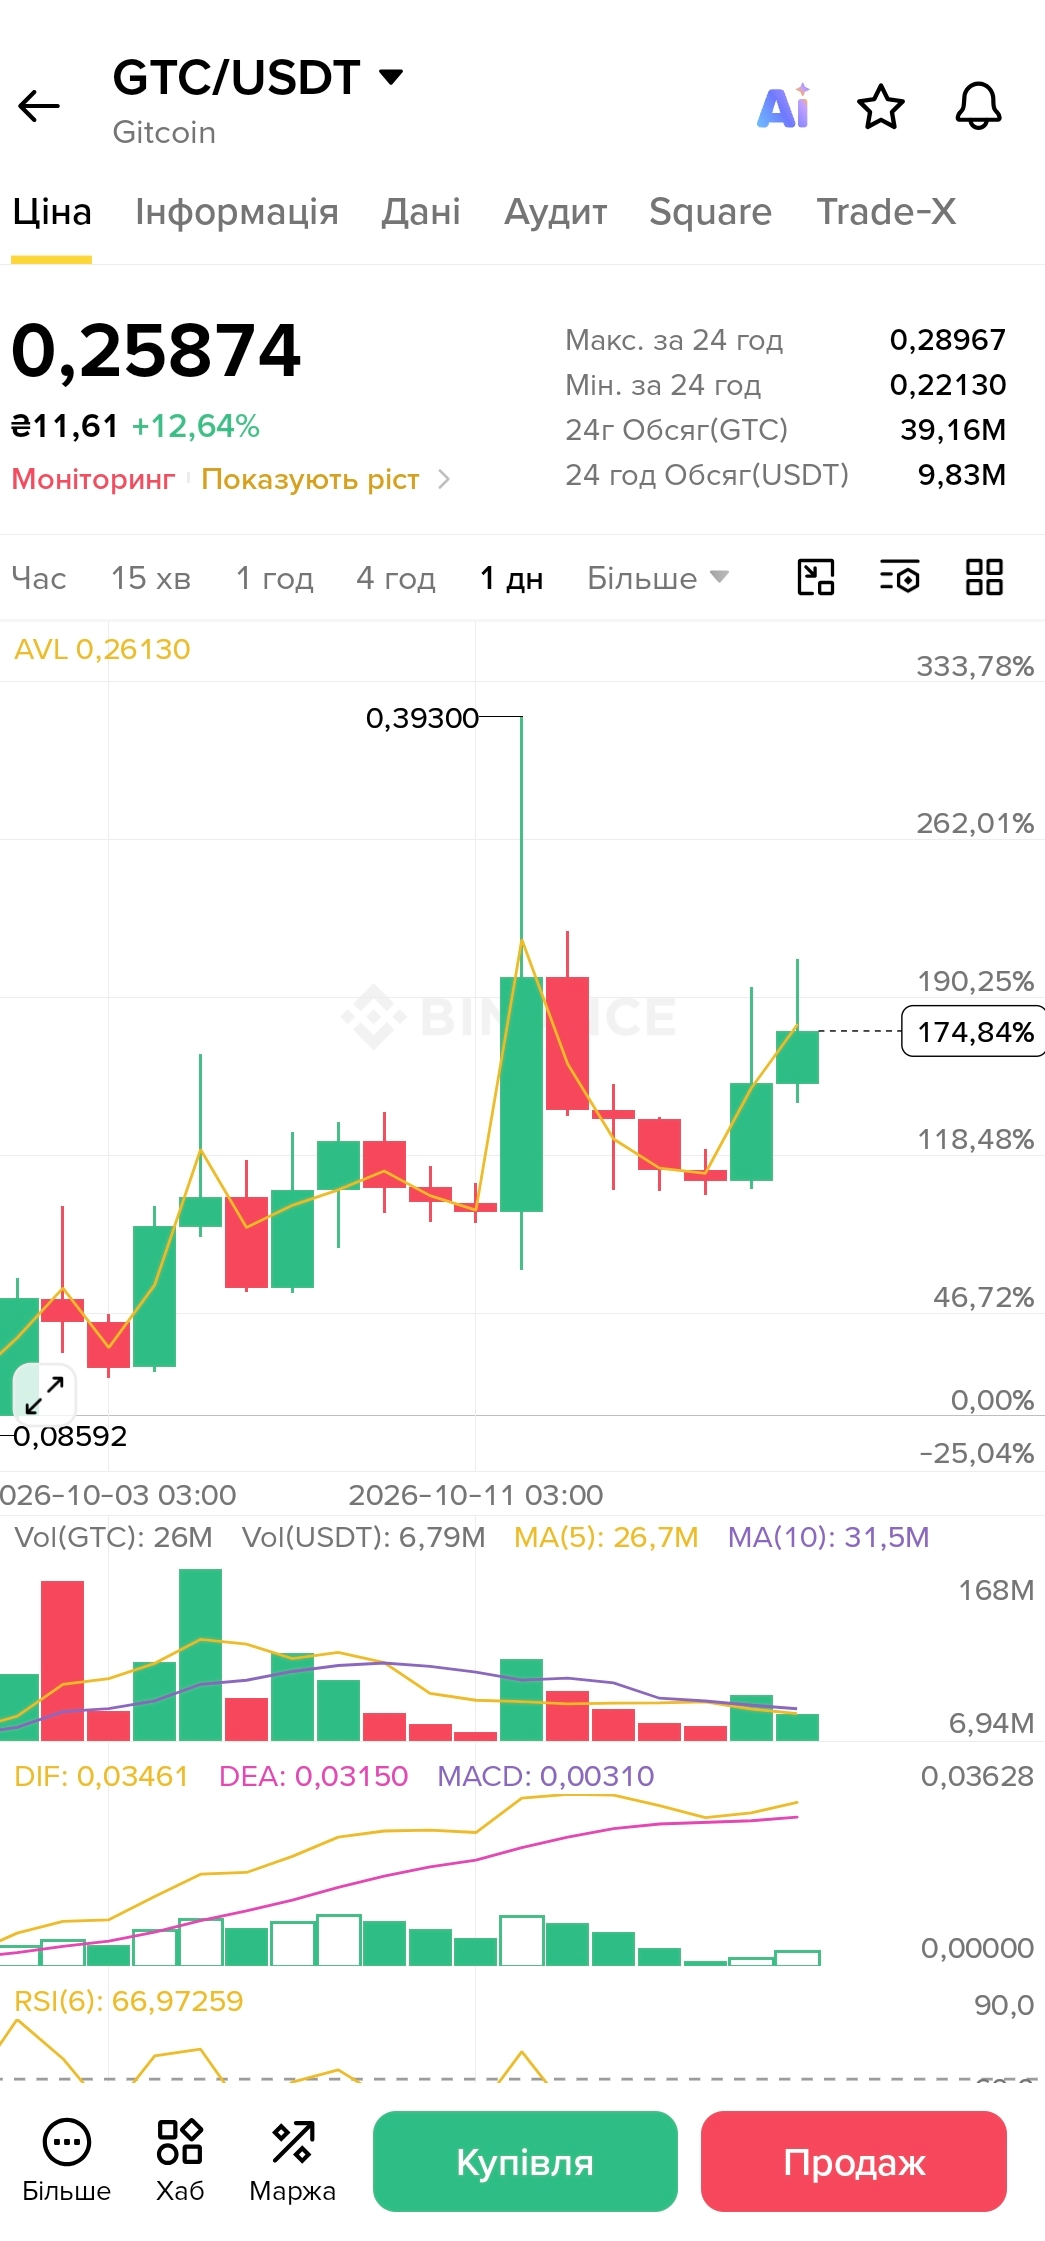
Price metrics: The 24-hour high was recorded at 0.28967 USDT, while the low was 0.22130 USDT. Recall that the previous explosive peak reached 0.39300 USDT.
Trading volume: The daily turnover is 9.83 million USDT (with a volume of 39.16 million GTC), confirming moderate buyer activity.
Technical indicators:
MACD: The DIF line (0.03461) is above DEA (0.03150), and the histogram is turning green (MACD: 0.00310), supporting a positive outlook.
RSI(6): At a comfortable 66.97, indicating bullish momentum without critically overbought conditions.
⚠️ Watch how price behaves around local resistance levels. Be sure to follow risk management practices and set stop-losses!
💬 What do you think about GTC? Will the coin retest the 0.39 USDT level? Share your thoughts in the comments! 👇
#BinanceSquare #GTC #Gitcoin #cryptotrading #TechnicalAnalysis #Altcoins


