

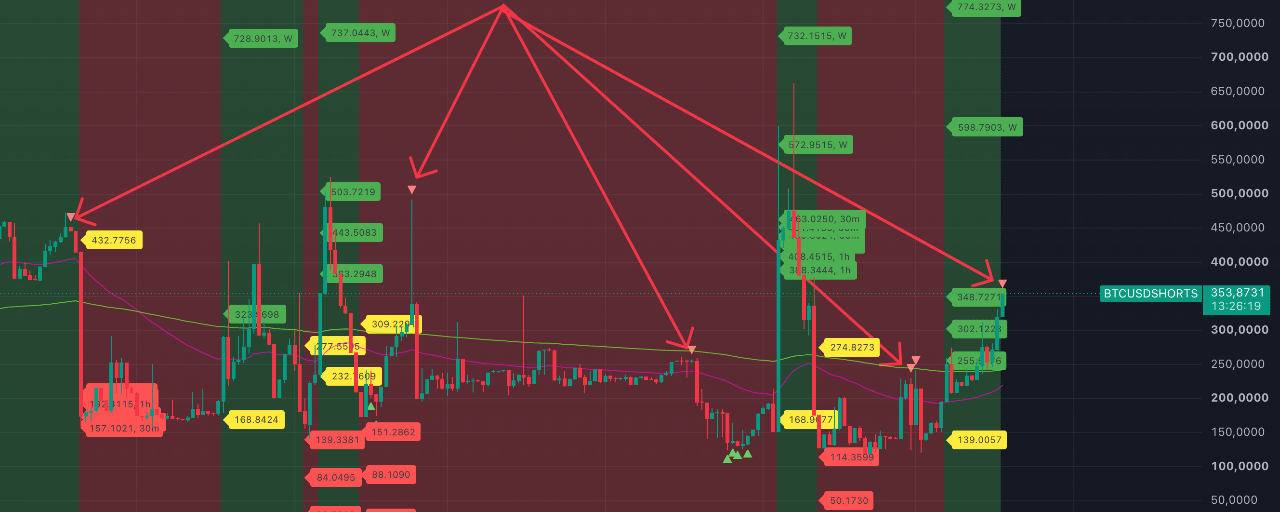


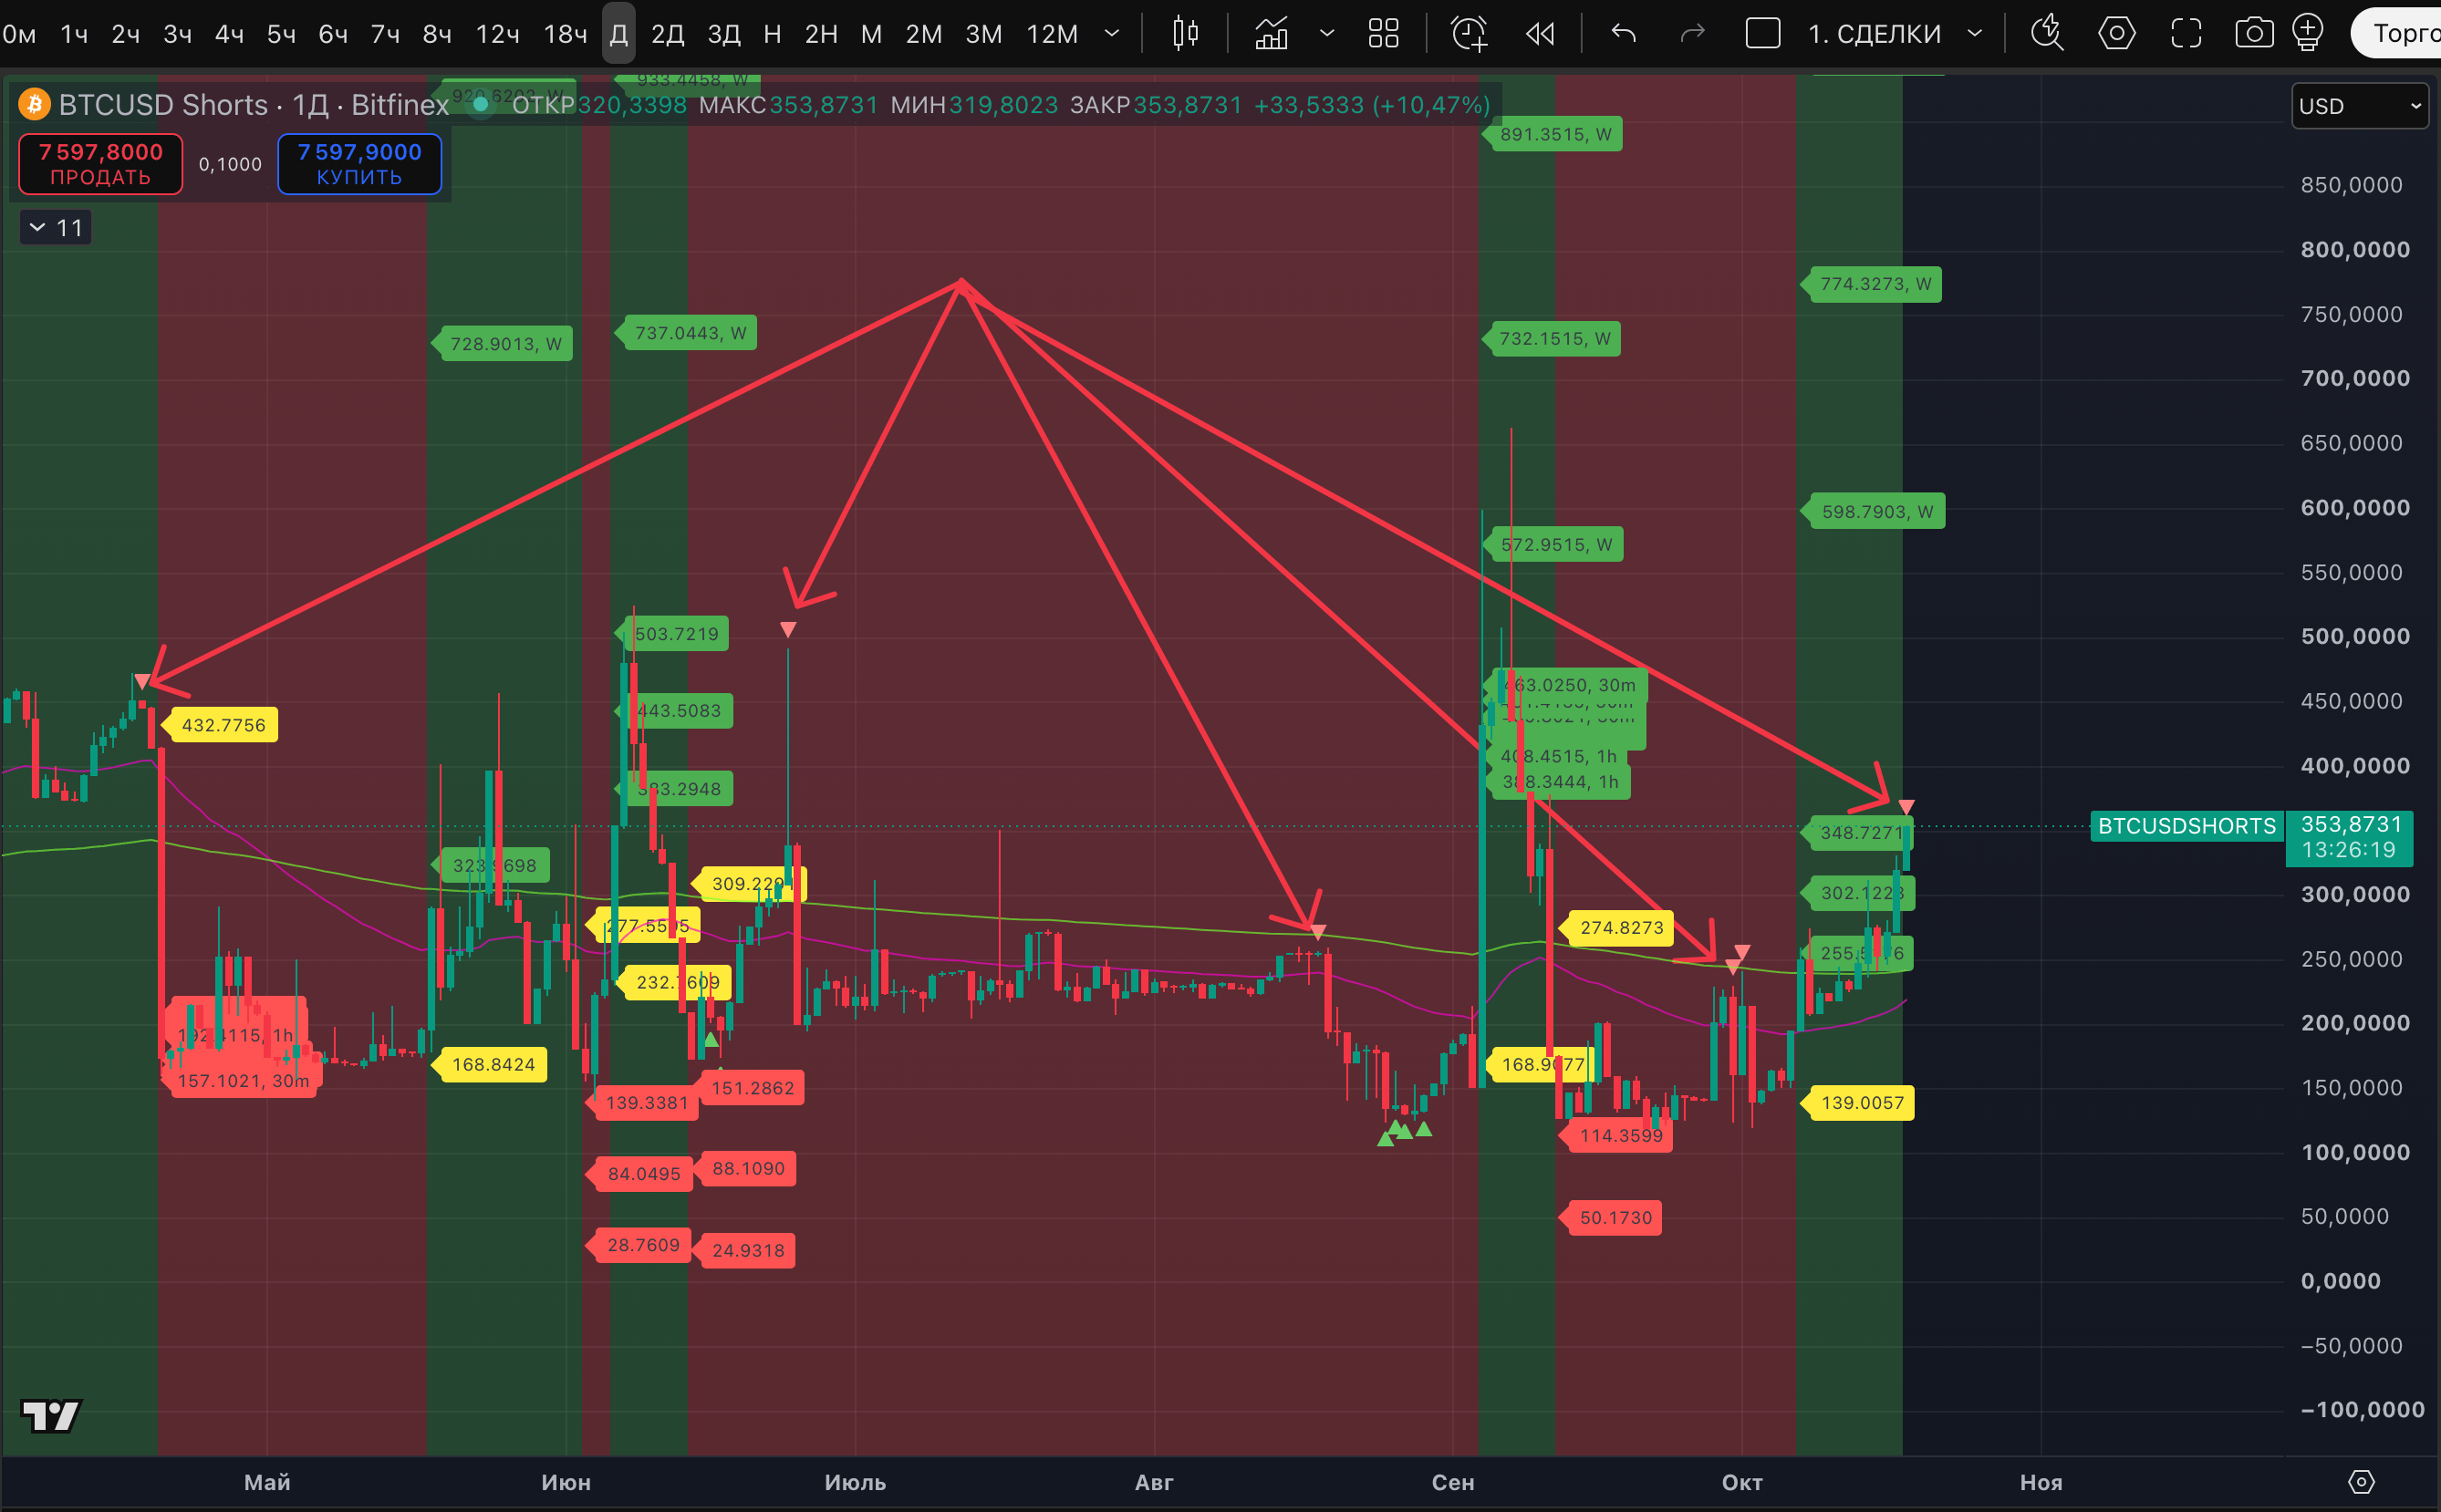
The BTCUSDSHORTS metric once again suggests that short pressure may ease over the next three days. A potential high marker from our indicator has appeared on the daily chart.
The last time markers like these appeared was on September 30, August 18, June 24, and April 18.
We’re showing these dates on the #BTC price chart, along with the price action following signals like these. They’re not signals saying “it’s only going up from here,” but they’re definitely worth keeping in mind overall.
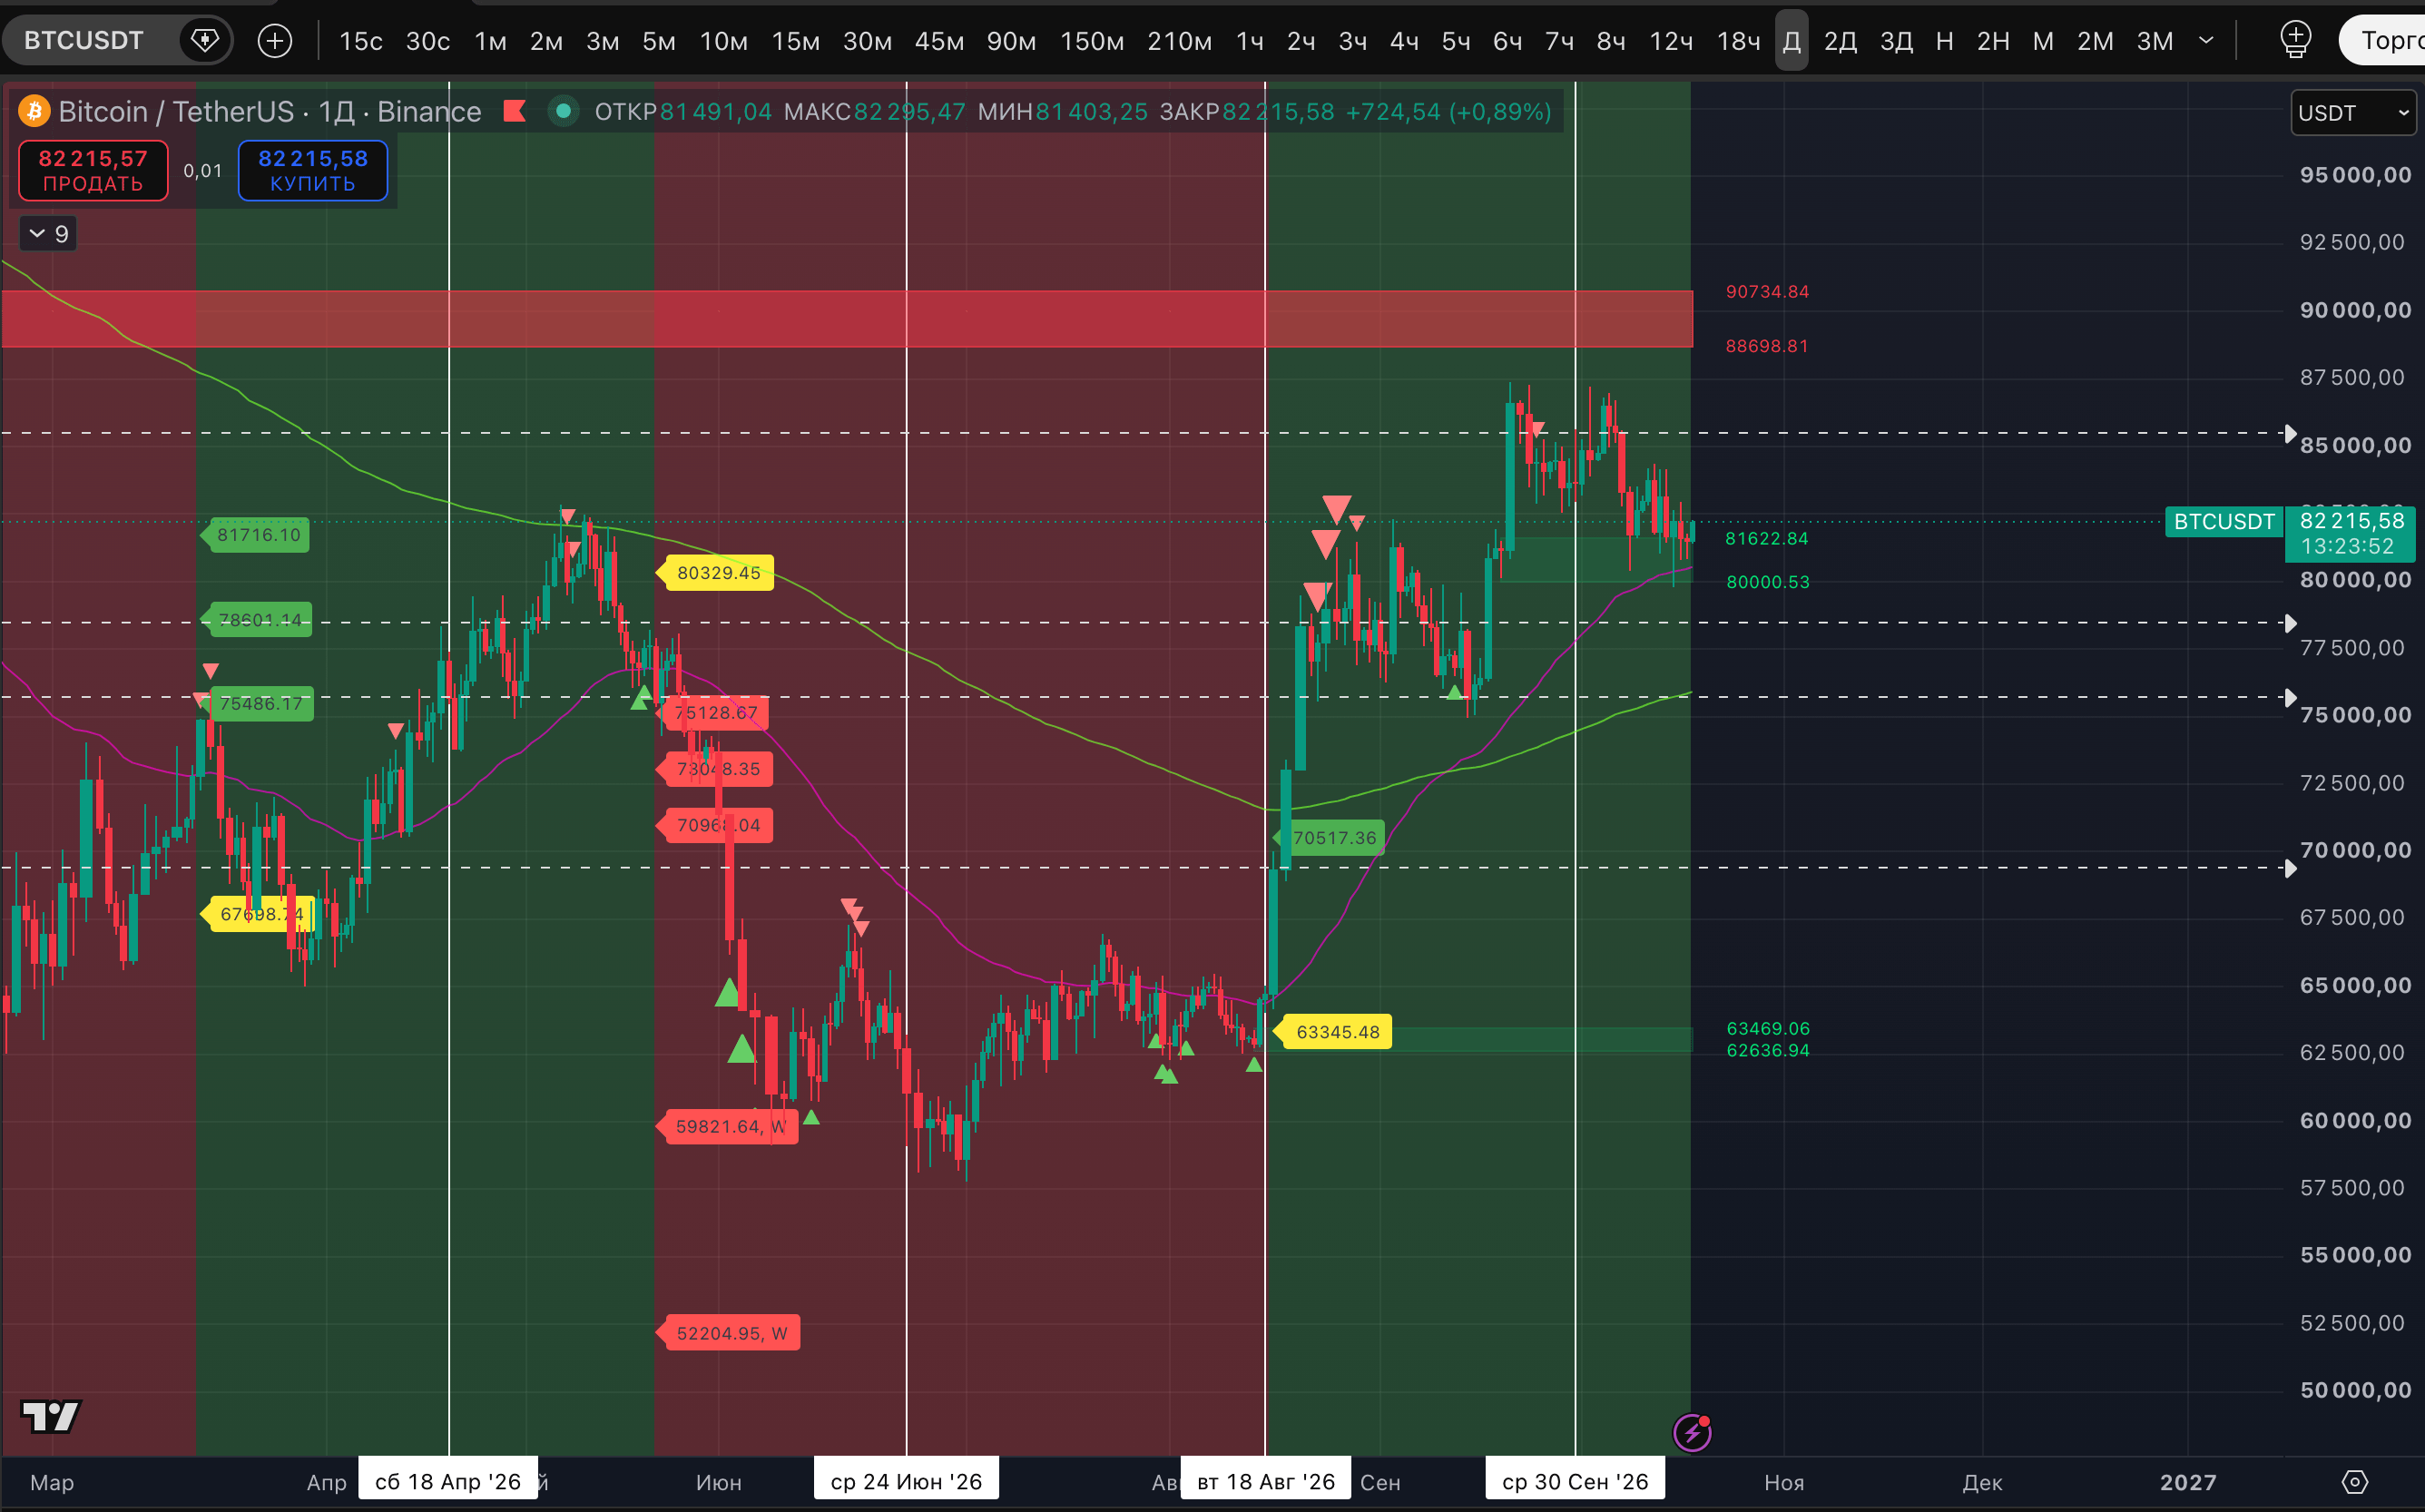
Given that there could be up to three markers, this refers specifically to the three days mentioned in the headline. So if sellers don’t move the price into a new price range on October 18–20 (that is, if they don’t trigger a significant dump and push the price below $80,000), the price could be driven higher. At least if selling pressure eases and buyers’ interest returns.
It’s also important that, on the three previous occasions, just one marker was enough to reverse BTCUSDSHORTS downward. This short squeeze could happen as soon as today. What’s more, with today’s rise, BTC’s price has already entered a sustained uptrend on the hourly and 1.5-hour timeframes. We’ll take a closer look at its chart separately.
A reminder: BTCUSDSHORTS, like BTCUSDLONGS, is a metric from the Bitfinex crypto exchange. Analyzing these metrics helps draw conclusions about the behavior of “smart money.” BTCUSDLONGS shows the total volume of open BTC/USD margin long positions on the exchange. The corresponding short-position metric is BTCUSDSHORTS.
When analyzing the chart of the number of long positions, we rely on sustained trends in our indicator (the chart often moves in a sine-wave pattern and is inversely correlated with the asset’s price). For the number of short positions, we rely on extreme signals—the markers for highs and lows.