


Let's take a look at the current situation with AVA (AVA), which has shown an impressive upward surge after consolidating at a local bottom, gaining +25.47% in 24 hours and trading at 0.3902 USDT.
Key points and technical analysis from the chart:
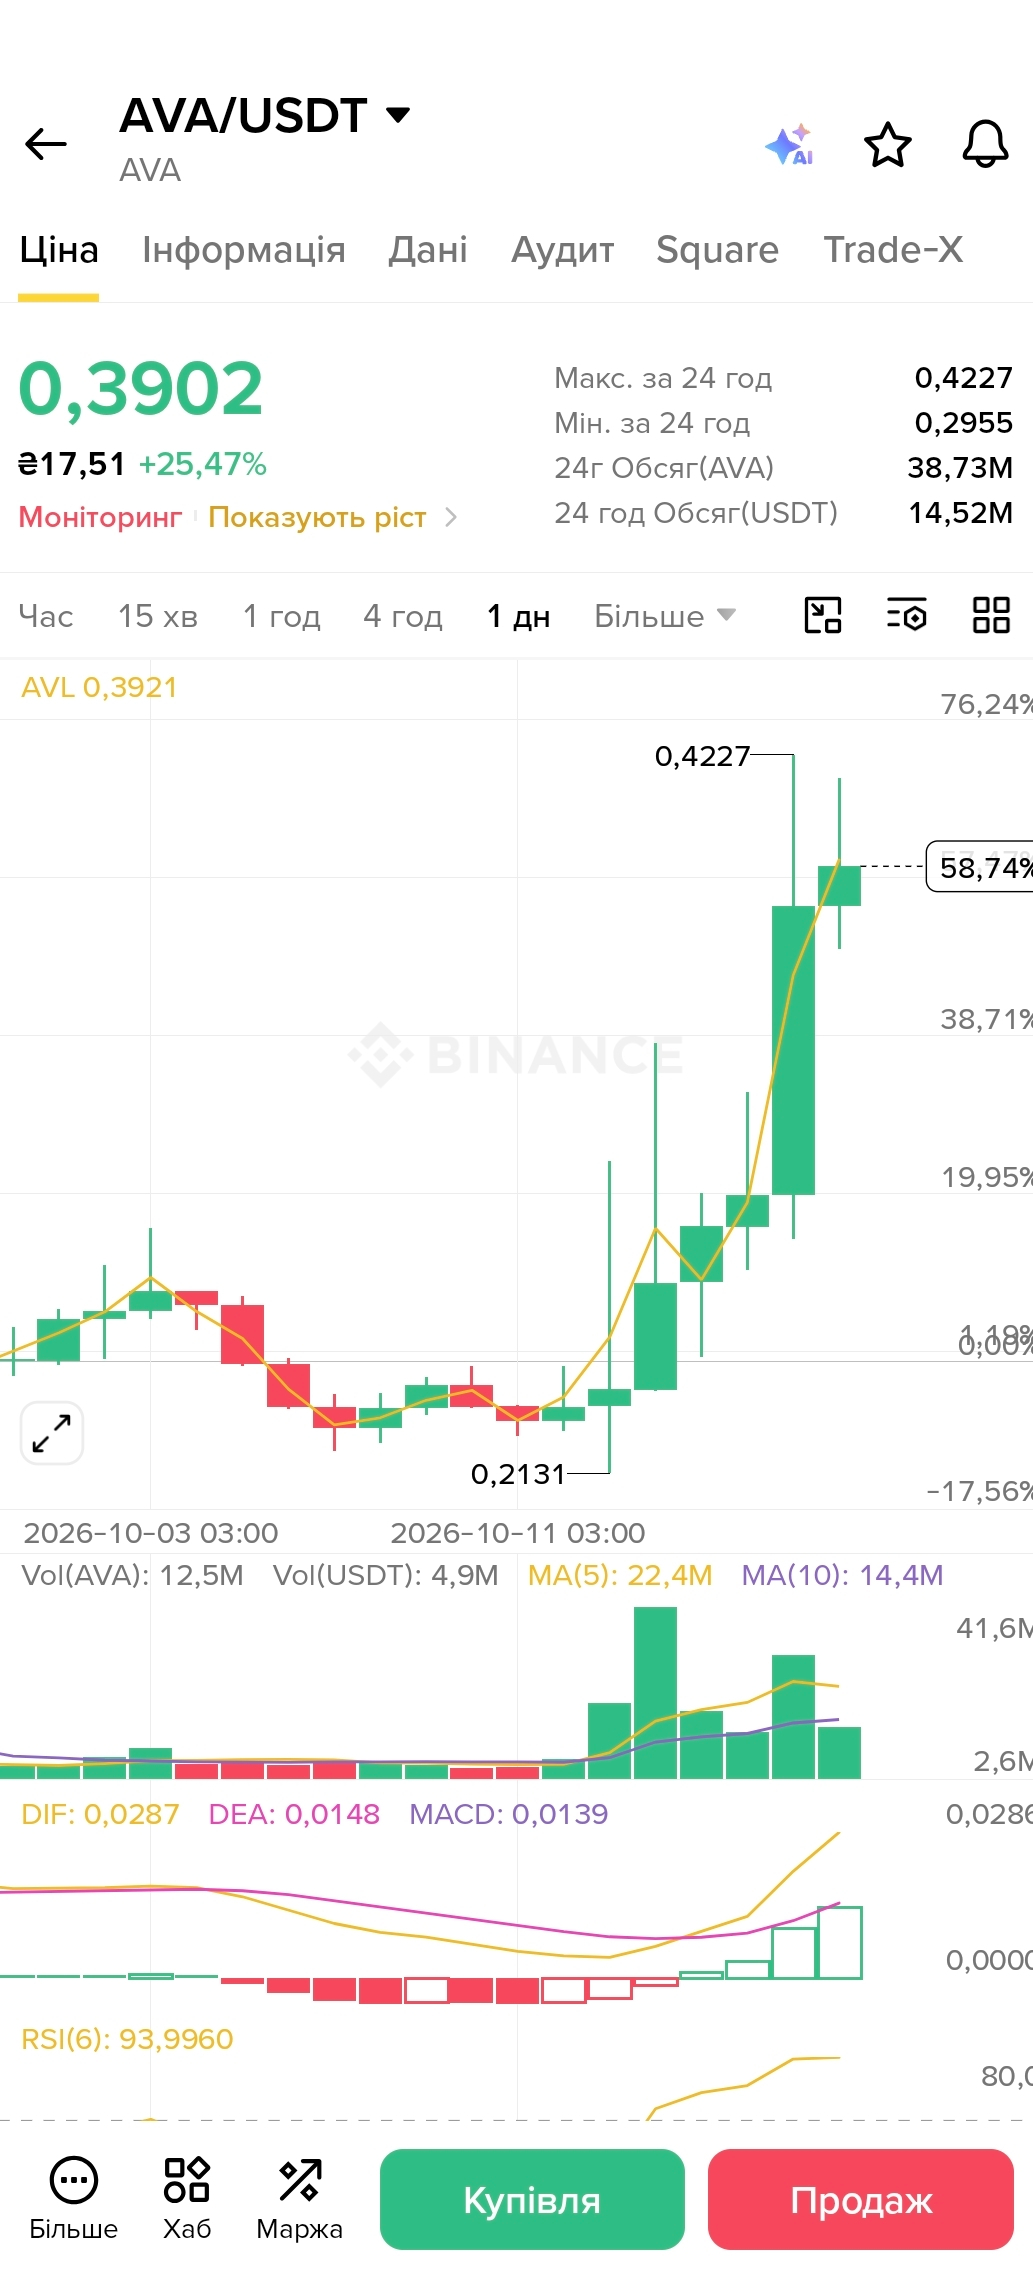
Price metrics: The 24-hour high reached 0.4227 USDT, while the low was 0.2955 USDT. A powerful rally began from a local low of 0.2131 USDT.
Trading volume: Daily turnover has increased noticeably to 14.52 million USDT (with a volume of 38.73 million AVA), confirming an active influx of liquidity.
Technical indicators:
MACD: The histogram is expanding confidently in the green zone, while the DIF line (0.0287) is moving significantly above DEA (0.0148), sustaining a strong bullish signal.
RSI(6): It has surged to an extreme reading of 93.99, indicating that the asset is critically overbought on the daily timeframe.
⚠️ An RSI above the 80–90 levels signals a high likelihood of a local correction or profit-taking by major players. Don't give in to FOMO—be sure to set stop-losses and manage your risk!
💬 What do you think about AVA? Are you waiting for a breakout above 0.42 USDT, or will the coin see an RSI cooldown? Share your thoughts in the comments! 👇
#BinanceSquare #AVA #cryptotrading #TechnicalAnalysis #altcoins


