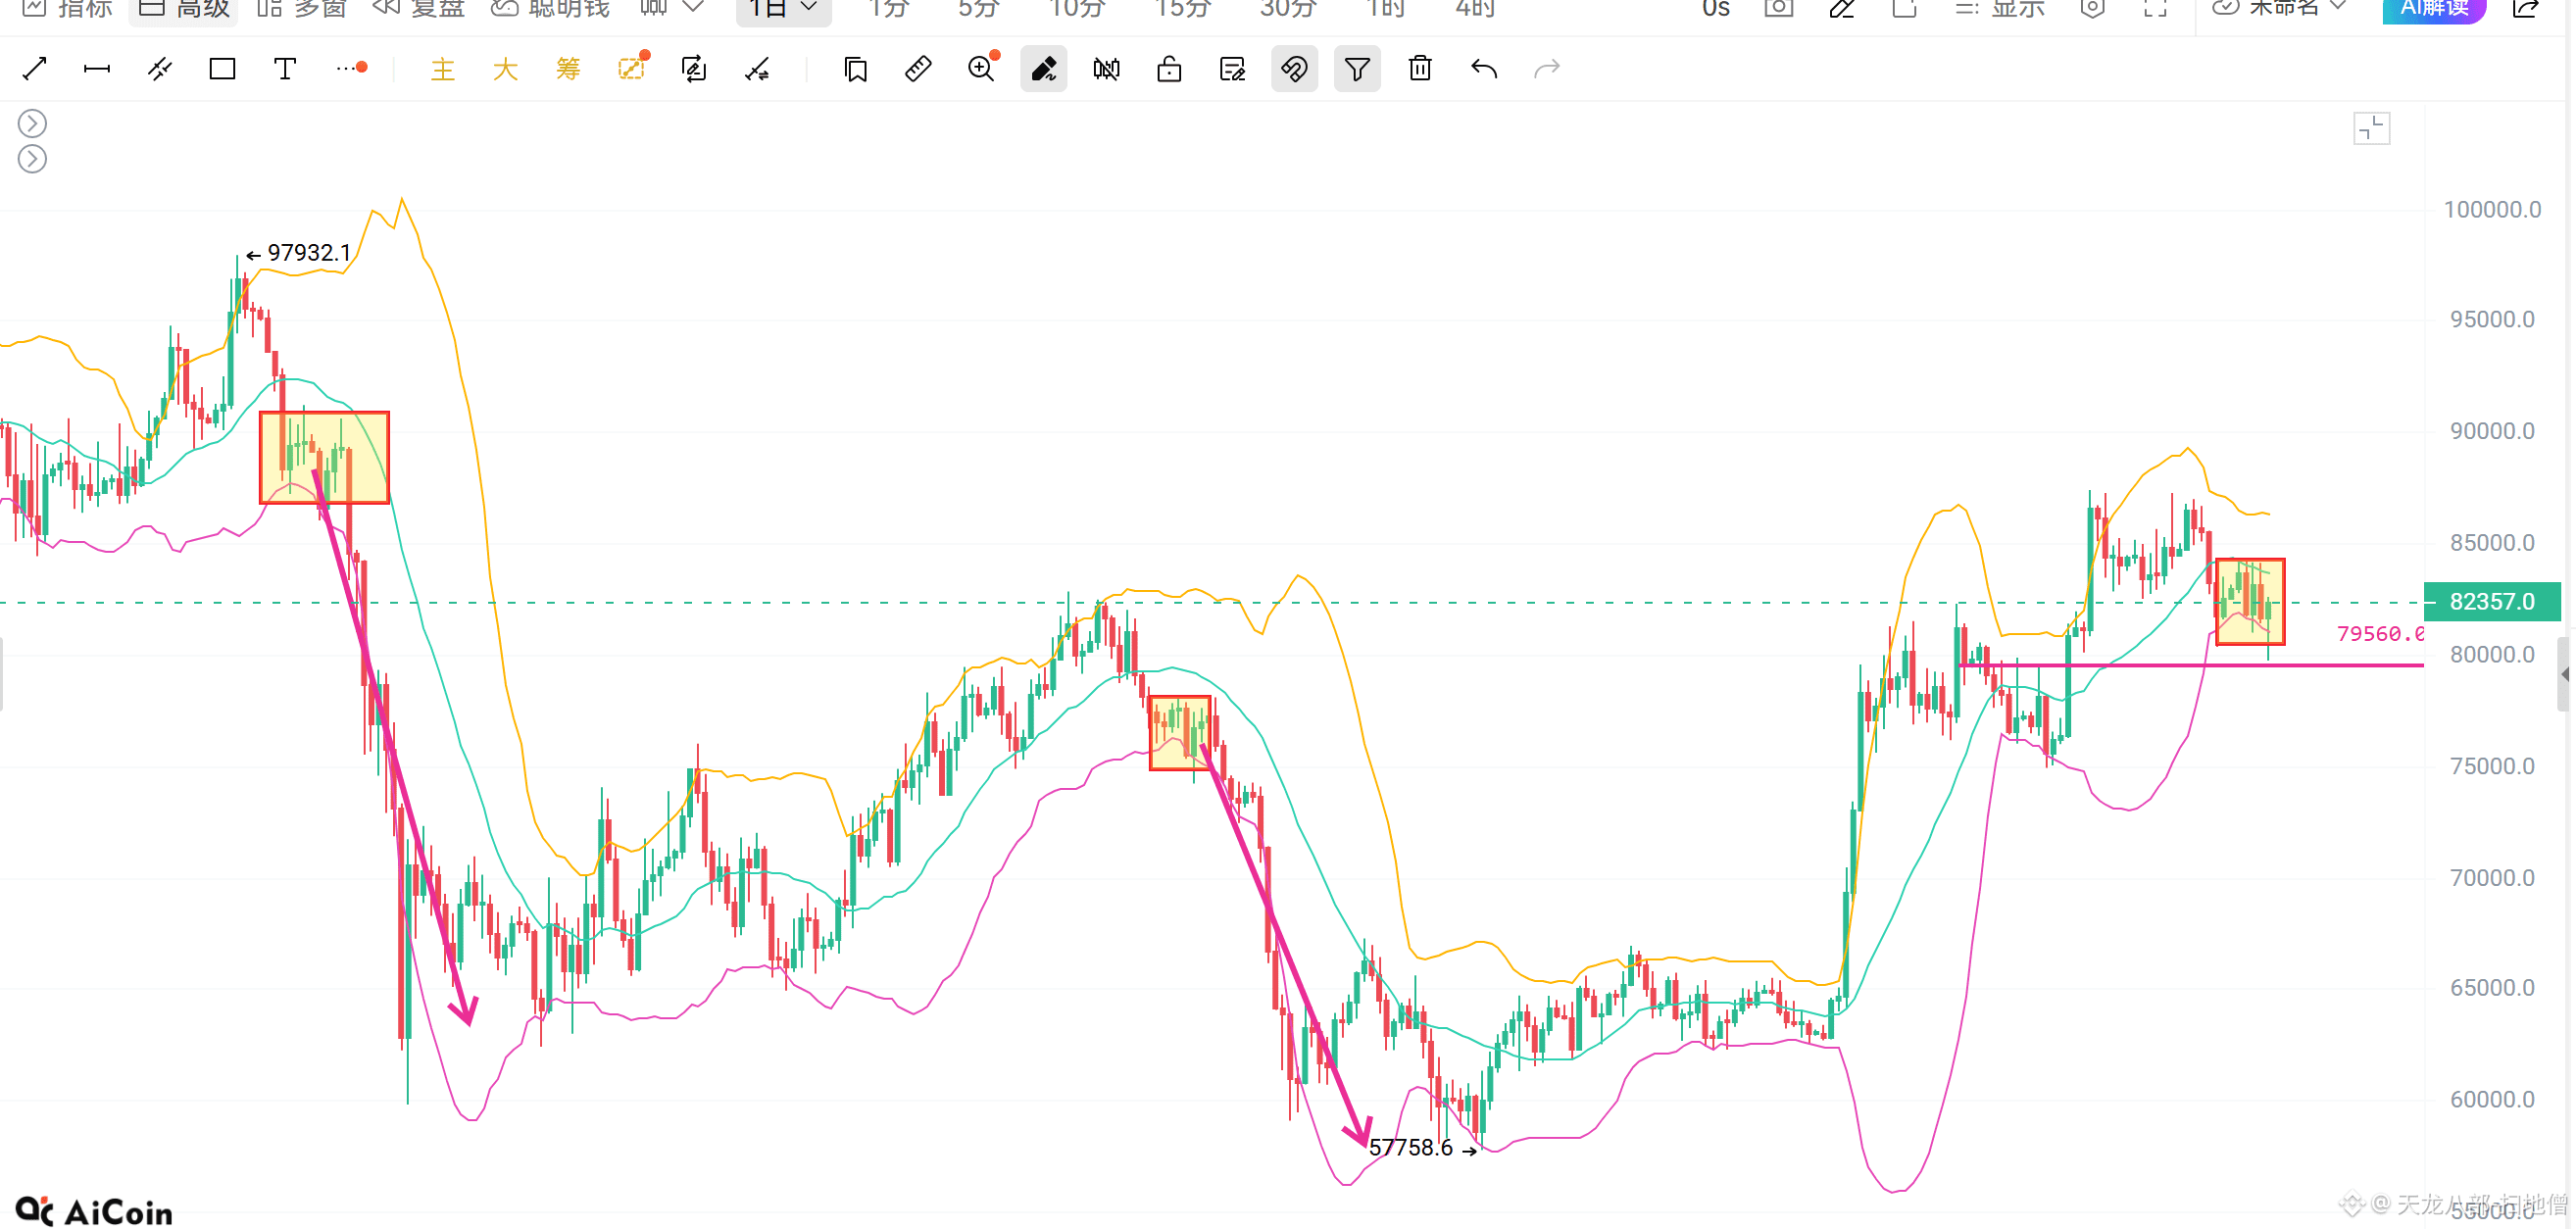
$BTC , I'll say it again: the two drops in January and May 2026 also came after the daily Bollinger Bands oscillated between the middle and lower bands, then broke below the lower band support and entered a downtrend. But as I said last time, this time doesn't have that indicator pattern.
One thing to keep in mind: the market is currently in a relatively low-liquidity period, and institutions hold large amounts. The market has already been churning excessively and setting bear traps.
For example, last night the PPI figures came out and U.S. stocks fell at the open. BTC seemed to break below 80,000, but I emphasized during the livestream that the overshoot wouldn't be too large. Also, because the candle that closed out yesterday's daytime decline didn't have a perfect shape, a sharp downward wick followed by a close was highly likely. I specifically mentioned that the 4-hour indicators had already signaled that the end of this drop was near. I'm firmly bullish, not bearish. Don't chase these overshoots, or you'll get burned easily.
Take September, after the rate hike, for example: the market rallied from 75,000 to 87,300. I warned that a rise was inevitable, but 84,500–85,000 was an extreme resistance zone, though the price might overshoot. We projected that overshoot to 87,000. As soon as it reached 85,000, we began building short positions in batches.
At the time, the market looked to be in a choppy downtrend from the 87,300 resistance level. I saw 80,000 and 79,500 as lower targets, with 78,000 as the extreme, while keeping 75,000 in play. You can go back and check my posts; if I remember correctly, that's what I said. Later, because the market didn't make the kind of move that would repair the weekly indicators, I moved the support level down to an extreme of 81,600, with an overshoot to 80,000, rather than the extreme 78,000 or even 75,000. In fact, when the market fell yesterday after the CPI figures came out, the chart indicators and candlestick pattern made me very interested in the possibility that the PPI release, combined with the U.S. stock market open, would be used to bait traders into shorting. As it turned out, that's exactly what happened.
Remember: market makers have tight control of the market. Most so-called resistance and support levels will be overshot by 1,000–2,000 points, or fall short by 1,000–2,000 points. In any case, unlike before, prices rarely hit a level within just 300–500 points—or with zero error. The market isn't moving smoothly, so take it steady. Any gains are better than none; just keep it sensible, haha 😁😁😁
One thing to keep in mind: the market is currently in a relatively low-liquidity period, and institutions hold large amounts. The market has already been churning excessively and setting bear traps.
For example, last night the PPI figures came out and U.S. stocks fell at the open. BTC seemed to break below 80,000, but I emphasized during the livestream that the overshoot wouldn't be too large. Also, because the candle that closed out yesterday's daytime decline didn't have a perfect shape, a sharp downward wick followed by a close was highly likely. I specifically mentioned that the 4-hour indicators had already signaled that the end of this drop was near. I'm firmly bullish, not bearish. Don't chase these overshoots, or you'll get burned easily.
Take September, after the rate hike, for example: the market rallied from 75,000 to 87,300. I warned that a rise was inevitable, but 84,500–85,000 was an extreme resistance zone, though the price might overshoot. We projected that overshoot to 87,000. As soon as it reached 85,000, we began building short positions in batches.
At the time, the market looked to be in a choppy downtrend from the 87,300 resistance level. I saw 80,000 and 79,500 as lower targets, with 78,000 as the extreme, while keeping 75,000 in play. You can go back and check my posts; if I remember correctly, that's what I said. Later, because the market didn't make the kind of move that would repair the weekly indicators, I moved the support level down to an extreme of 81,600, with an overshoot to 80,000, rather than the extreme 78,000 or even 75,000. In fact, when the market fell yesterday after the CPI figures came out, the chart indicators and candlestick pattern made me very interested in the possibility that the PPI release, combined with the U.S. stock market open, would be used to bait traders into shorting. As it turned out, that's exactly what happened.
Remember: market makers have tight control of the market. Most so-called resistance and support levels will be overshot by 1,000–2,000 points, or fall short by 1,000–2,000 points. In any case, unlike before, prices rarely hit a level within just 300–500 points—or with zero error. The market isn't moving smoothly, so take it steady. Any gains are better than none; just keep it sensible, haha 😁😁😁