



Hey everyone, have you ever had this happen? Bitcoin dips, and the whole feed is flooded with “Run!” and “It’s going to zero!” You panic too and, with one twitch of your finger, sell at the bottom. Then right after you sell, it starts shooting back up, and you’re so mad you want to throw your phone. Don’t rush to blame yourself for having weak hands. Today, I’ll teach you a strategy that institutions and seasoned on-chain veterans pay attention to: on-chain cost distribution. Once you understand it, you’ll know when to panic and when to stay calm. This is exactly the kind of mindset you need to remember subconsciously: “institutions buy the dip while retail gets flushed out.”
Let’s start with a simple idea. Every bitcoin has a “price at which it last changed hands”—in other words, the cost basis when that coin landed in its current holder’s hands. Average out the cost basis of all the coins, and you get the “realized price”—which you can think of as the average cost basis of all holders across the market. It’s like a stock: you want to have a rough idea of the average price at which all shareholders bought in.[1]
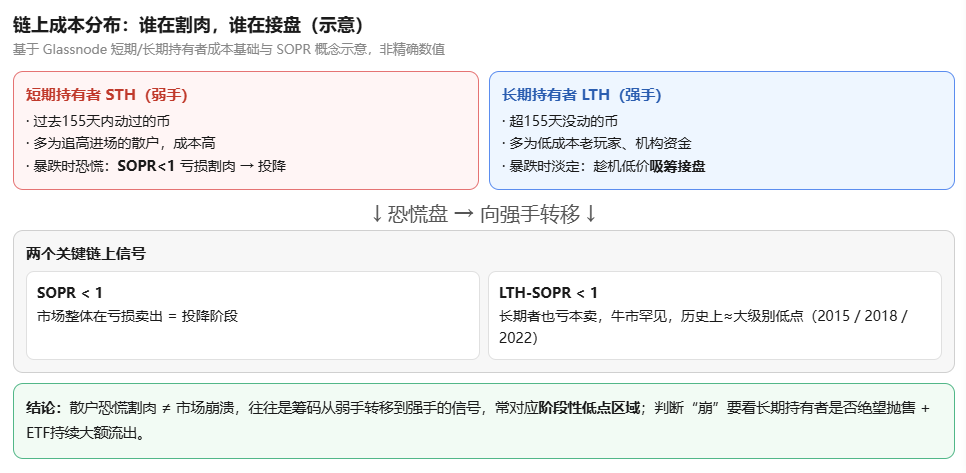
Looking only at the market-wide average is still too broad; the key is to break it down by holder group. On-chain analysis uses the time a coin last moved as a label: coins that have moved within the past 155 days are attributed to short-term holders—mostly retail investors who bought in at higher prices and are more prone to panic, or “weak hands.” Coins that haven’t moved for more than 155 days are attributed to long-term holders—mostly established investors and institutions with a lower cost basis who can hold on, or “strong hands.”[1][2]
Why make such a fine distinction? Because in every sharp downturn, it’s almost always short-term holders who sell in panic. Their cost basis is high, and a drop of just a few percentage points can be too much for them; when they sell, they often do so at a loss. There’s an on-chain indicator called SOPR: above 1 means people are selling at a profit; below 1 means they’re selling at a loss. When SOPR stays below 1, the market enters a “capitulation” phase—many people can’t take it anymore and sell at rock-bottom prices.[3]
An even stronger signal is when LTH-SOPR falls below 1, meaning even long-term holders are starting to sell at a loss. This is very rare in a bull market, and historically, every time it has happened, it has broadly coincided with a major bottom—January 2015, December 2018, and November 2022 all followed this pattern. Earlier this year, long-term holders realized roughly $2.4 billion in losses over 48 hours, and the comments section erupted: some said it was over and the price was going to zero; others said it was the final shakeout.[4]
Here’s the key: panic selling by retail investors is precisely when stronger holders step in to buy. The coins you sell are picked up by people with a much lower cost basis who can hold on. That’s also why institutional investors, such as spot ETFs, dare to quietly accumulate during a sharp downturn—they’re not looking at how many percentage points the price fell today, but at whether “strong hands are buying and weak hands are being shaken out.”
So what should ordinary people like us do? Here are two practical points. First, don’t equate a “drop” with a “crash.” A true crash is when even long-term holders are selling in desperation, ETFs see sustained, significant outflows, and the fundamentals are breaking down. By contrast, panic selling by short-term holders is often just coins changing hands to stronger holders—and historically, it has often happened around a short-term bottom. Second, don’t make decisions when panic is at its peak. Look at on-chain data; don’t just focus on whether the price fell today. Look at “who’s selling and who’s buying.”[2][3]
Of course, this doesn’t mean you should see a signal and immediately go all in on buying the dip. On-chain indicators are just a reference; they can’t predict the exact bottom, and the capitulation phase may last from a few weeks to several months. What they really teach us is not to let the fear of a sharp drop lead us around by the nose—understand who holds the coins, and you’ll naturally feel more composed. As the saying goes, stay calm when others are panicking—but first, you need to truly understand why they’re panicking.
To make the “who’s selling and who’s buying” dynamic above easier to understand, here’s a diagram (illustrative, not precise):
Friendly reminder: The above is just my personal interpretation of the industry and does not constitute investment advice.
If you’re interested in trading too, feel free to leave a comment or join the chatroom so we can discuss, learn, and grow together.
