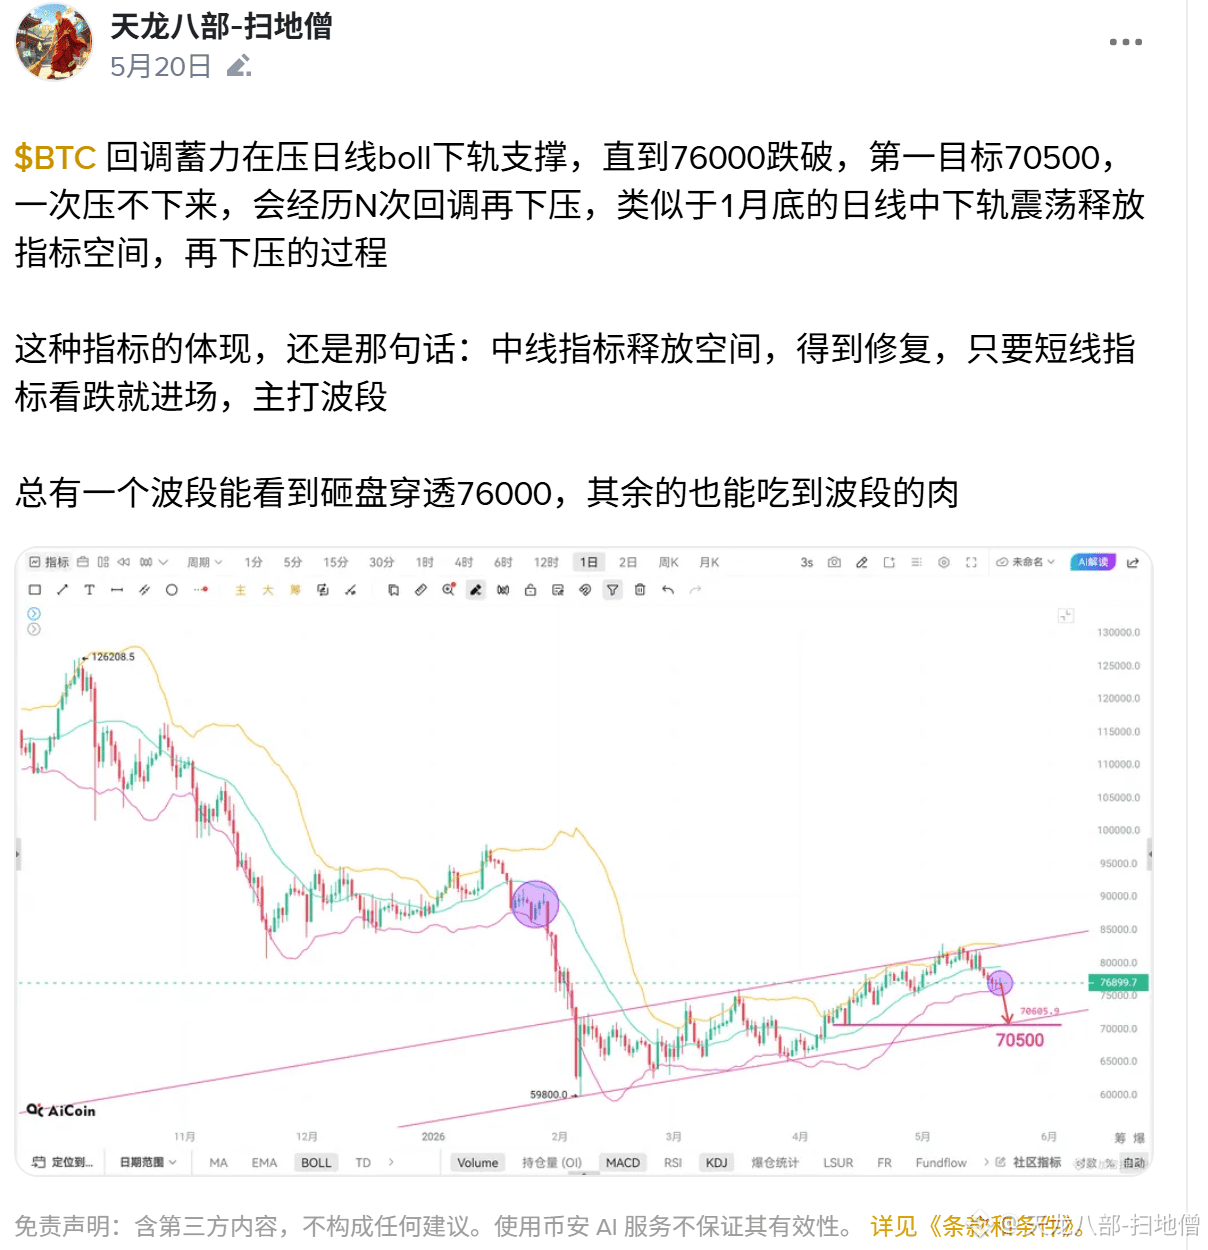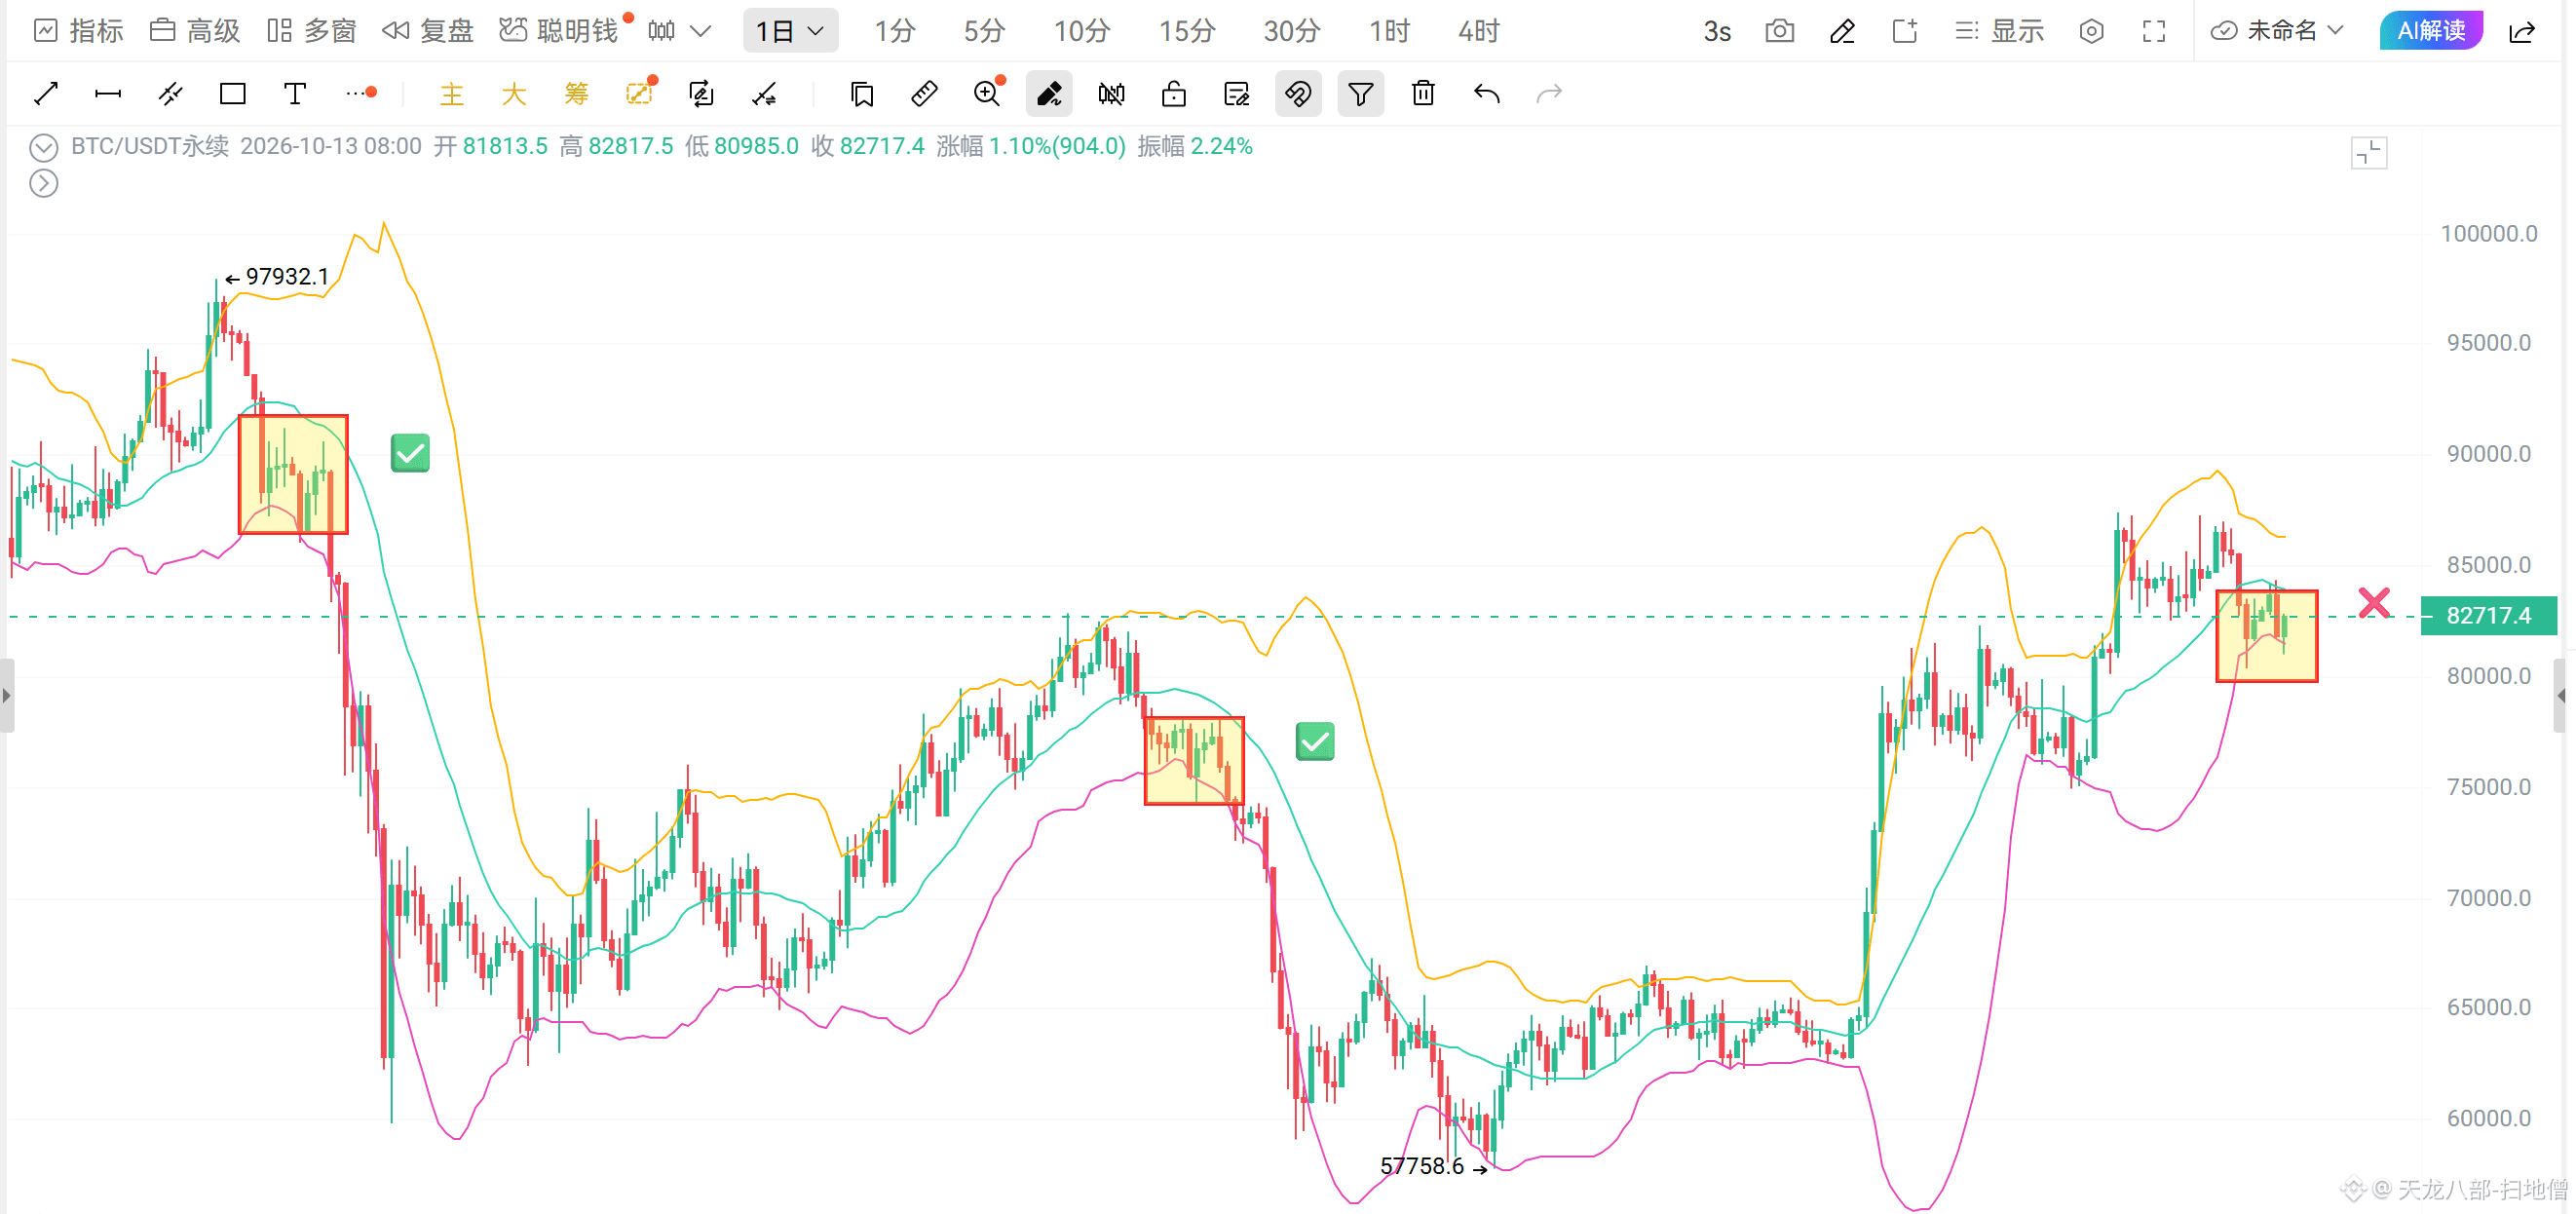
$BTC A lot of people are comparing this market move to January and May 2026, when price fluctuated around the daily chart’s lower Bollinger Band before breaking below it and starting a downtrend. They see this as another breakdown and decline. But in those two cases, I analyzed the market in advance and correctly predicted what would happen. The indicators at the time were very consistent with a downtrend. This time is different.
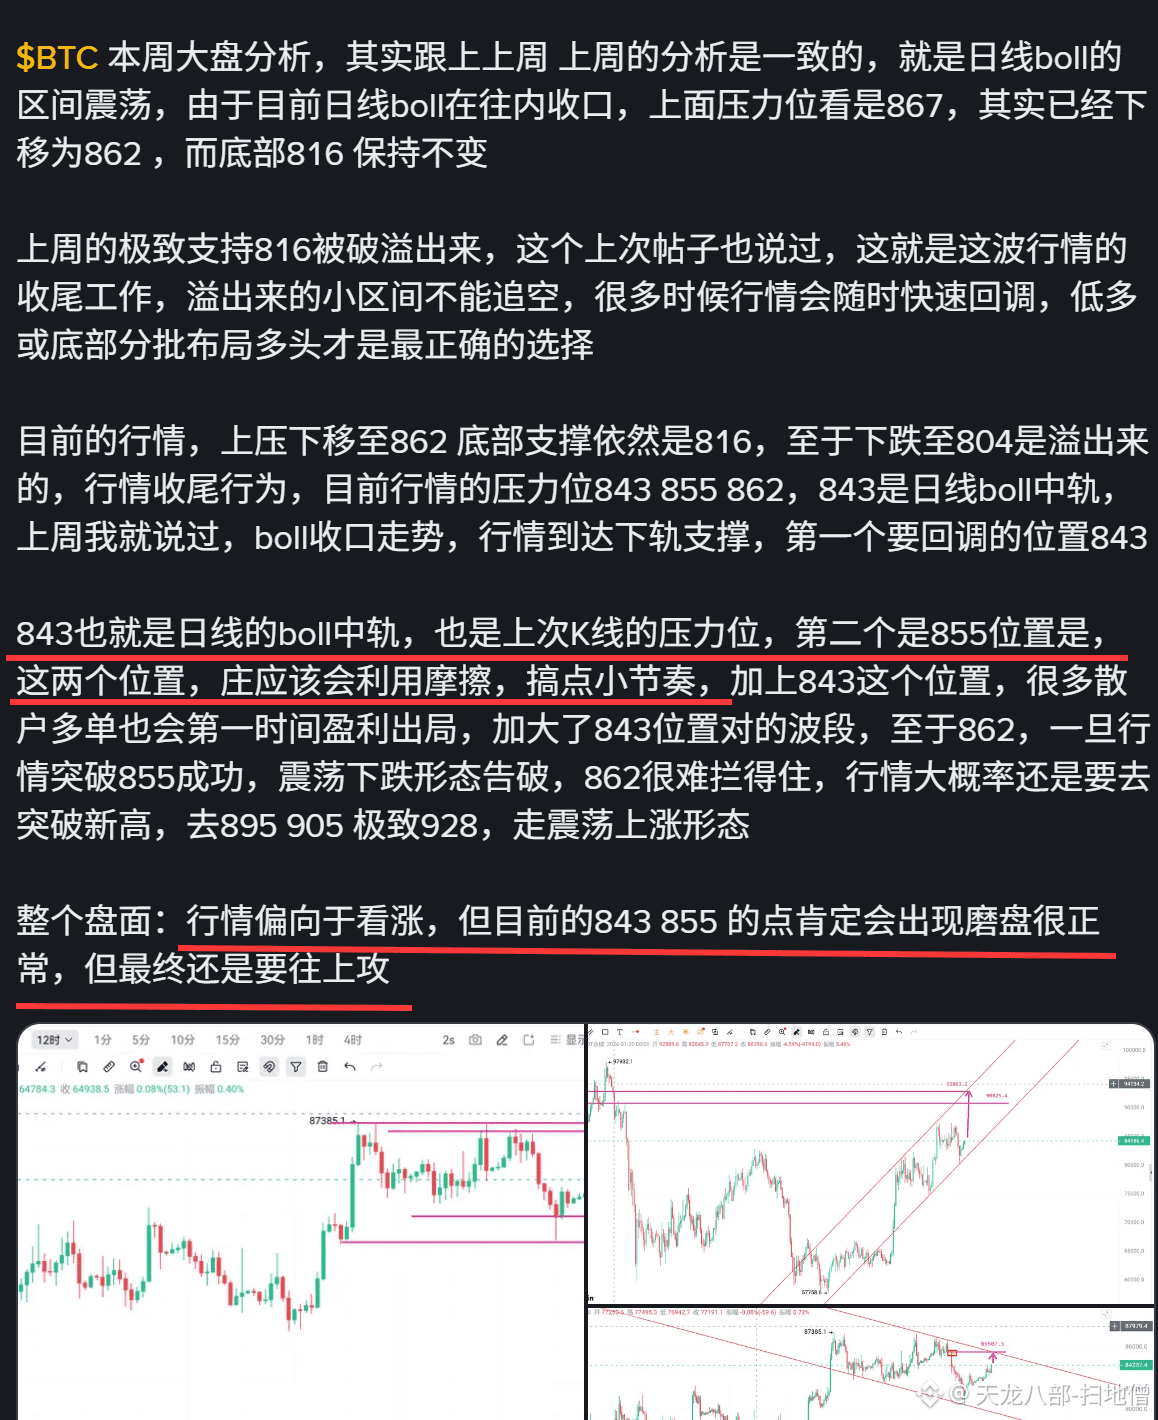
The long-term indicator setup is bullish, not bearish. Only the mid-term indicators may need to adjust sooner than expected. Yesterday, price seemed to stall at the 843 resistance level around the daily Bollinger middle band and then start falling, but this was just normal consolidation. The pullback was indeed larger than I expected. This is also a usual tactic of the market makers lately: they often push price a little further than expected. But it doesn’t affect the overall market trend, and it even gives the mid-term indicators a chance to reset.
When the market plunged this morning, my student messaged me. I woke up, opened the chart, and was completely baffled too. Last night, price seemed to be holding around 816–821 and bouncing, yet it fell all the way to 809. But after checking the indicators, I was completely unfazed. If price overshoots, that’s the market makers’ business. Don’t let it sway you or affect your analysis and judgment.
As I keep saying, the indicators are bullish. Let the market makers grind away at 843 and 855; I’ll just take my share of the profits.
The long-term indicator setup is bullish, not bearish. Only the mid-term indicators may need to adjust sooner than expected. Yesterday, price seemed to stall at the 843 resistance level around the daily Bollinger middle band and then start falling, but this was just normal consolidation. The pullback was indeed larger than I expected. This is also a usual tactic of the market makers lately: they often push price a little further than expected. But it doesn’t affect the overall market trend, and it even gives the mid-term indicators a chance to reset.
When the market plunged this morning, my student messaged me. I woke up, opened the chart, and was completely baffled too. Last night, price seemed to be holding around 816–821 and bouncing, yet it fell all the way to 809. But after checking the indicators, I was completely unfazed. If price overshoots, that’s the market makers’ business. Don’t let it sway you or affect your analysis and judgment.
As I keep saying, the indicators are bullish. Let the market makers grind away at 843 and 855; I’ll just take my share of the profits.