


We’re wrapping up the day and analyzing the market’s hot moves! The GTC (Gitcoin) pair shows a powerful parabolic breakout on the daily timeframe, surging by +63.22% and trading at 0.30194 USDT (after reaching a daily high of 0.39300 USDT, a low of 0.15653 USDT, and with an earlier recorded rally start from the lower range around 0.08285 USDT).
What the technical picture on the chart shows:
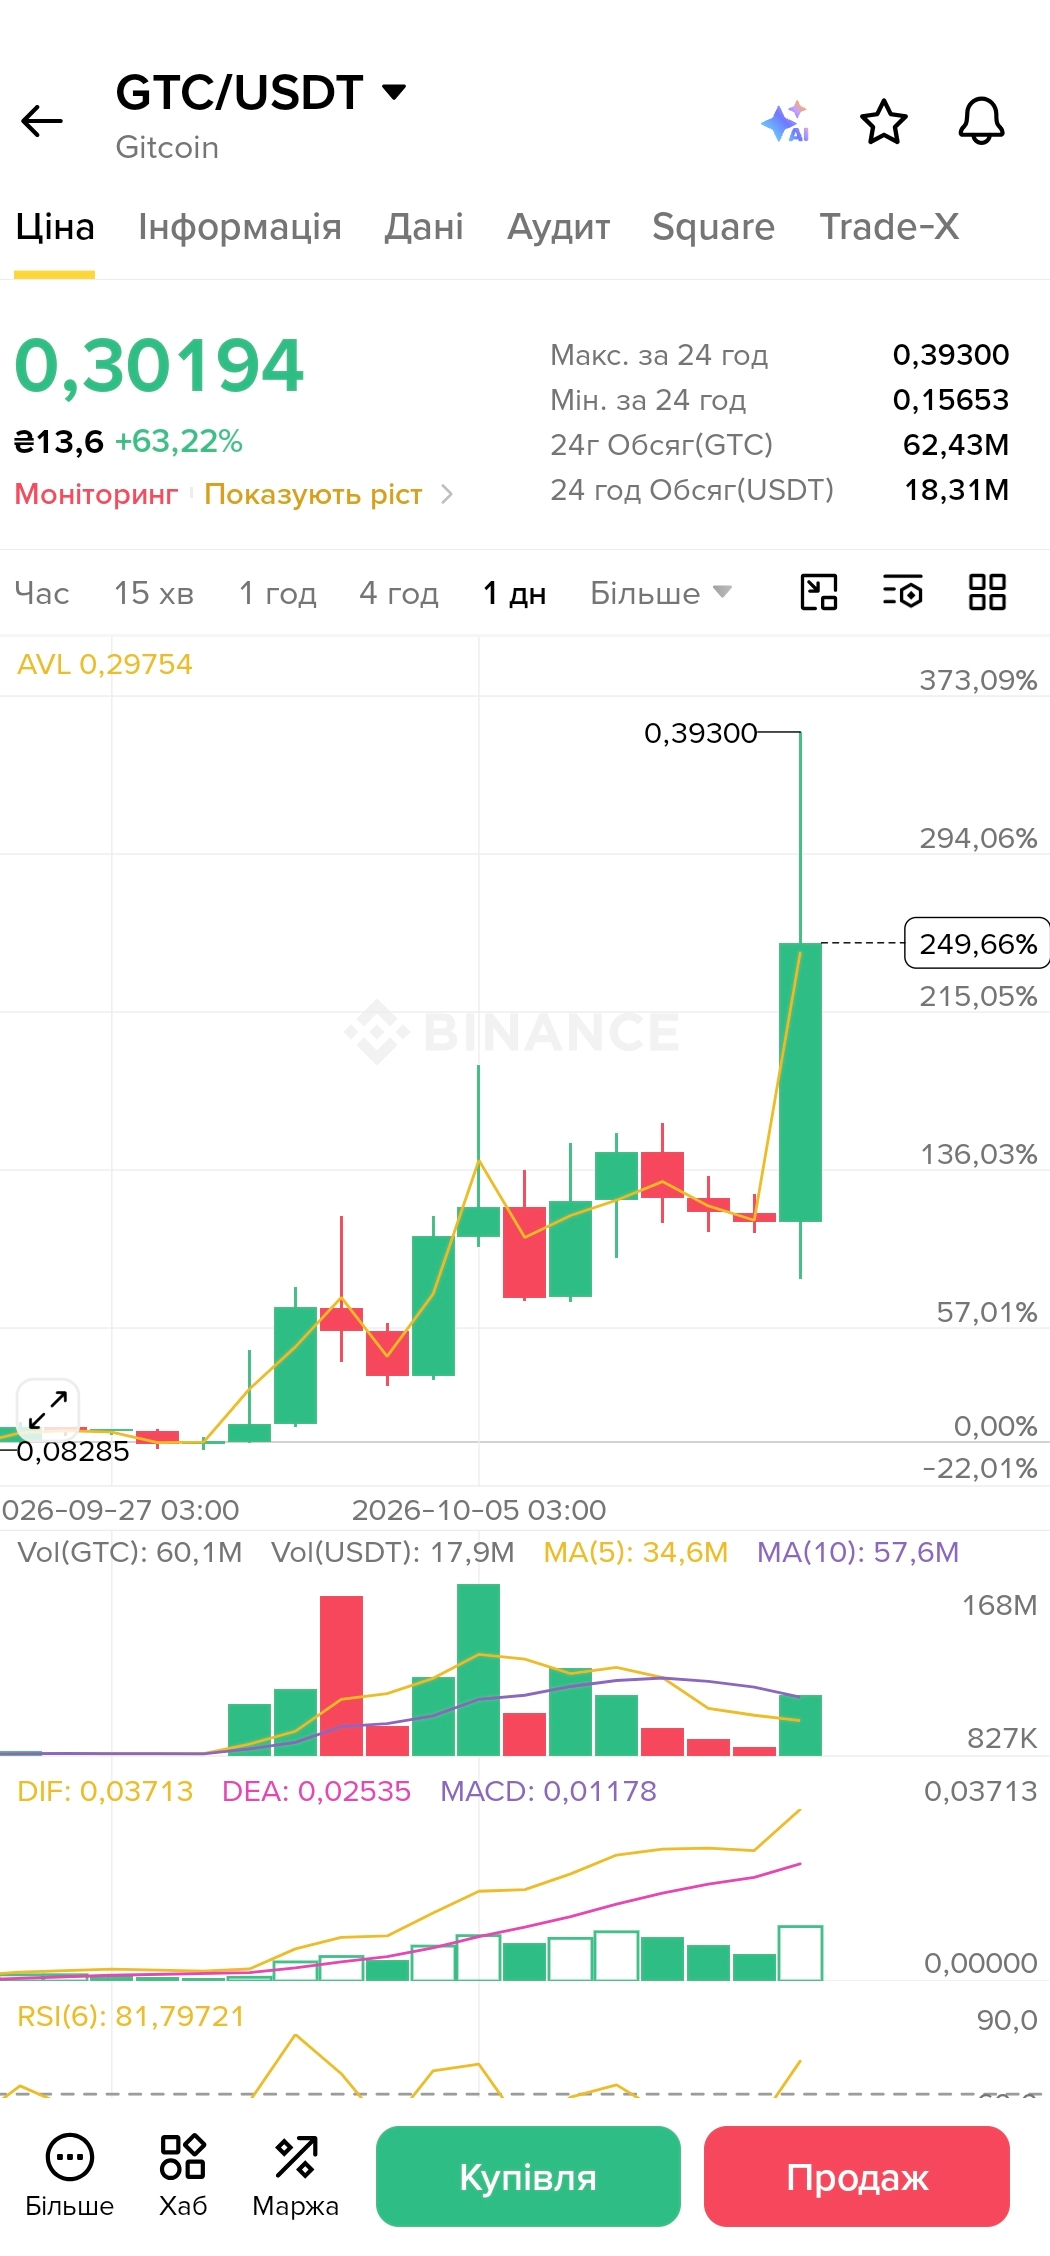
Rally dynamics: A strong vertical green candle confirms a significant influx of liquidity and the absolute dominance of buyers during the current breakout.
Trading volume: Daily turnover reached 18.31 million USDT (with a volume of 62.43 million GTC), indicating strong trader interest in the project.
Technical status: The RSI(6) indicator has settled at a high level of 81.80, indicating that the asset is in a state of intense overbought conditions amid a sharp surge in momentum.
⚠️ Evening trading amid high RSI readings calls for extra caution and discipline. Keep a cool head, follow risk management rules strictly, take profits in stages, and monitor your open positions!
💬 How did your day in the market go? Do you have GTC in your portfolio? Share your thoughts in the comments, and have a great evening, everyone! 👇
#BinanceSquare #GTC #Gitcoin #cryptotrading #altcoins #TechnicalAnalysis