

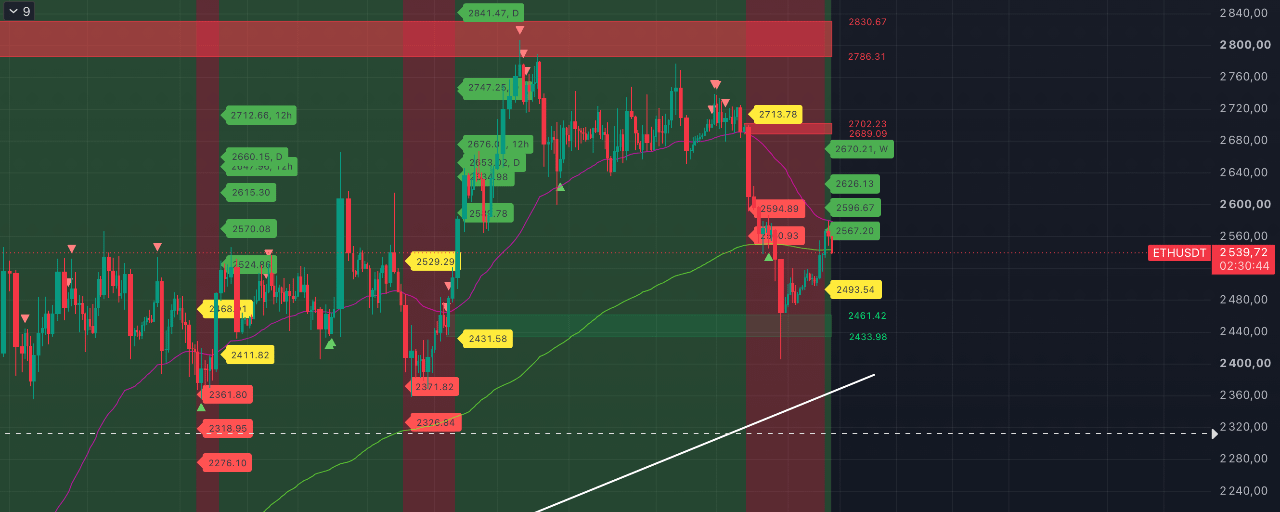


ETH analysis: Why a correction remains our priority.
We'll start with third-party analytics, then add our own.
DropsTab reports that $542 million was withdrawn from U.S. spot Ethereum ETFs over five trading sessions.

This is the worst weekly performance since January of this year, when net outflows reached $601 million. The outflow streak has now lasted nine consecutive trading days.
According to #DropsTab, most of the losses came from BlackRock’s flagship fund: $477 million, or about 88% of the total outflows. This is clearly negative for the price—the institutional demand channel is not supporting the price right now, and redemptions may involve funds selling ETH.
What’s happening on the #ETH chart? As with BTC, the price has returned to a sustained uptrend on the 3-, 4-, and 5-hour timeframes. The more distant baseline target on these timeframes is $2,626. AT THE SAME TIME, just like BTC, the asset is in sustained downtrends on the 12- and 18-hour timeframes. And unlike BTC, it’s also in a downtrend on the daily timeframe. The baseline targets here are as low as $2,306.
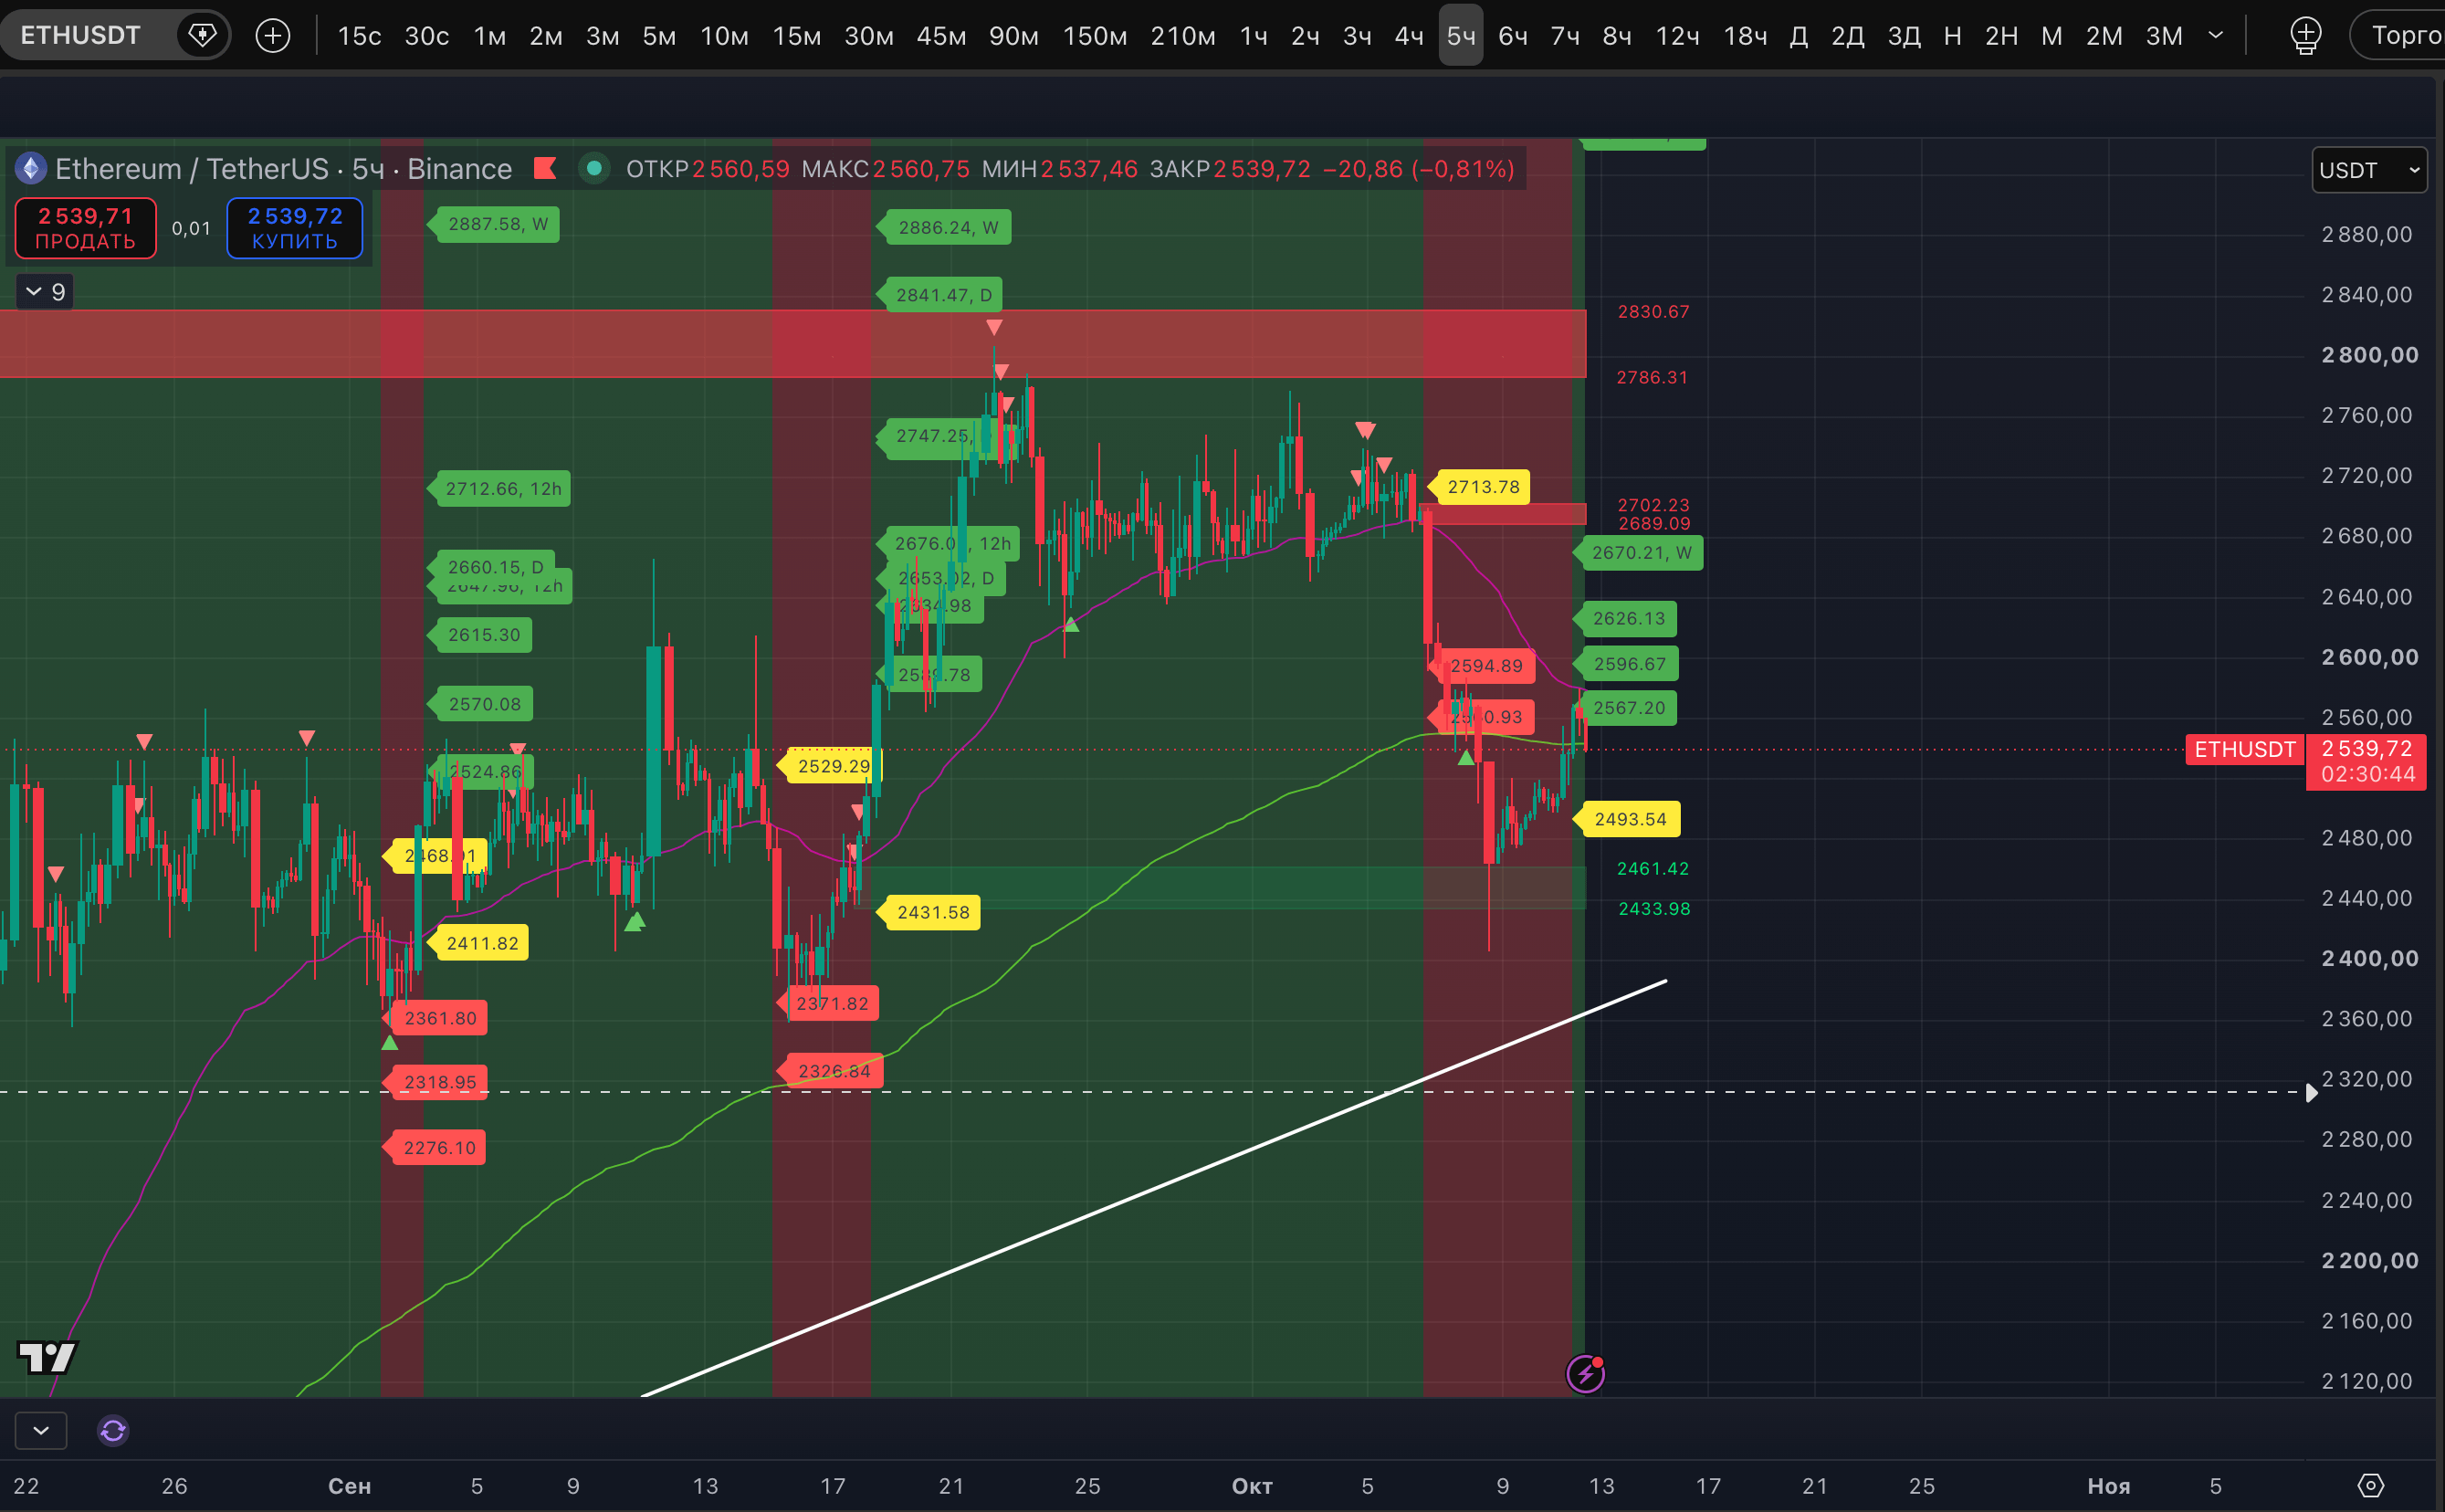
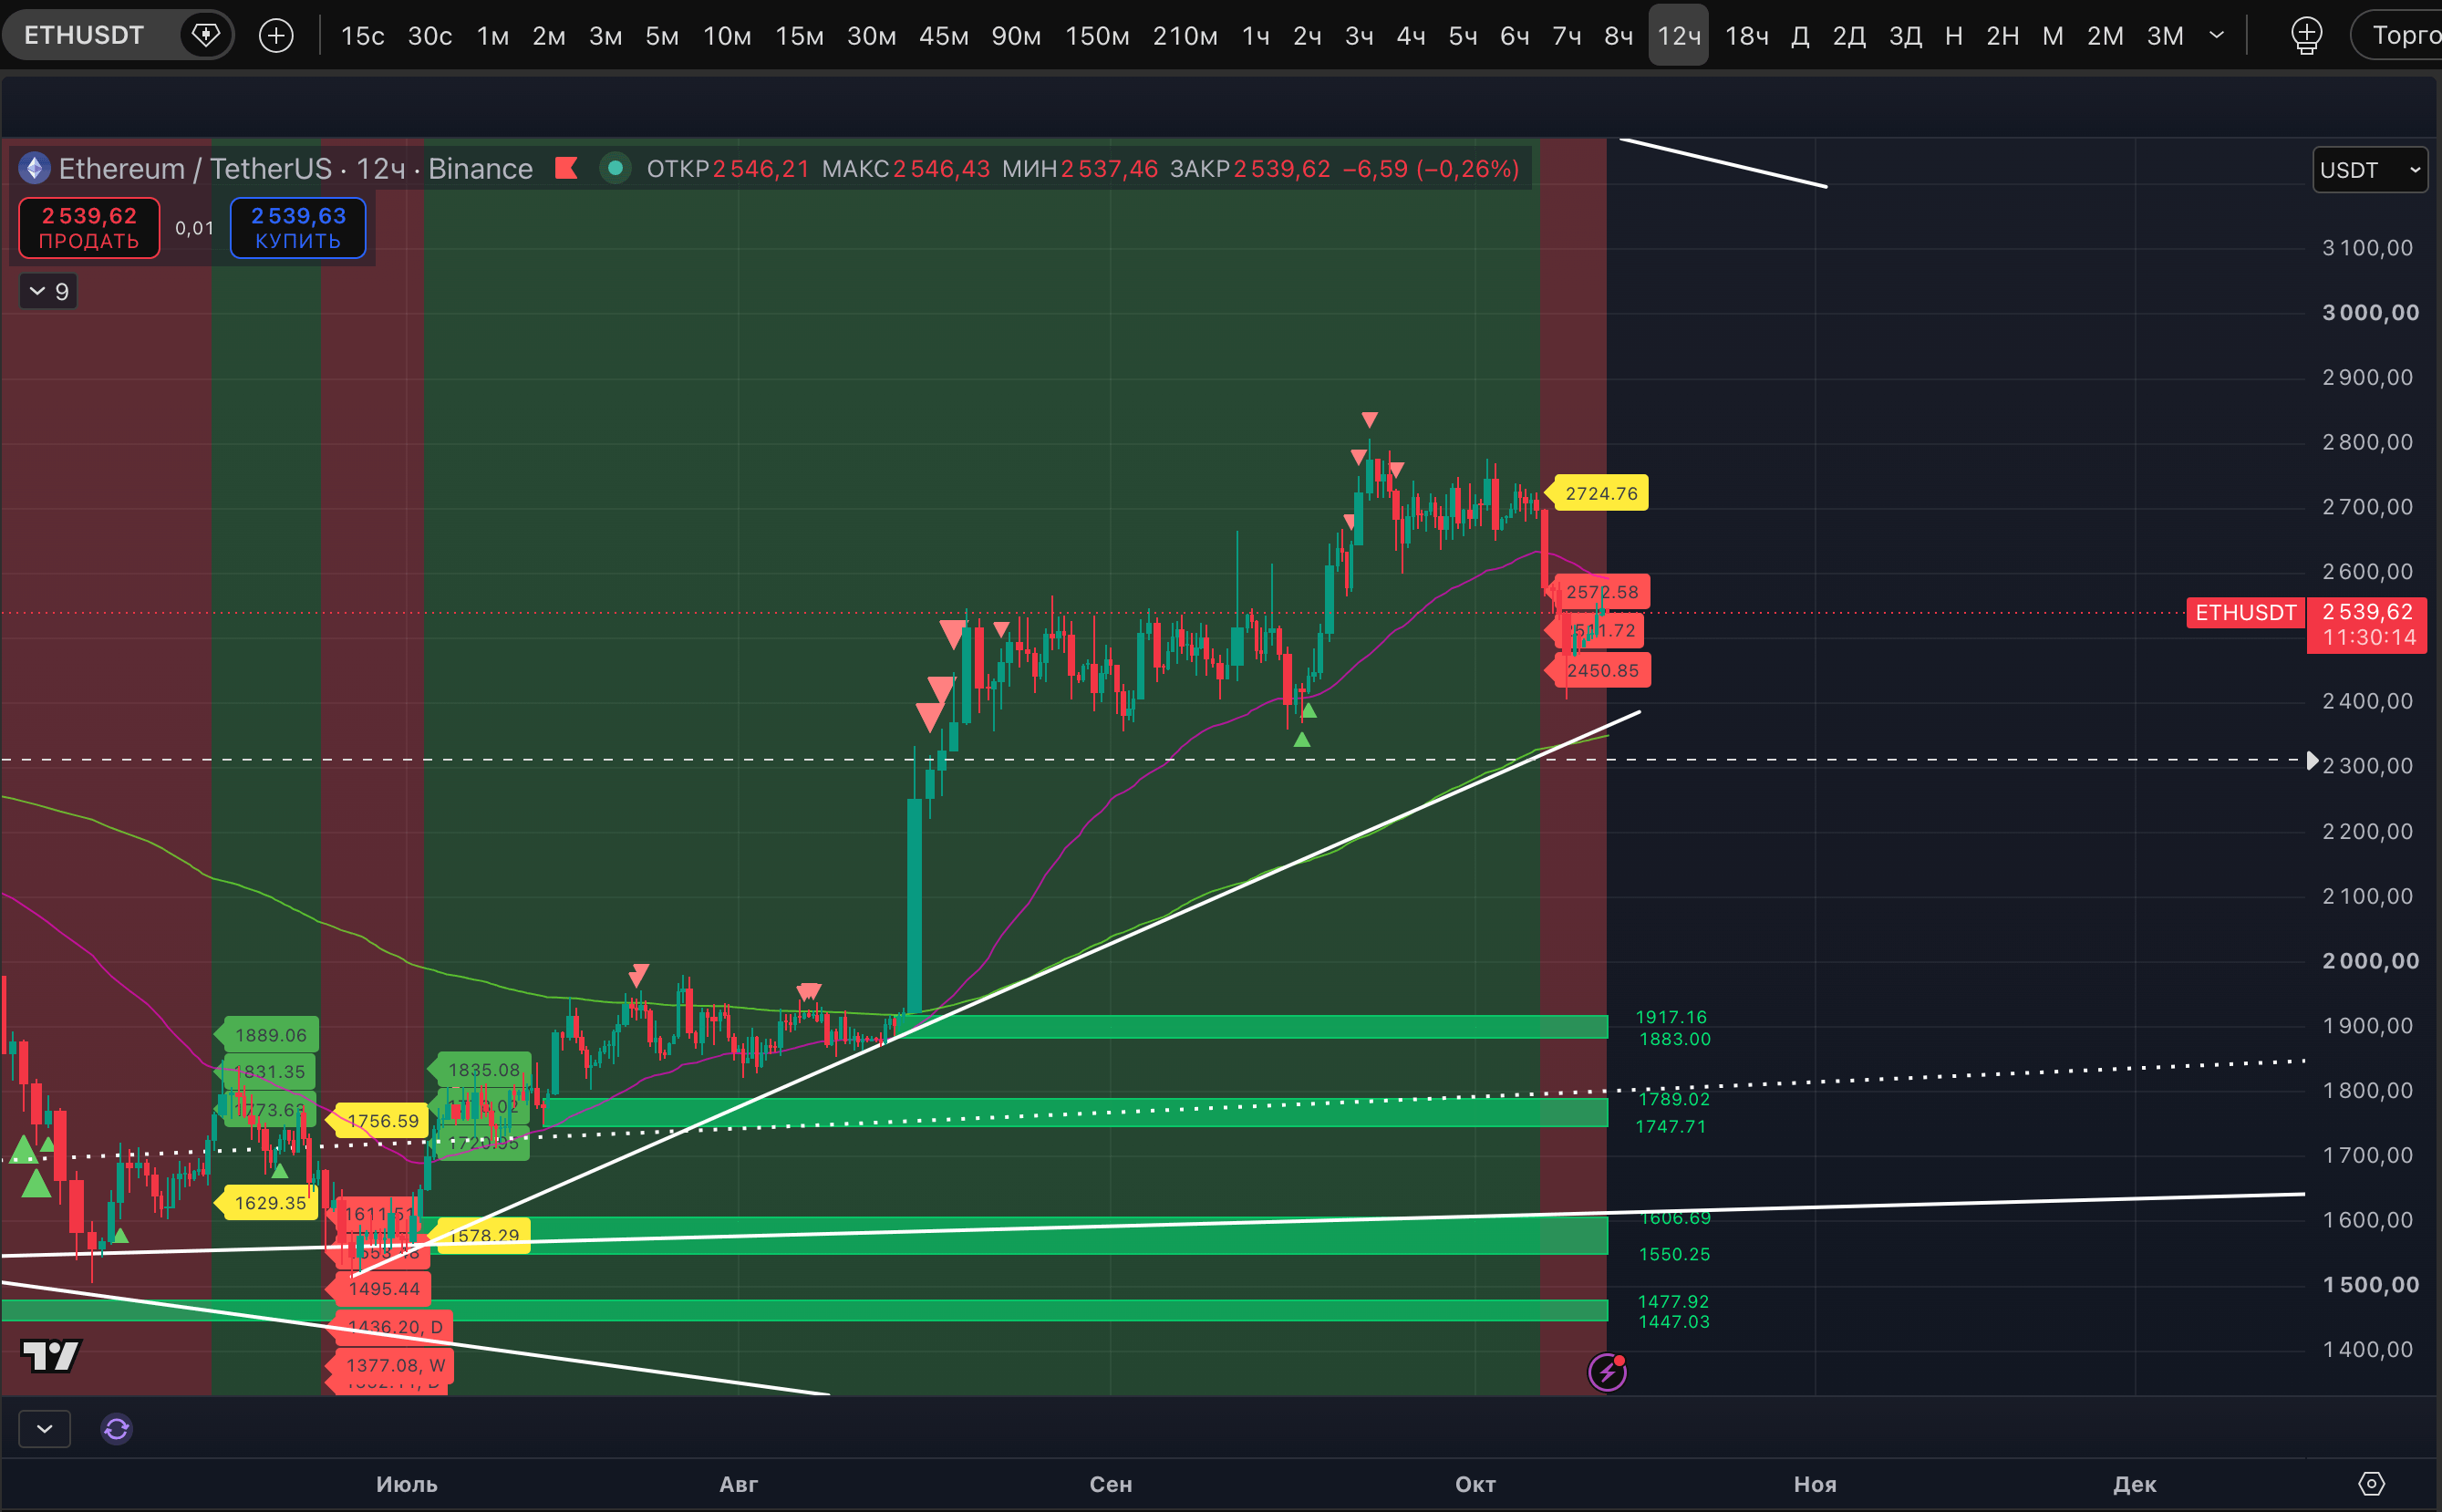
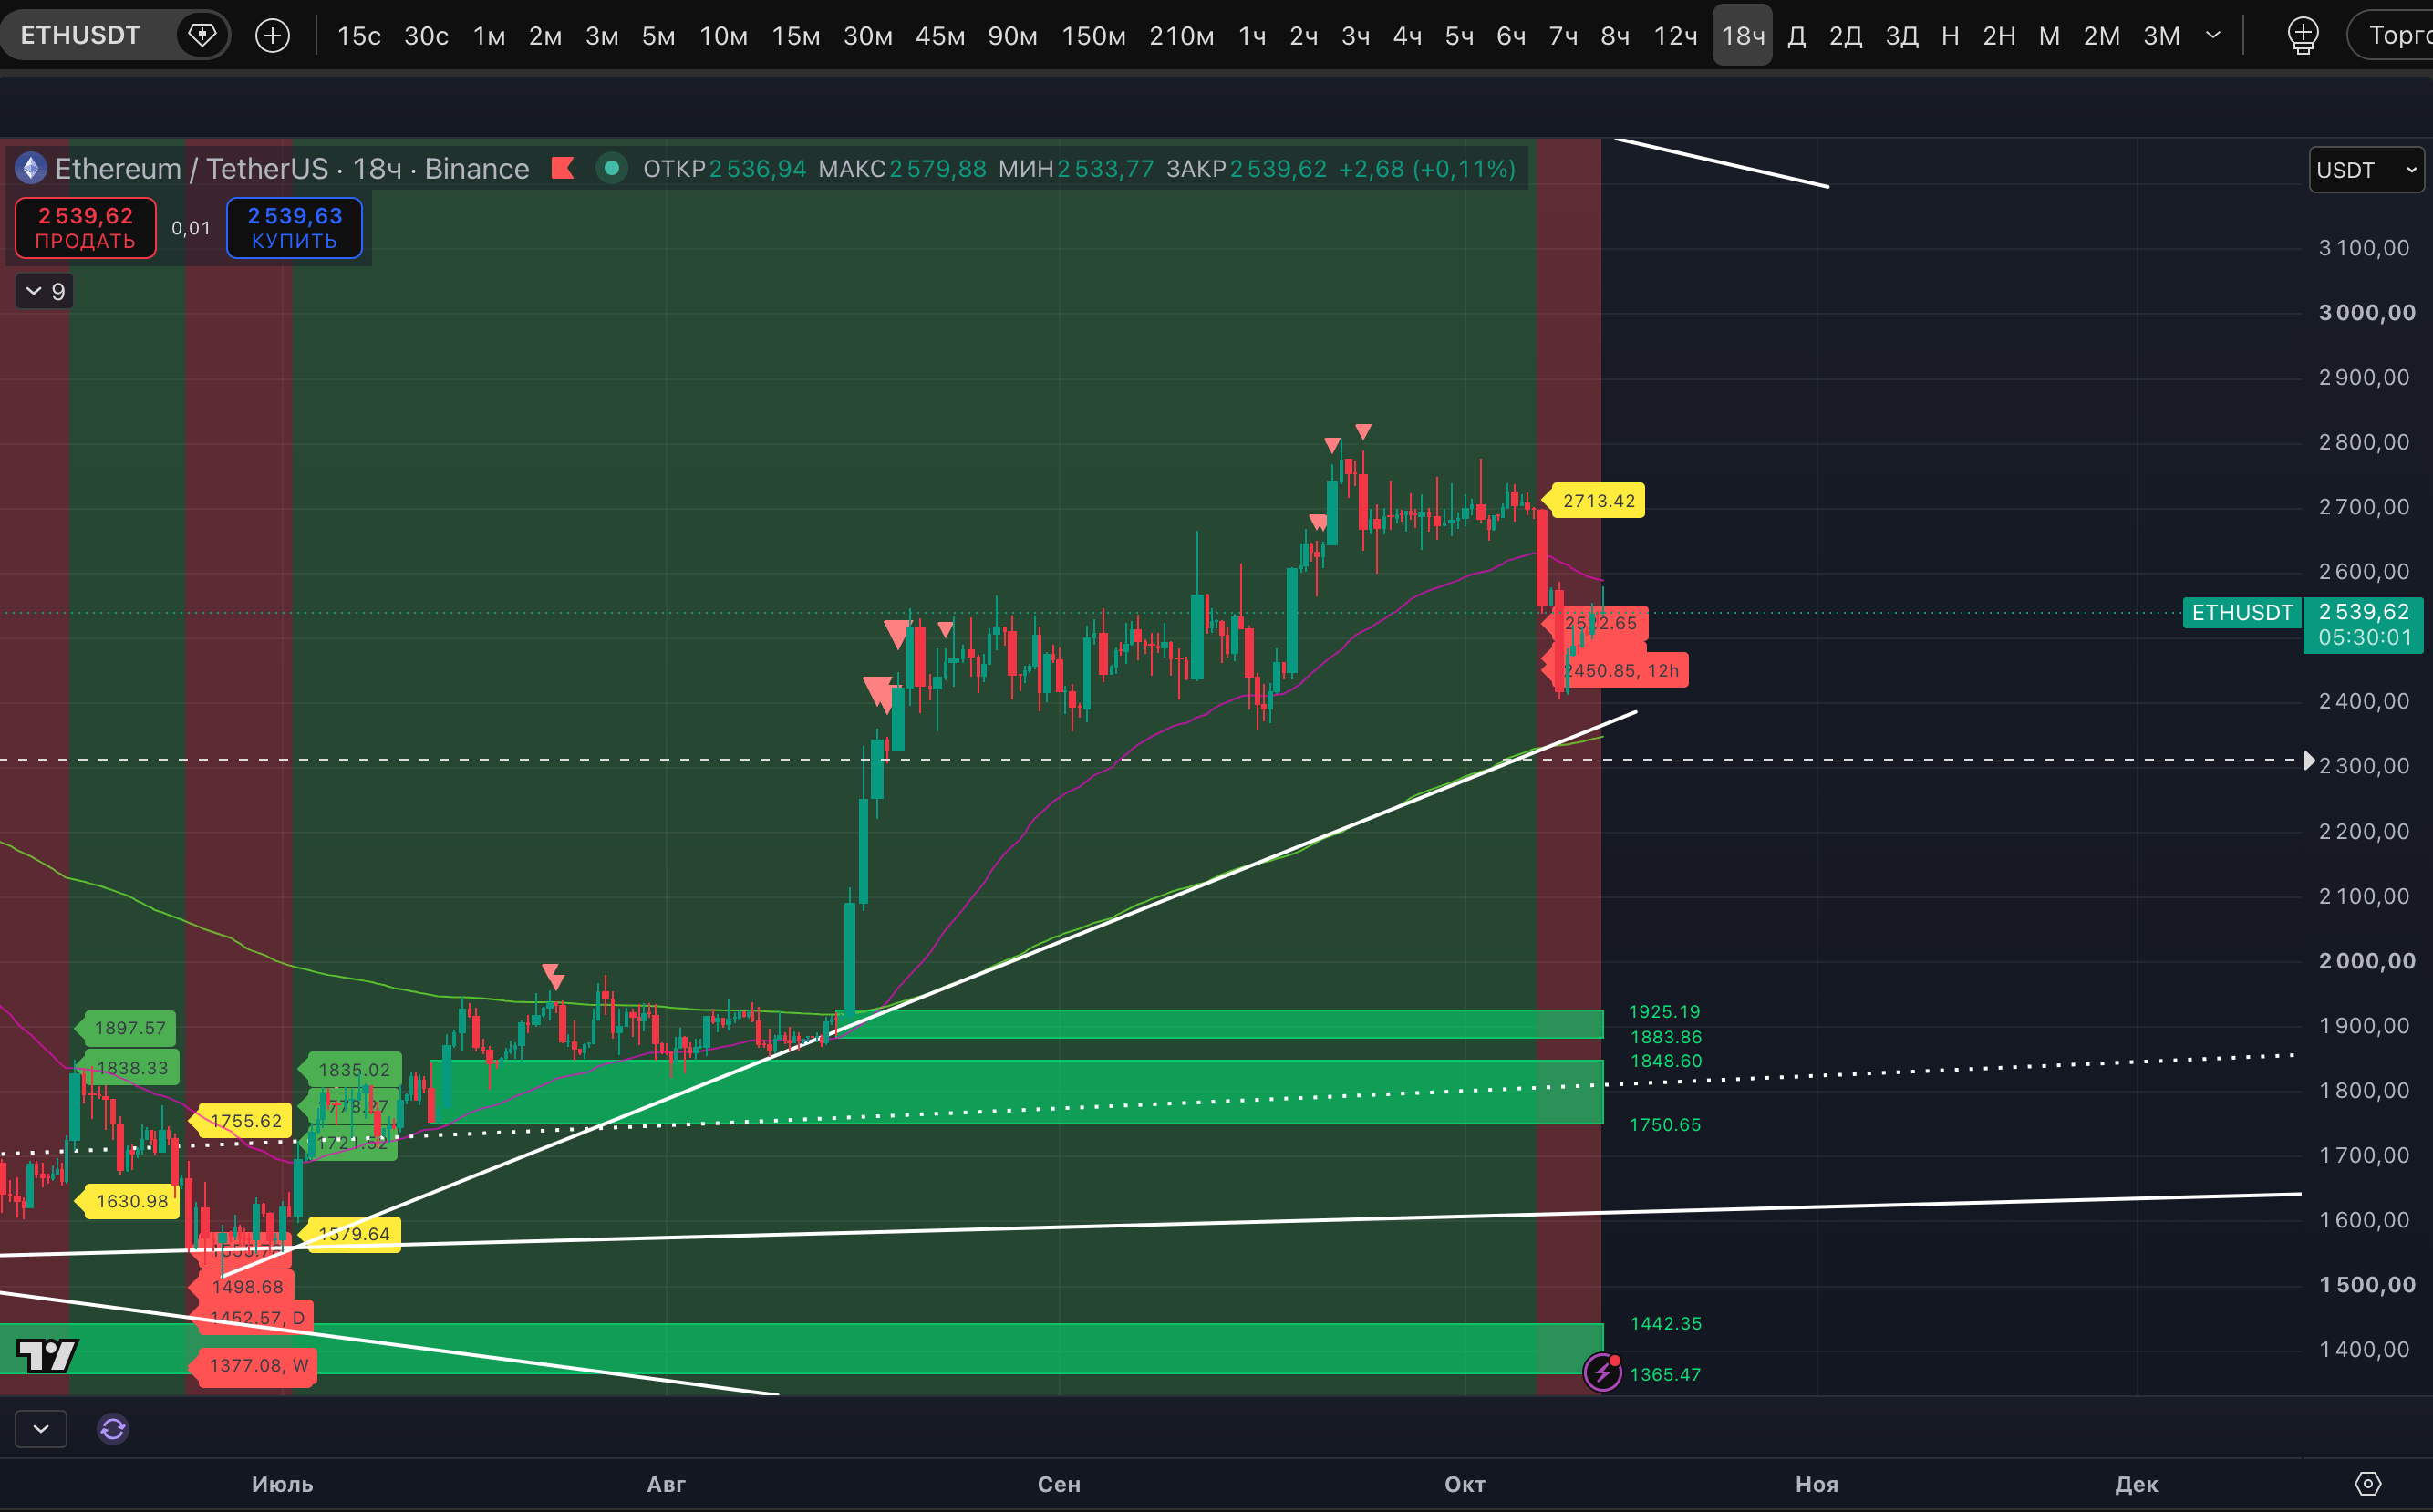
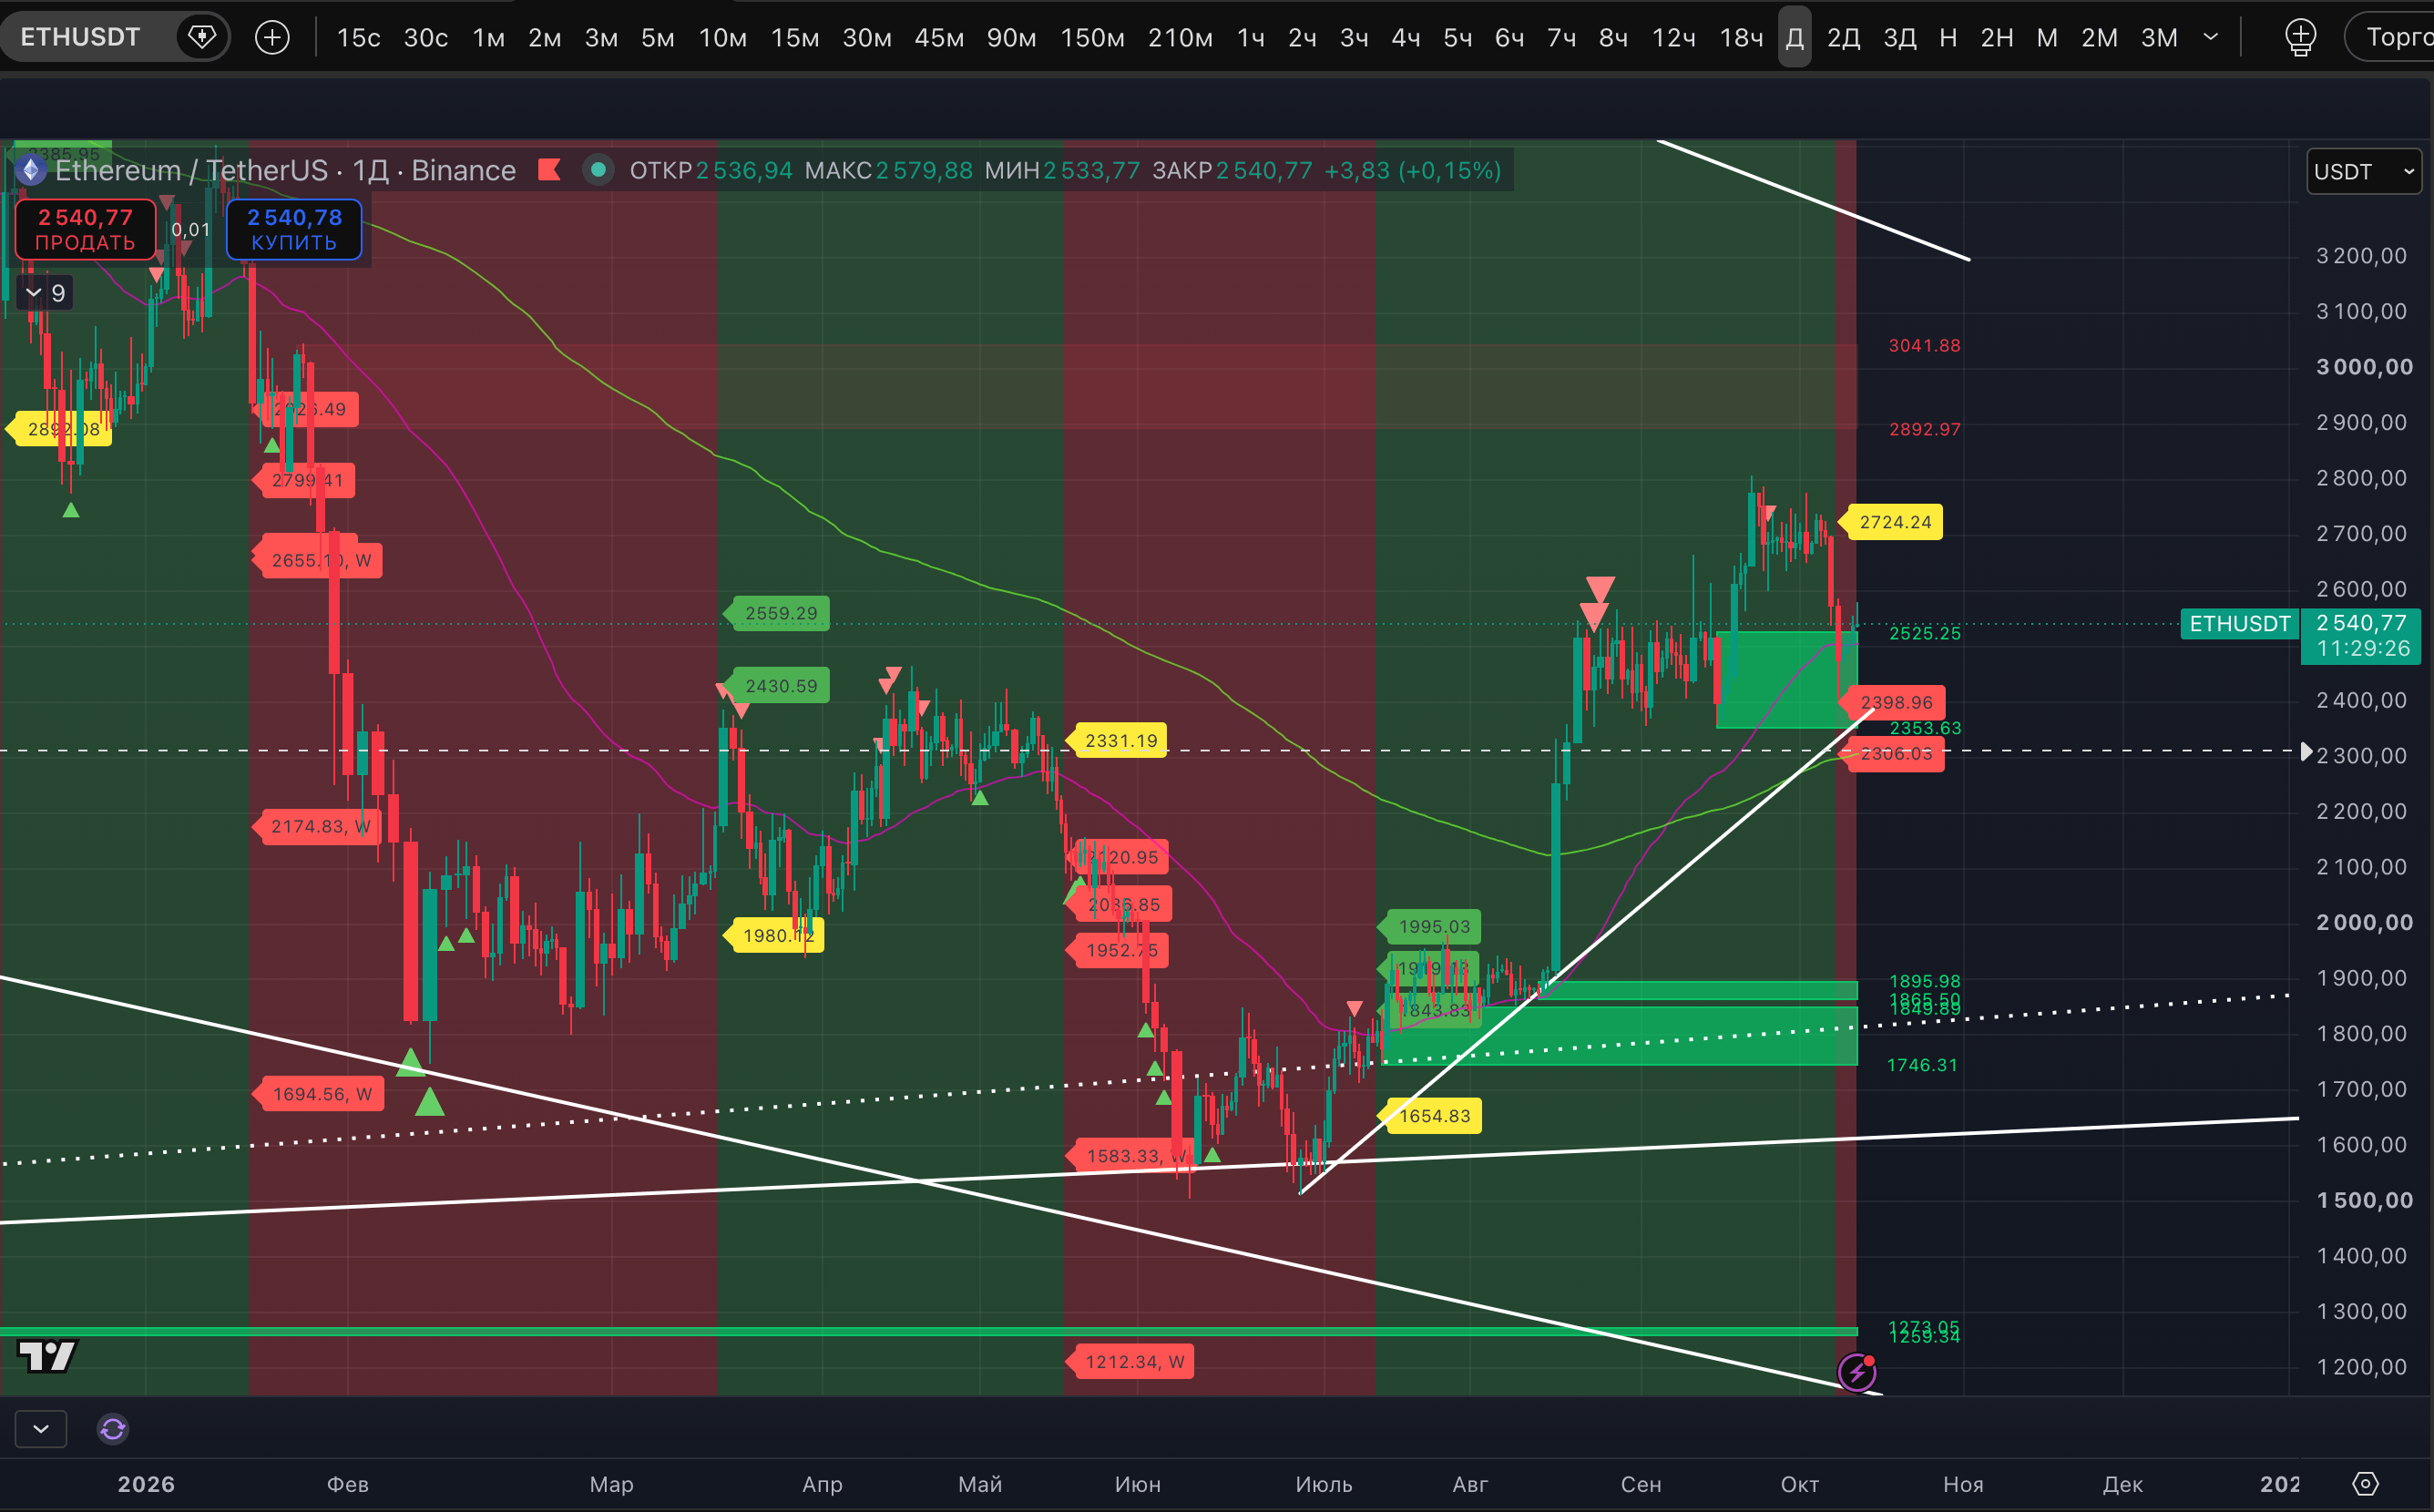
Our outlook for the asset is the same as for BTC. As long as the highest timeframe with a sustained downtrend (the daily timeframe in this case) remains in force, we expect a correction of the August–October rally. In the initial impulse of this correction, the price has already fallen from a high of $2,807 on September 21 to a low of $2,406 on October 8. That sounds pretty good—about 14% of net movement. BUT on the weekly timeframe, this looks very insignificant: the price has only just reached August levels, where the potential-high markers appeared on the weekly chart. And, by the way, a fourth additional potential-high marker has appeared on the weekly chart.
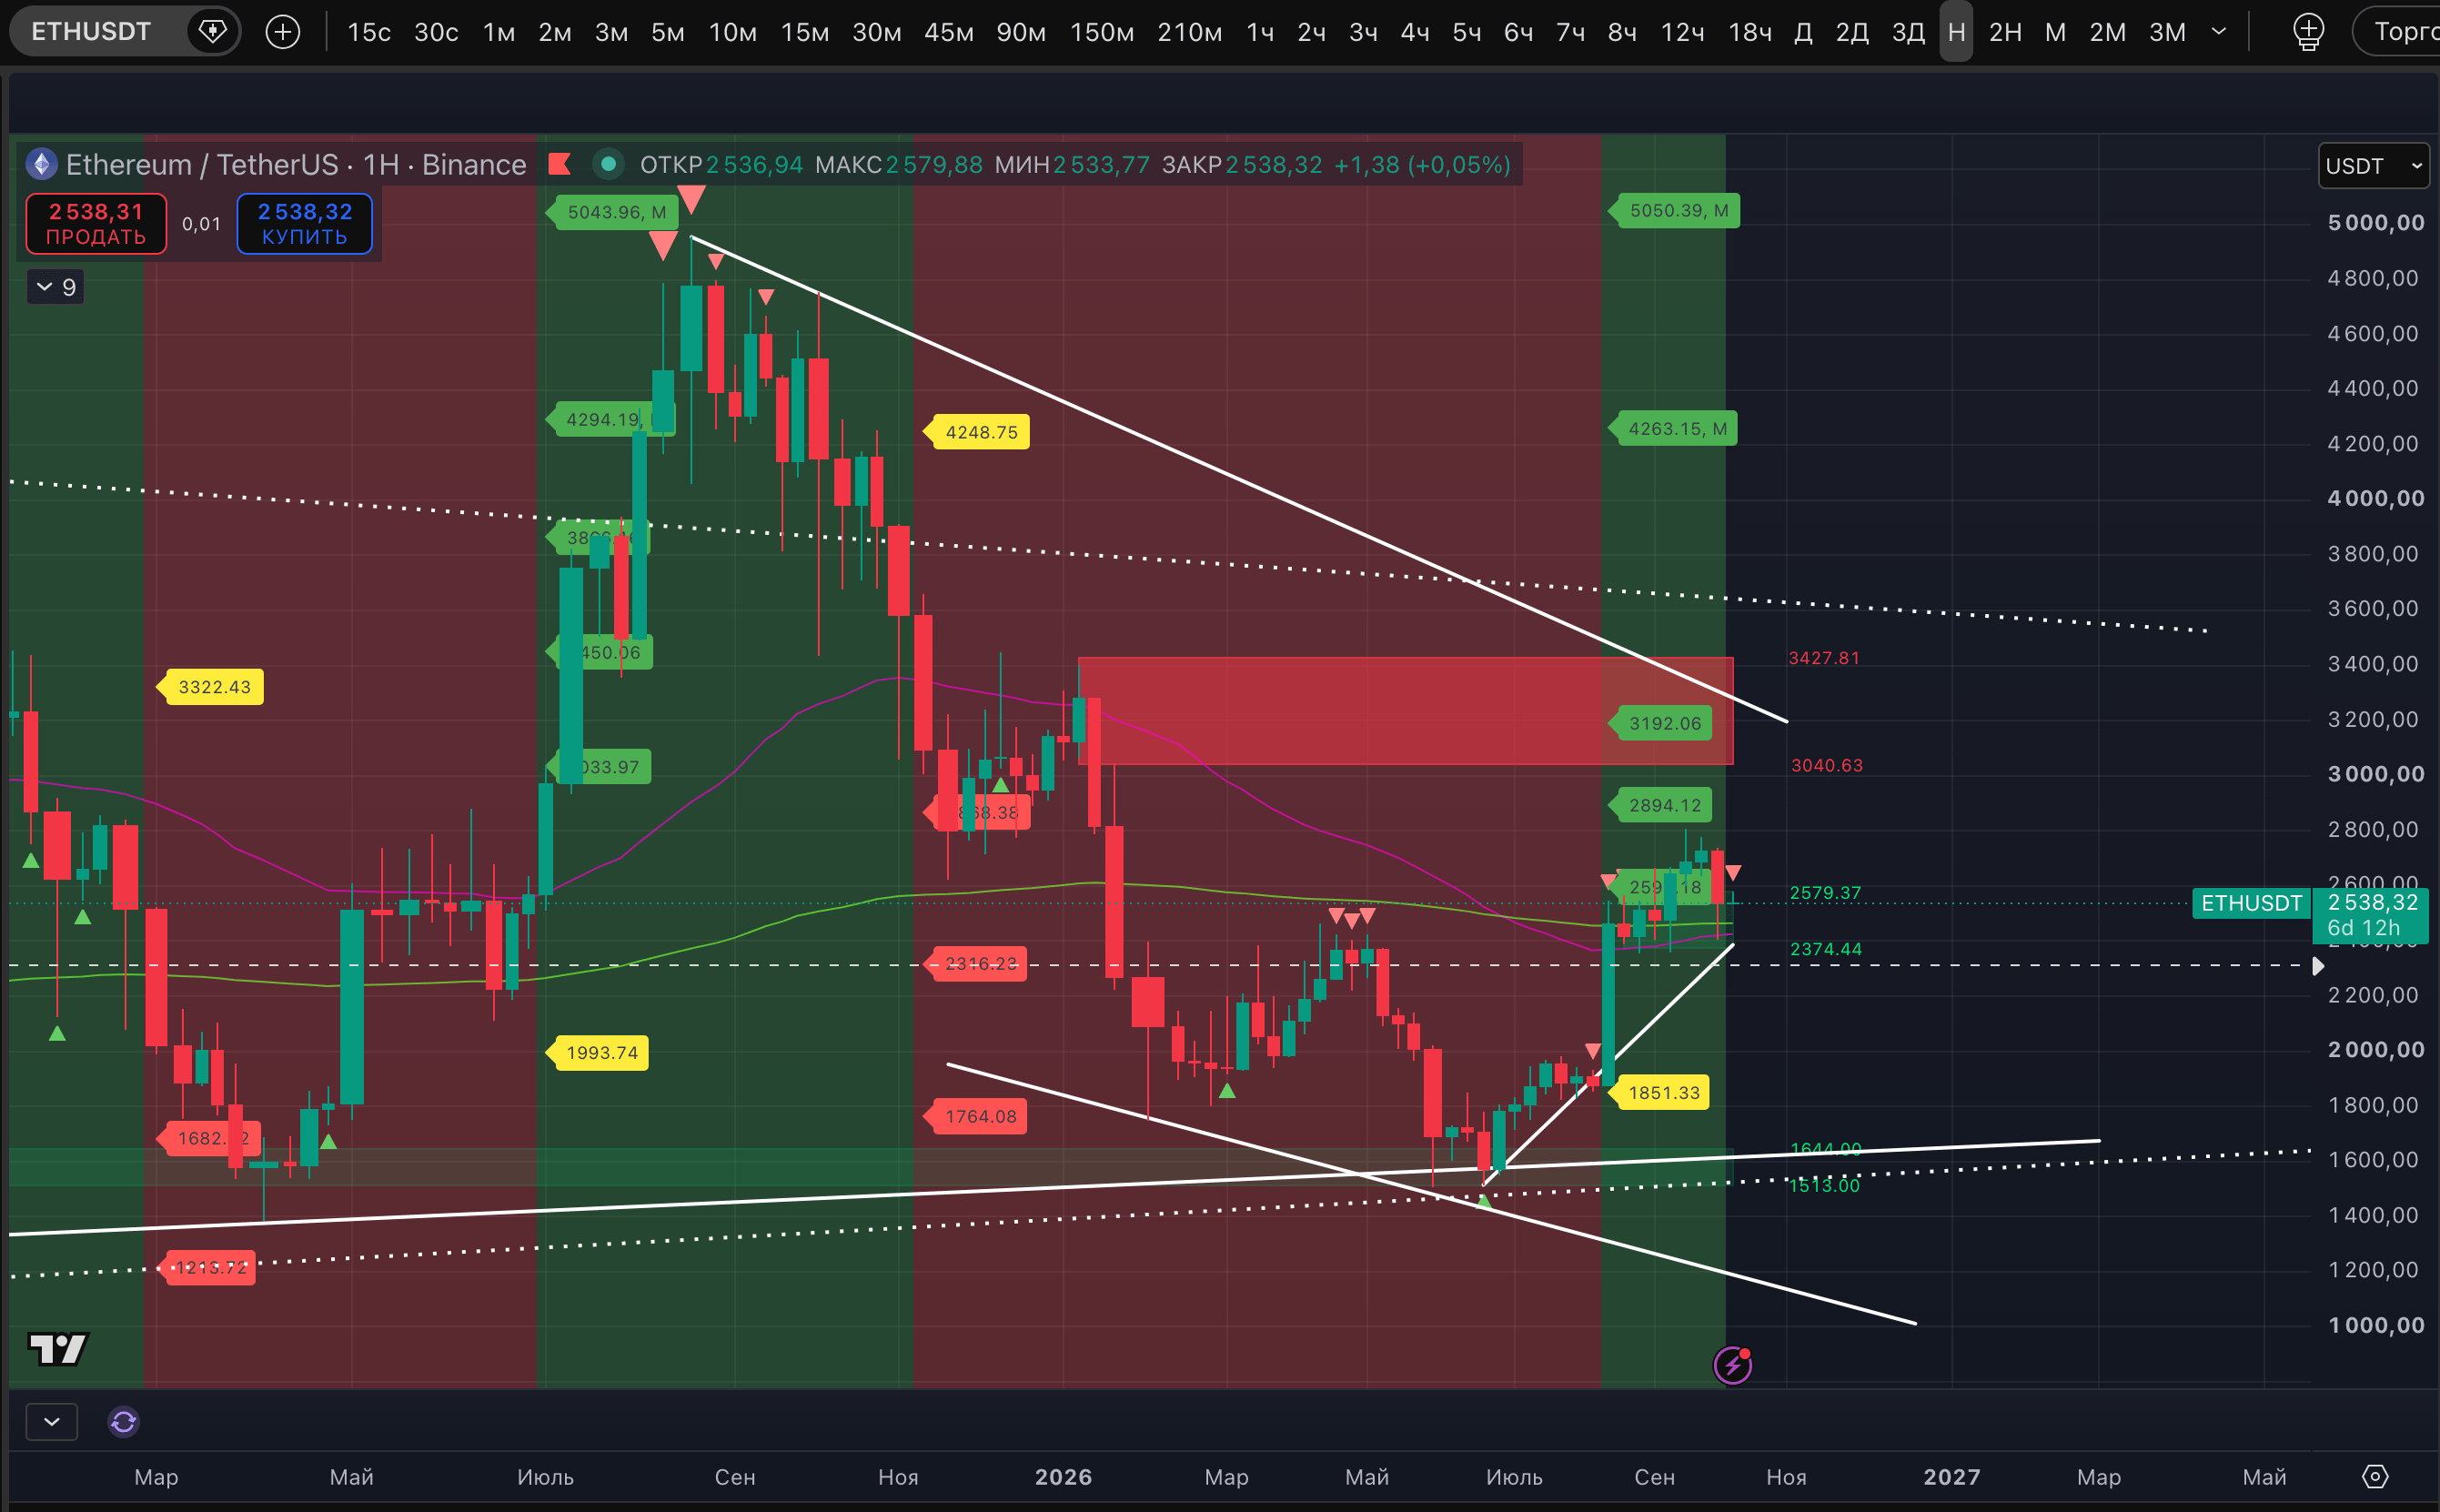
Of course, it still needs to be confirmed when the candle closes. BUT overall, this is an early signal of a new attempt at a correction following September’s higher high.
If we factor in these weekly timeframe markers in the expected correction (during which, as a reminder, we plan to buy ETH for the conservative spot copy portfolio), the decline should continue.
The structure of the previous weekly candle also supports this scenario, by the way. It has a sizable wick down from the current levels to $2,406. It’s entirely possible that the market will start trading through that range soon. Many assets also had wicks like this at the end of last week, which only adds to the case for a market correction. We expect trading through the wicks of these candles to be just the beginning of a correction that will stretch through the rest of October and probably at least part of November. We plan to buy spot at the possible end of this correction.
The movements in spot Ethereum ETFs, which we started this post with, fit well with the possibility of a new correction getting underway.