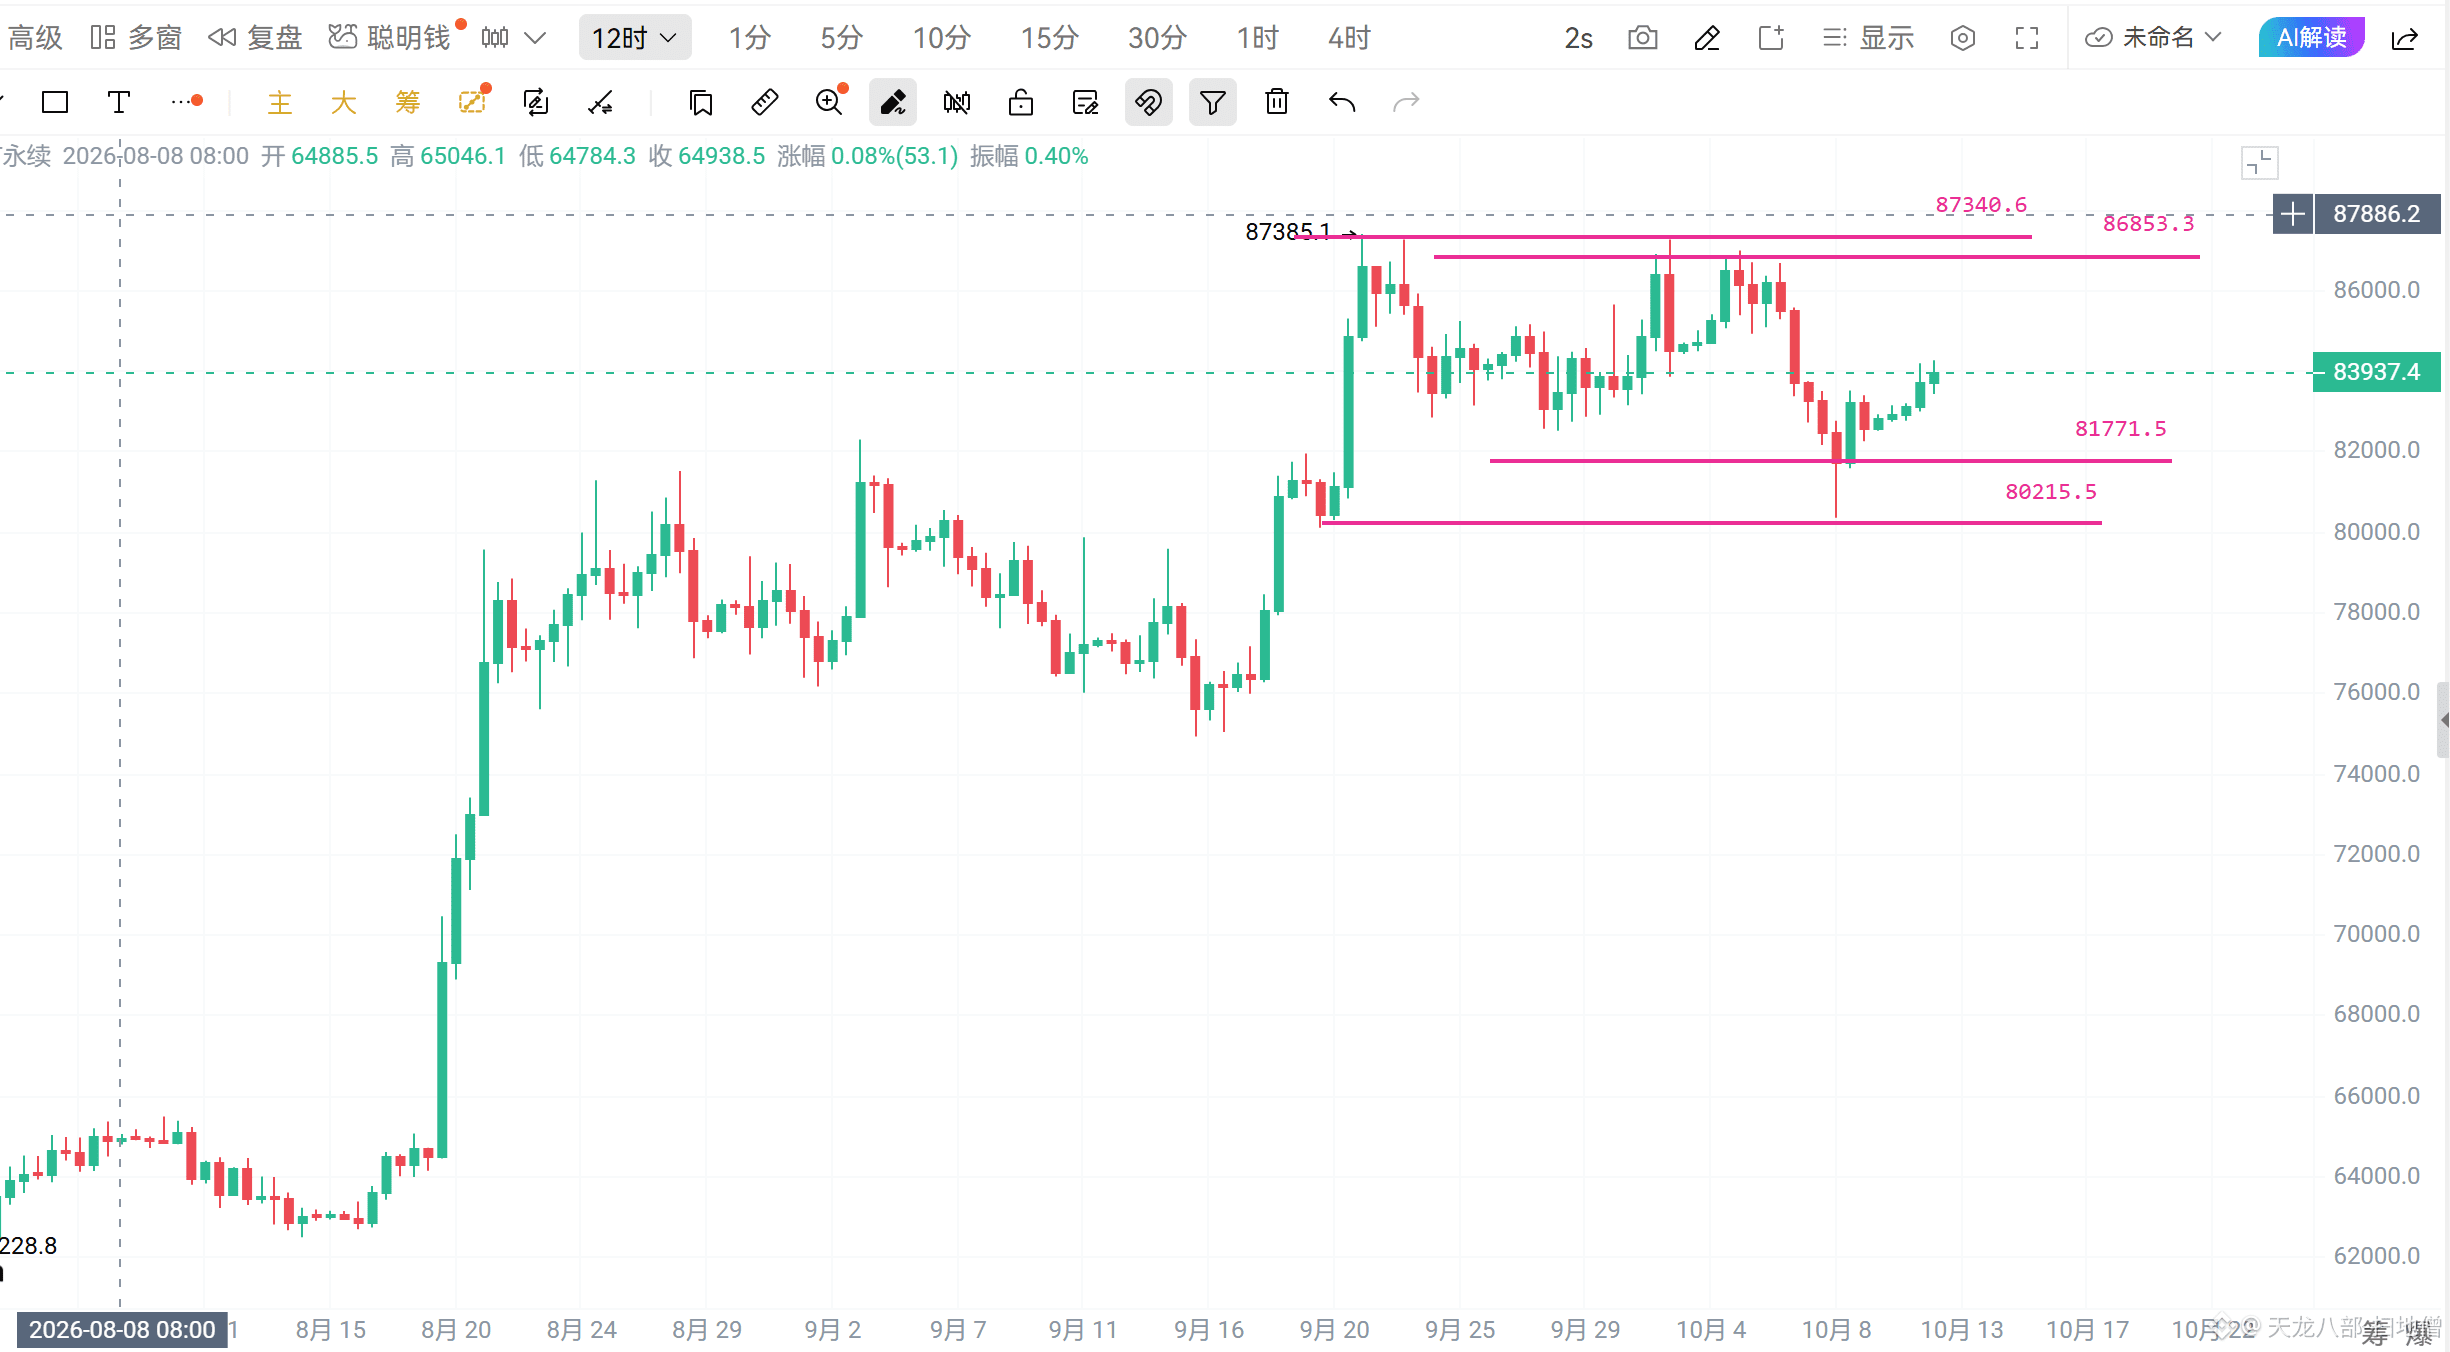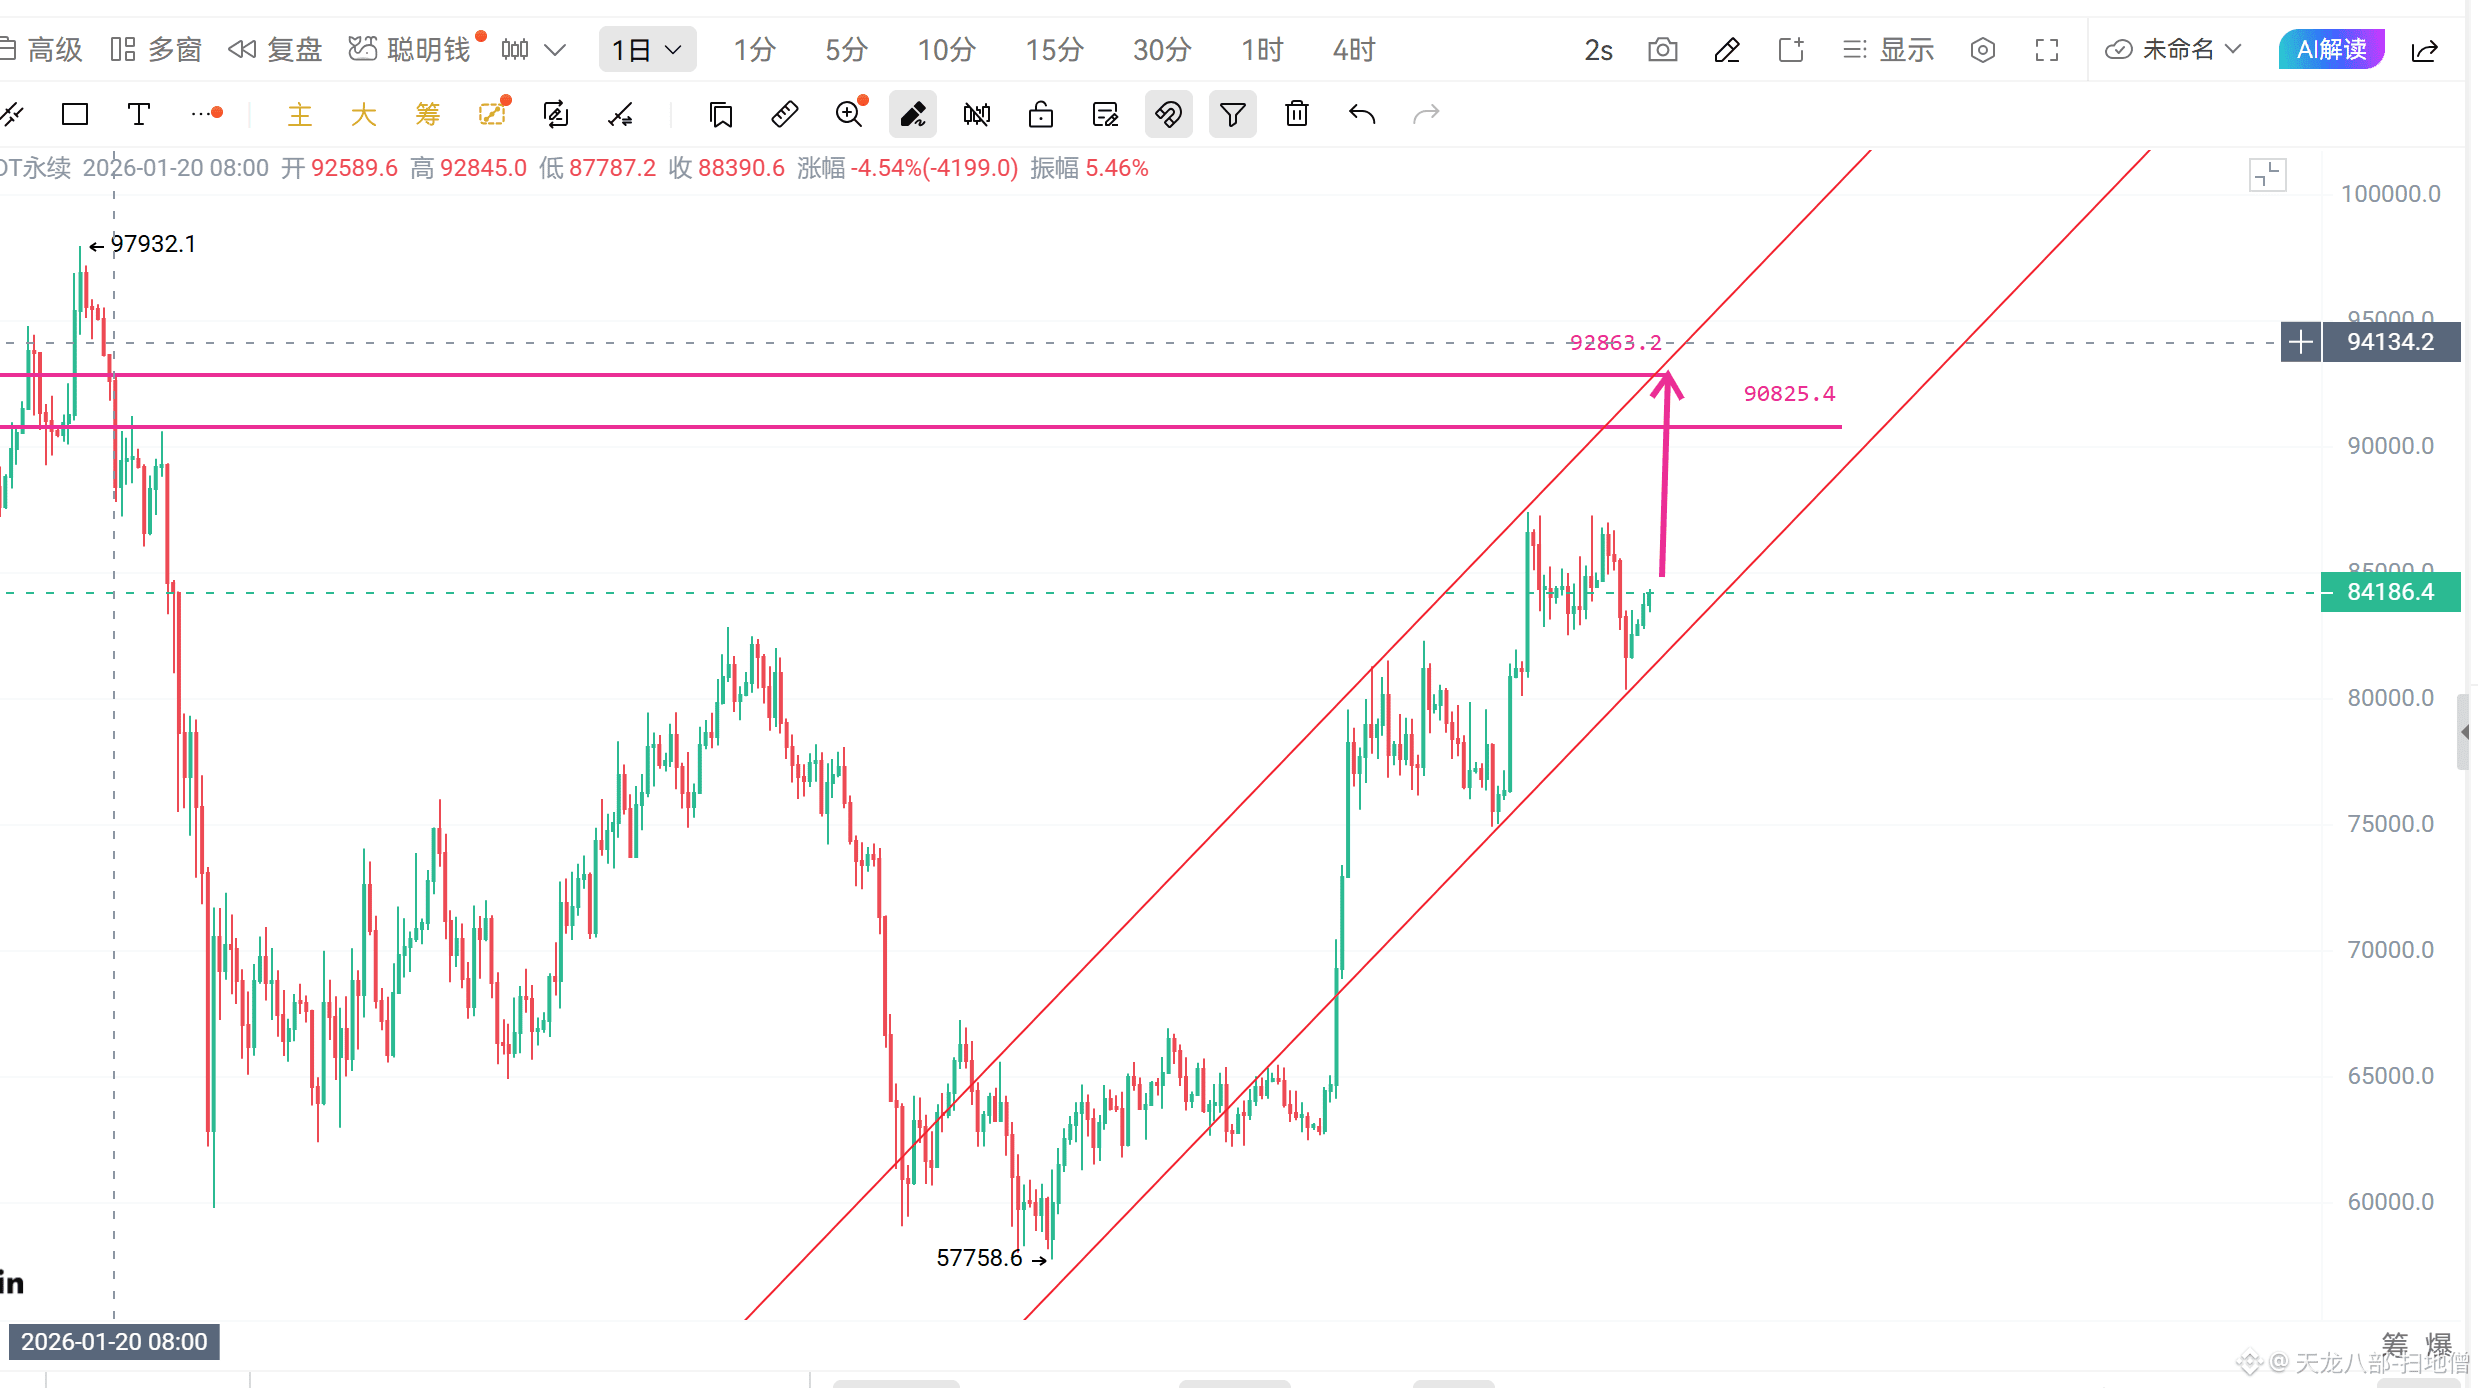
$BTC This week’s market analysis is actually consistent with the analysis from the week before last and last week: the daily Bollinger Bands are moving sideways within a range. Since the daily Bollinger Bands are currently narrowing, the resistance above was at 867, but has now moved down to 862. The bottom at 816 remains unchanged.
Last week, the extreme support at 816 was breached, causing an overshoot. I mentioned this in my previous post too: this is the final phase of this market move. Don’t chase shorts in the small overshoot zone; the market can quickly rebound at any time. Buying dips or building long positions in stages near the bottom is the best approach.
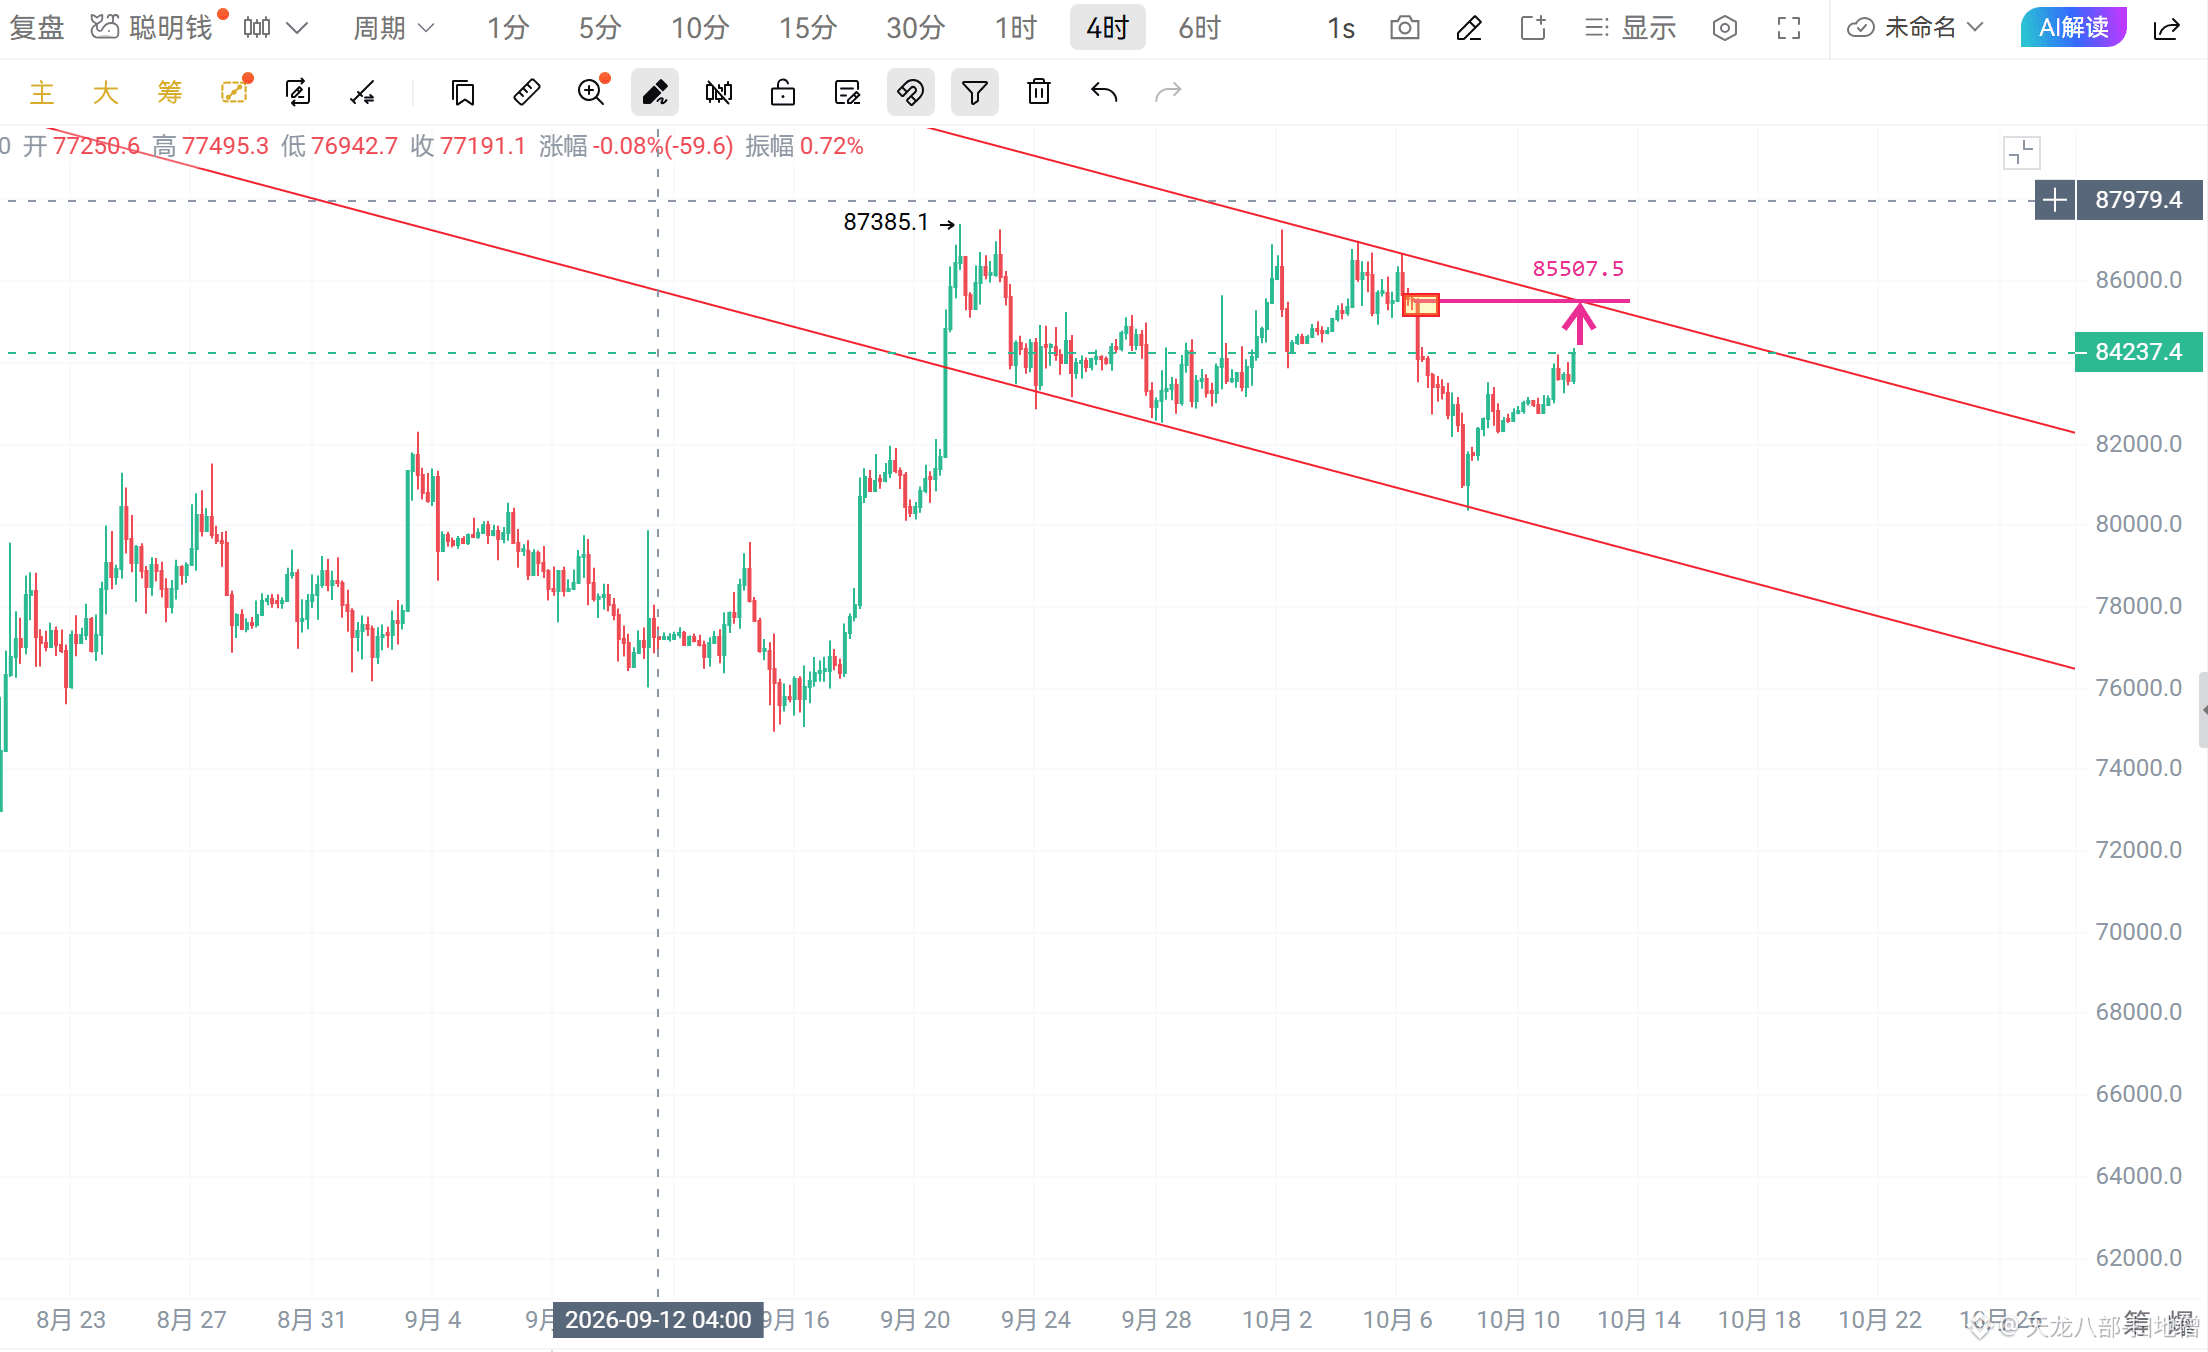
Right now, resistance above has moved down to 862, while support at the bottom remains 816. The drop to 804 was an overshoot—a final move in this market cycle. Current resistance levels are 843, 855, and 862. 843 is the daily Bollinger Band middle line. As I said last week, when the Bollinger Bands narrow and the market reaches support at the lower band, the first level it is likely to rebound to is 843.
843 is also the daily Bollinger Band middle line and was a resistance level on the previous candlestick. The second level is 855. The market makers will probably use these two levels to create some chop and short-term fluctuations. Also, many retail traders holding long positions will take profits as soon as the price reaches 843, which could intensify the swings around that level. As for 862, if the market successfully breaks through 855, the pattern of choppy decline will be invalidated, and 862 will be unlikely to hold it back. The market will most likely go on to break a new high, targeting 895, 905, and the extreme level of 928, in a choppy upward trend.
Overall, the market is leaning bullish. It’s normal to see some choppy trading around 843 and 855 for now, but ultimately the market should still push higher.
Last week, the extreme support at 816 was breached, causing an overshoot. I mentioned this in my previous post too: this is the final phase of this market move. Don’t chase shorts in the small overshoot zone; the market can quickly rebound at any time. Buying dips or building long positions in stages near the bottom is the best approach.
Right now, resistance above has moved down to 862, while support at the bottom remains 816. The drop to 804 was an overshoot—a final move in this market cycle. Current resistance levels are 843, 855, and 862. 843 is the daily Bollinger Band middle line. As I said last week, when the Bollinger Bands narrow and the market reaches support at the lower band, the first level it is likely to rebound to is 843.
843 is also the daily Bollinger Band middle line and was a resistance level on the previous candlestick. The second level is 855. The market makers will probably use these two levels to create some chop and short-term fluctuations. Also, many retail traders holding long positions will take profits as soon as the price reaches 843, which could intensify the swings around that level. As for 862, if the market successfully breaks through 855, the pattern of choppy decline will be invalidated, and 862 will be unlikely to hold it back. The market will most likely go on to break a new high, targeting 895, 905, and the extreme level of 928, in a choppy upward trend.
Overall, the market is leaning bullish. It’s normal to see some choppy trading around 843 and 855 for now, but ultimately the market should still push higher.