


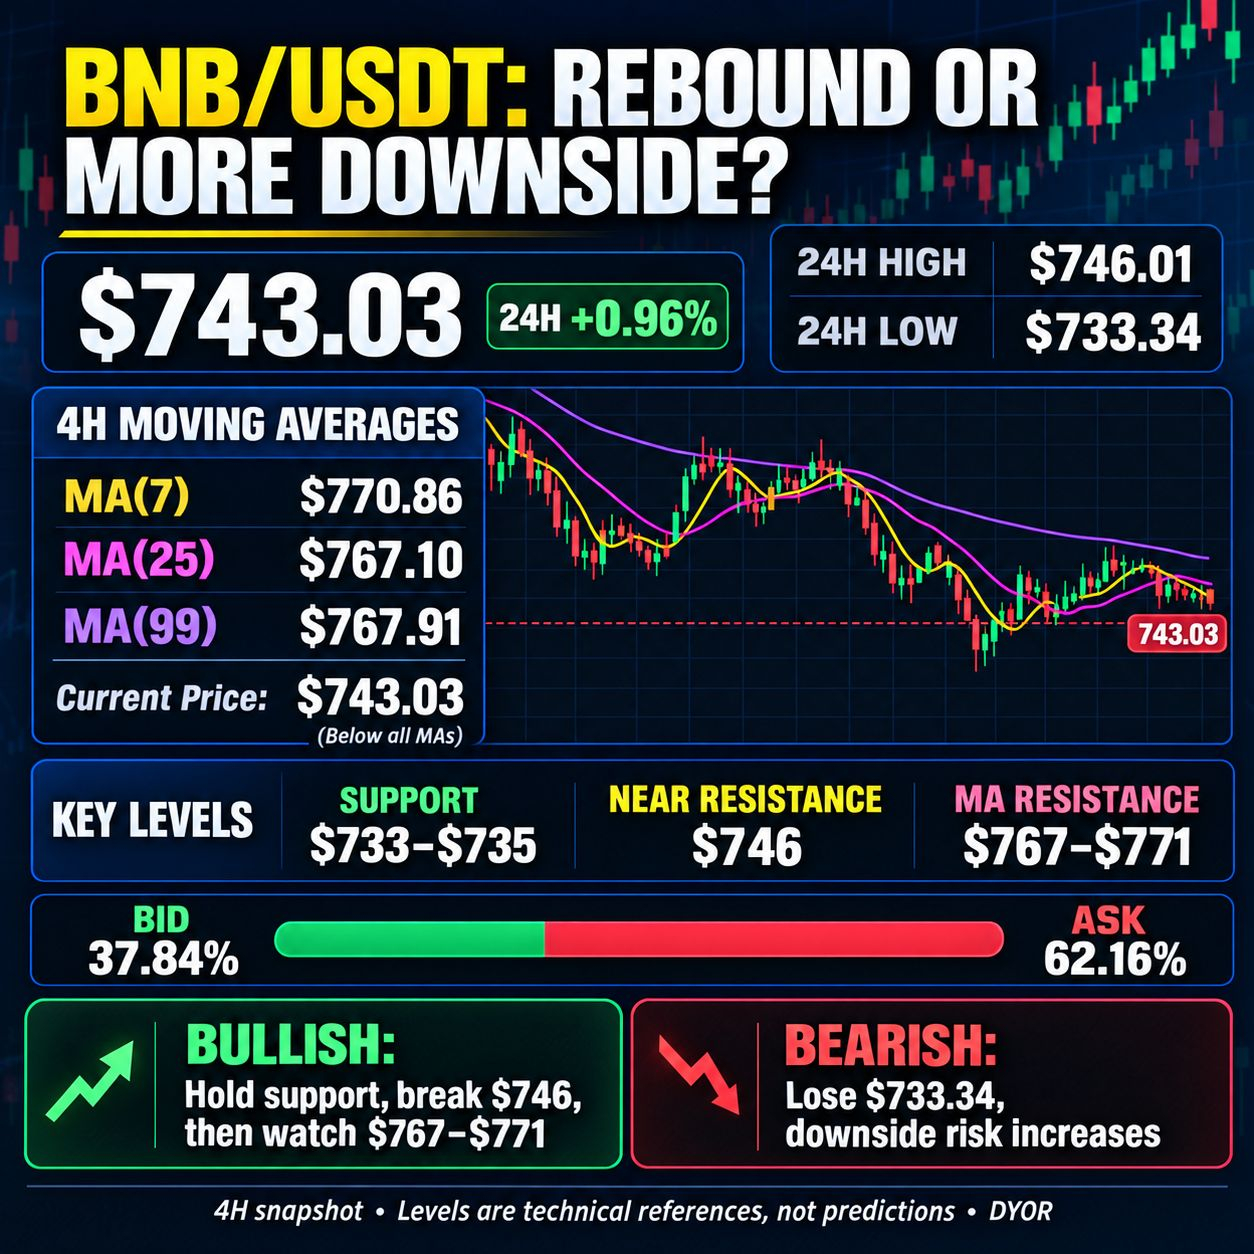
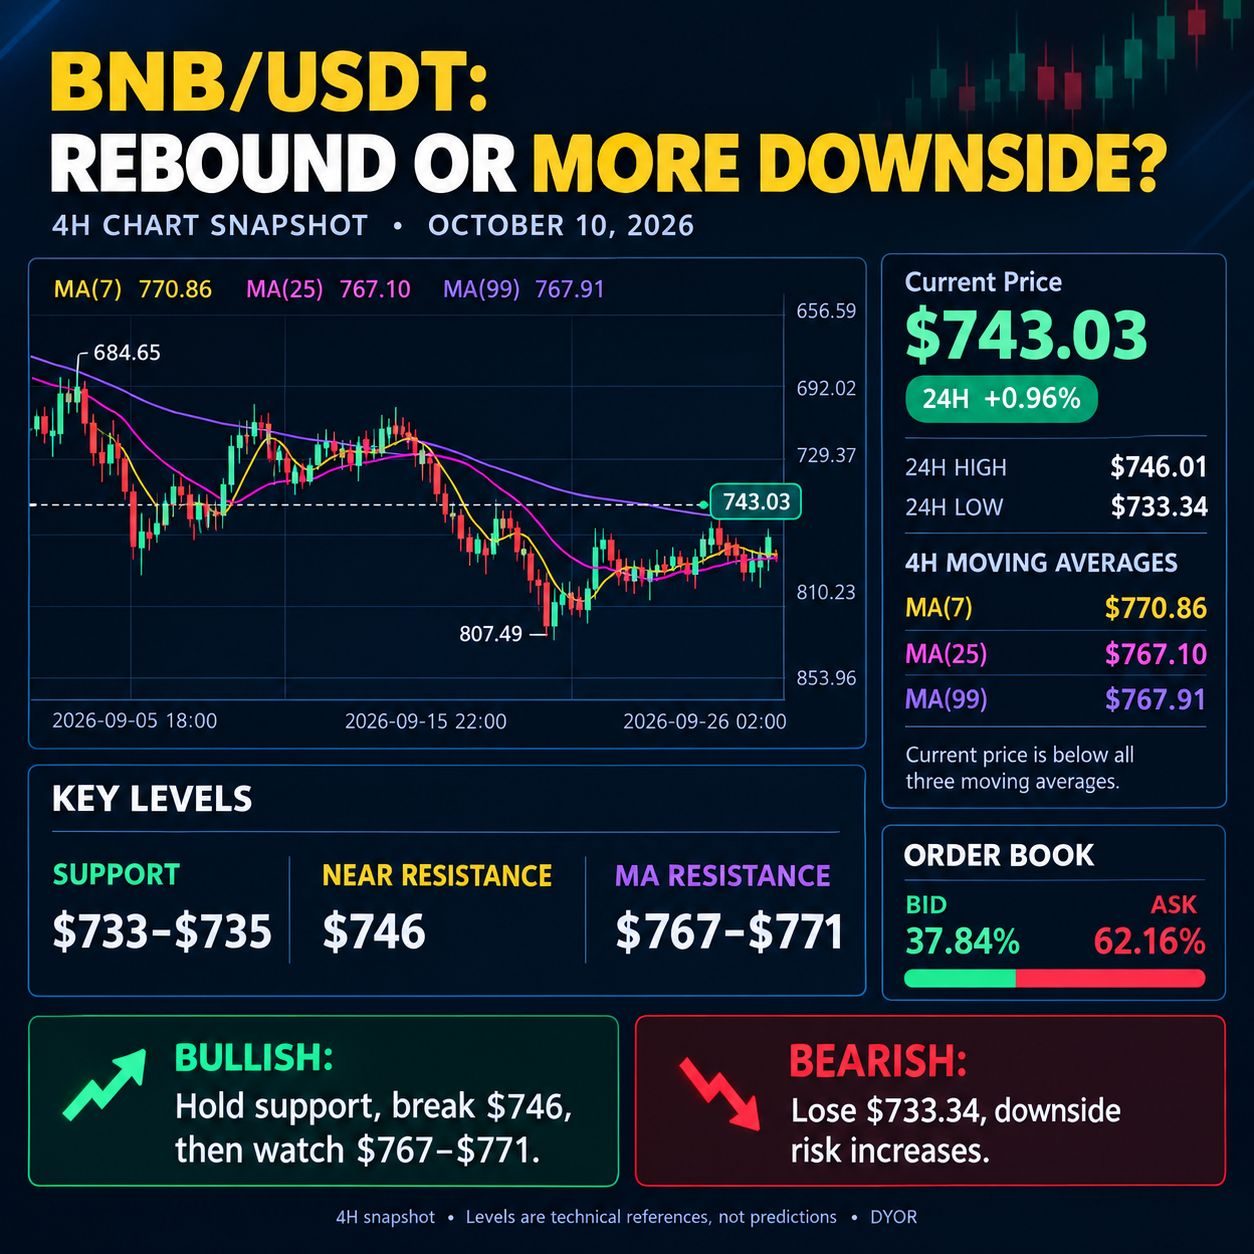
BNB is trading around $743.03, up approximately 0.96% over 24 hours, according to the chart provided. However, the 4-hour timeframe suggests that the market is still facing resistance.
1. Moving Averages Signal Caution
The current price is below all three displayed moving averages:
MA(7): $770.86
MA(25): $767.10
MA(99): $767.91
This indicates that bearish pressure remains significant on the 4-hour chart. A sustained move above the $767–$771 zone would be an important step toward a stronger recovery.
2. Key Support and Resistance
Support: $733–$735 is the immediate support zone, based on the displayed 24-hour low of $733.34. If sellers push the price below this area, further downside may follow.
Resistance: $746 is the immediate resistance area near the displayed 24-hour high of $746.01. Above that, the $767–$771 moving-average zone could act as a stronger barrier.
3. Order Book Shows Selling Pressure
The displayed order-book ratio is approximately 62.16% on the ask side versus 37.84% on the bid side. This suggests greater visible sell-side liquidity at that moment. However, order-book data can change quickly and does not guarantee that the price will fall.
4. What Could Happen Next?
Bullish scenario: BNB holds above $733–$735, breaks through $746, and builds enough momentum to test the $767–$771 resistance zone.
Bearish scenario: BNB fails to reclaim $746 and breaks below $733.34, increasing the risk of another downward move.
Final Verdict
BNB currently shows a cautious-to-bearish short-term structure on the 4-hour chart. A bullish reversal would need confirmation through stronger buying volume and a sustained move above nearby resistance.
Avoid entering a trade based on a single indicator. Wait for confirmation, manage risk carefully, and remember that these levels are technical reference points—not guaranteed price targets.
What do you think? Will BNB break above $746, or will sellers push it below $733?
#BNB #BNBUSDT #CryptoAnalysis #BinanceSquareFamily #TechnicalAnalysis