


Looking at candlestick charts alone is not enough to understand Bitcoin’s price direction. The movements of miner whales and the Bull Bear Indicator offer important clues about what is happening beneath the surface of the market.
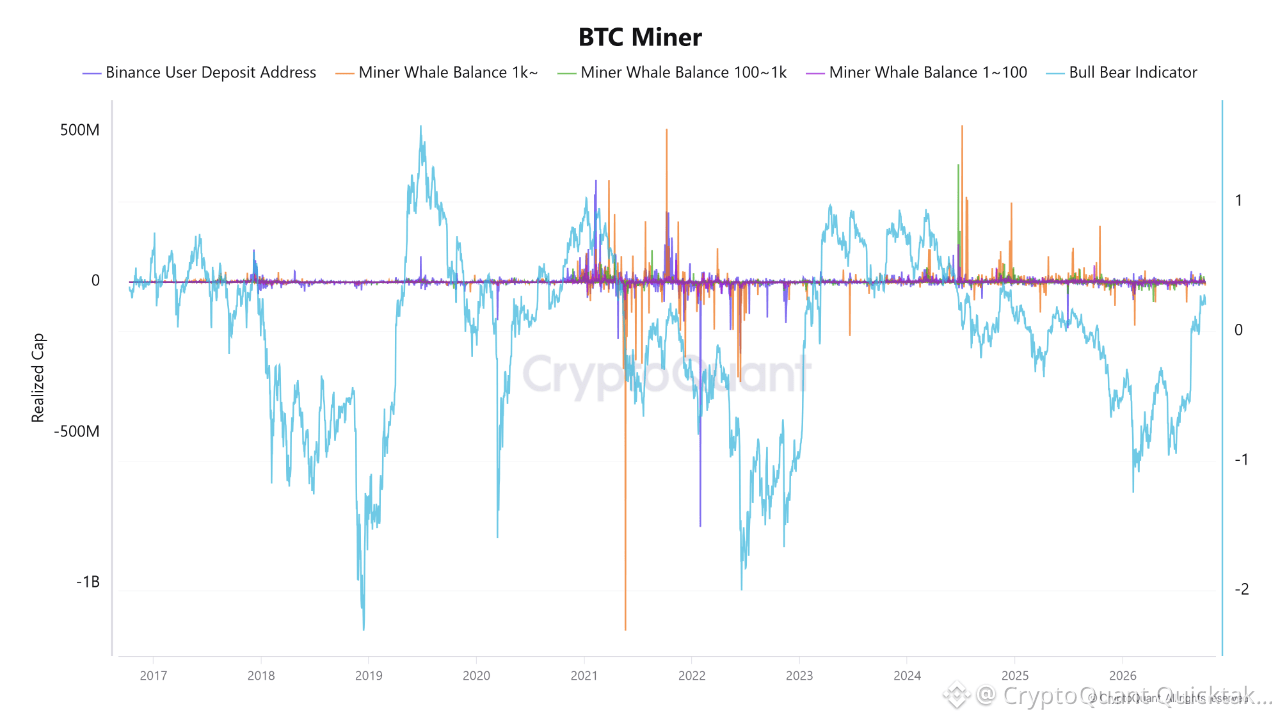
The activity of miner groups holding 1,000+ BTC, 100-1,000 BTC, and 1-100 BTC shows sharp spikes from time to time. Looking specifically at the 2024–2026 period, we can see that these movements have been consistently skewed to the downside. The deepening moves into negative territory during this period point to weakening bullish momentum. However, the recent sharp upward spike also warrants closer examination. It is not yet clear whether this represents a lasting change in market regime or a one off data movement; that will become clearer only if the indicator holds steadily above zero.
Miner activity alone does not provide strong confirmation of either a rally or a decline. The Bull Bear Indicator’s time spent in negative territory, however, shows that the market has been struggling in terms of momentum. If the indicator remains negative and transfers from miners to exchanges increase, potential selling pressure could heighten the downside risk for prices.
Rather than focusing on a single sharp move, I’m watching which zone the indicator holds in from here. The latest spike could mark the beginning of a sustained recovery, but it would be premature to call it the start of a new bull run before confirmation arrives.
Bitcoin’s direction will depend not only on what miners do, but also on how much of the supply entering the Binance buyers can absorb. Based on the current picture, the decline is clearly set to continue.
Written by PelinayPA