
Key Takeaways
Cryptocurrency and other digitized assets create patterns as their prices develop on trading platforms. These patterns are often used in price analysis and trend speculations. Previous lows and highs are one of these trends.
Highs are regarded as a good indicator of a strong uptrend or positive market sentiments for an asset. Traders look out for the development pattern assets print as they grow in value.
A ‘higher high’ shows an asset attaining new levels in value while a ‘higher low’ is a show of strong resistance to downward trends. Overall, they are considered bullish signals.
Lows are generally regarded as bearish signals. Assets in their downtrends hit points lower than their previous highs and lows. This is considered a show of weakening support and momentum to break through resistance.
Traders consider low patterns as proof of a market receding in response to a weakening demand or a strong drop in positive sentiments regarding the asset.
A routine trader, a short-term investor, or a long-term investor’s decisions are usually calculated. The considerations leading up to an investment or a trade decision are spread across mathematical, psychological, logical, or simply speculative factors. Mathematical calculations involve analyzing indicators and numerical data, while psychological factors often involve examining trader sentiment over a period of time.
Traders can use historical price data and records obtained from trading tools as a resource to identify price patterns and predict future price movements. These patterns often reveal the highest and lowest values of an asset during each run, providing valuable information to traders.
In this article we look at how a trader can translate high and low patterns into potentially proactive trading decisions.
Highs and Lows in Trading
Across most financial sectors, the value of commodities shifts constantly. These shifts are either positive (rise in value) or negative (fall in value). As an asset’s value rises, it attains highs in proportion to the presiding demand and supply conditions. On the other hand, a drop in value sees assets reach lows. These (highs and lows) attain peaks, which mark a switch in trend.
Highs are peak points in the uptrend of an asset while lows are peak points in the downtrend of an asset. That is, an asset is said to attain a new high at the point where its uptrend is intercepted by a short or long-lived downtrend. This represents the peak of its previous run.
Highs and lows are used strategically in digital trading. Through price development charts, traders mark the lows and highs for a selected asset and compare these points as part of their pre-trading calculations.
For lows, this also applies; however, lows are attained as the value of an asset drops. During the course of a downtrend, points of interception by a brief or long-lived uptrend are marked as the new low.
This comparison splits highs and lows into points of higher or lower price development. Higher highs and lower highs; lower lows and lower highs are the two principal price indication sets used by traders. These points are distinct on charts. These points are also named according to their developing relationship with other points in the chart.
What are Higher Highs and Higher Lows?
A chart printing new highs that are higher than the previous high is said to be attaining higher highs. A chart showing new low points that are higher than the previous lows is said to be attaining higher lows.
Both points are relatively easy to identify for an asset in an uptrend. Higher and higher lows usually succeed each other.
To better understand this pattern, let’s take the BTC/BUSD one month chart as an example.

Higher Lows
Higher low patterns are derived when an asset continues to resist downward trends by dropping to a point above the previous low price levels.

In the above chart, bitcoin’s route from its steep fall from above $22,000 to below $20,000 (5 to 10 March 2023) and the recovery that followed is a good instance of a higher low pattern.
The drop below $19,800 on March 10, 2023, was quenched by a surge above $20,200 on the same day. The $19,800 low was succeeded by a new low when the surge above $20,200 was halted by a brief drop back below $20,150. The new low ($20,104) on 11th March 2023 was markedly higher than the previous low ($19,800).
This was succeeded by the new low created when bitcoin broke above $20,600 and shortly dropped below $20,540 before surging above $24,700.
The blue dashed line shows the relationship between the low points and the ascension angle as the price grew further after the previous high.
Higher High
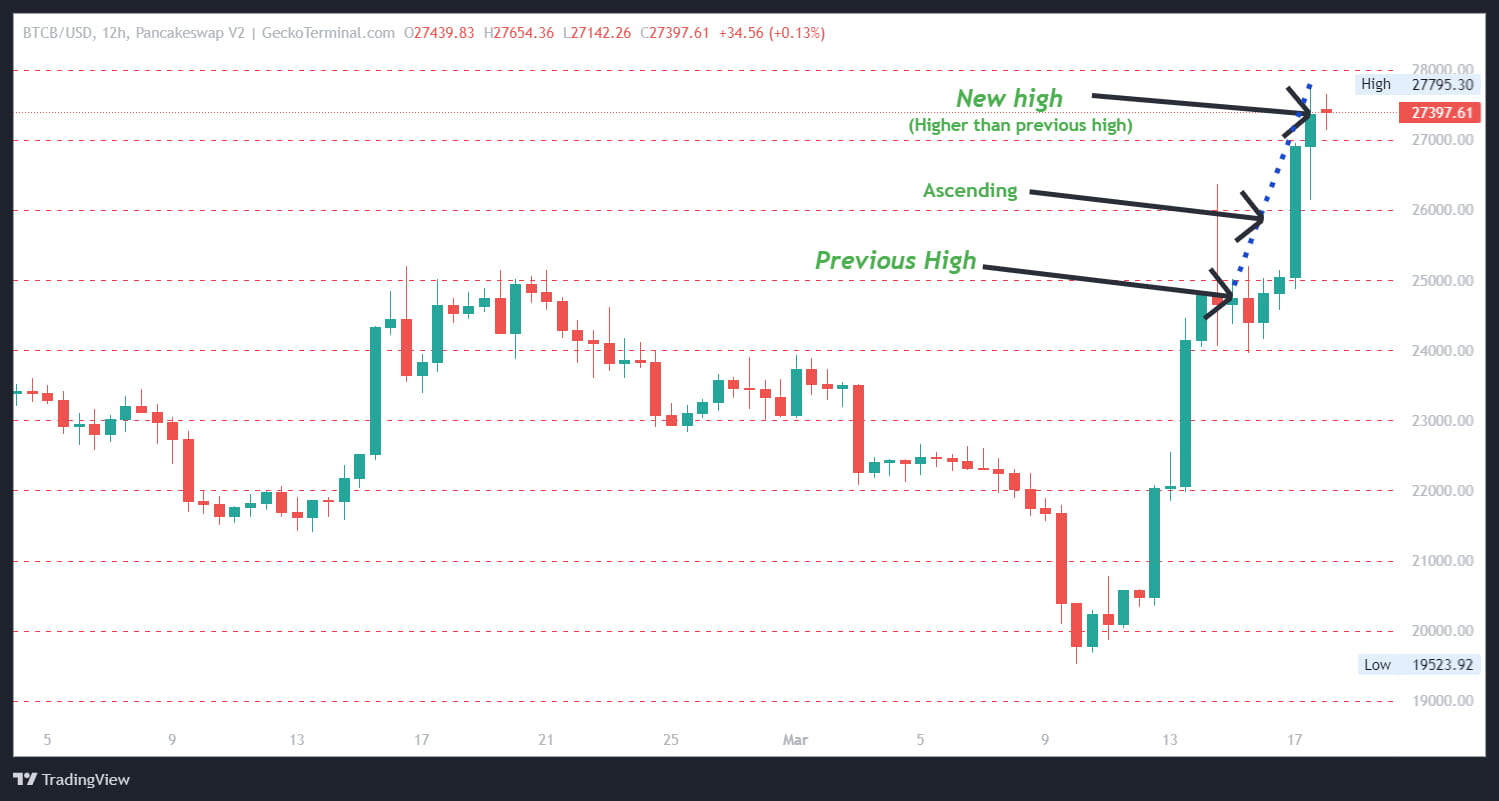
Higher highs, as the name implies, is a pattern printed when the value of an asset continues to hit new and higher points after intermittent drops.
The BTC/BUSD chart shows bitcoin’s uptrend from February 2023 to March 18, 2023. On March 12, 2023, bitcoin recovered from its downtrend at a point below $20,400 and surged to a new high above $24,700 on 14 March 2023. The uptrend was intercepted by a brief drop to $24,200, thus printing a new high at above $24,700.
Sequel to the brief drop, the uptrend continued briefly back above $24,700 (the previous high), breaking through $24,800 before it was intercepted again by a drop to $23,980, thus printing a new high. The new high (at $24,800) is higher than the previous high ($24,000), and an even higher high was attained when BTC surged above $27,500 on March 17, 2023.
The blue dotted line shows the relationship between the high points and the ascension angle as the price grew after the previous high.
What are Lower Lows and Lower Highs?
When the value of an asset drops, the chart prints low points. For an overall loss in value over a period of time, the chart is usually characterized by a regular switch between price drops and recovery. In this instance, the recovery is overpowered by an even bigger drop.
Drawing a pattern from these events produces a graphical representation of lower lows and lower highs as the general scope of the chart is in descent. Just like higher lows and higher highs, lower lows and lower high points are also distinct on price charts.
To better demonstrate this, let’s take a look at a chart from the BTC/BUSD pair. Bitcoin price development against BUSD from January 29, 2023, to February 2023 is a good example of a lower low and lower high pattern.
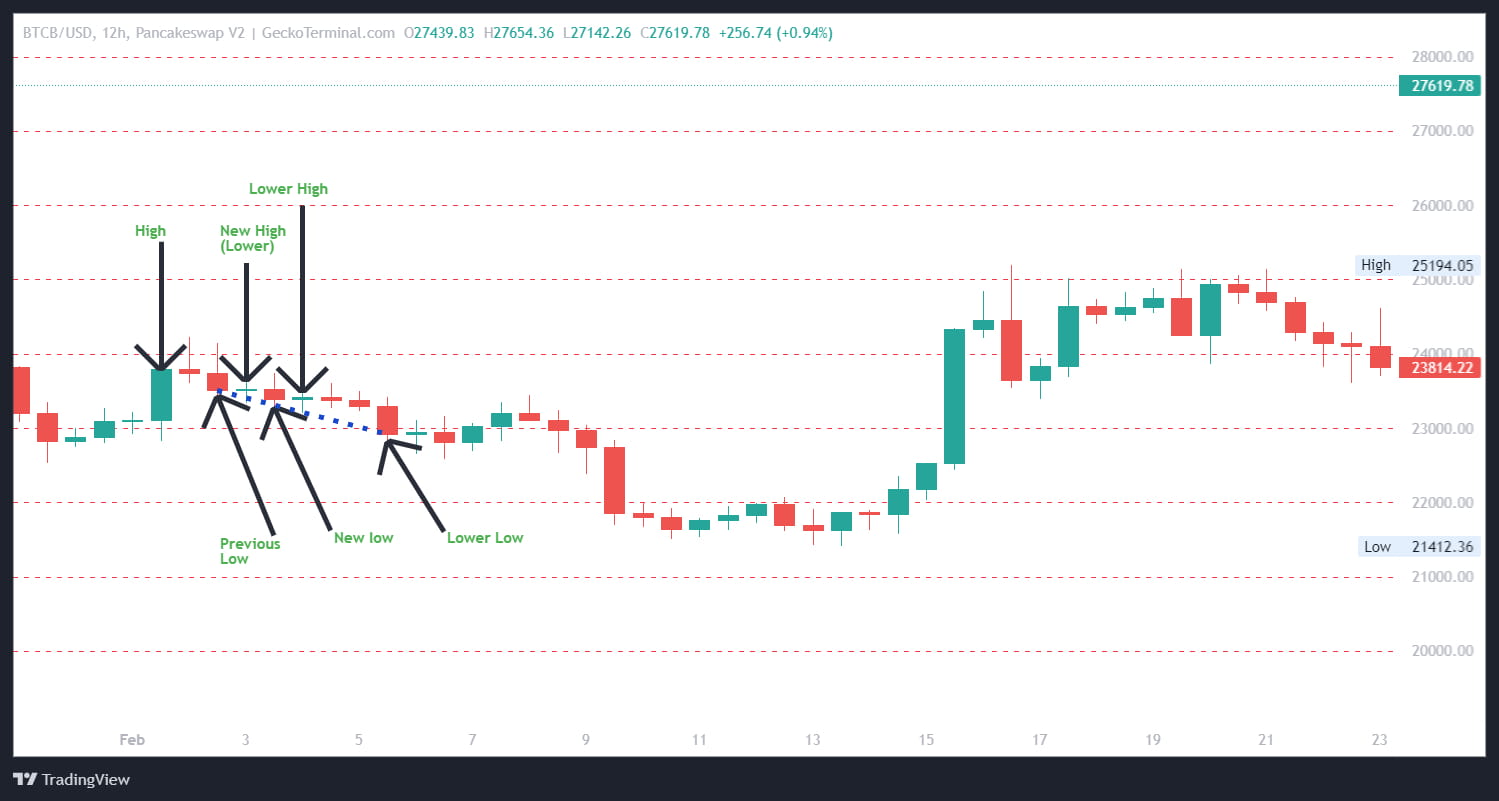
Lower High
Lower highs show the value of an asset being overpowered by sales. As it attempts to reclaim support levels and surge higher, it is regularly halted and its value goes even lower. The new highs are attained at levels below the previous high.
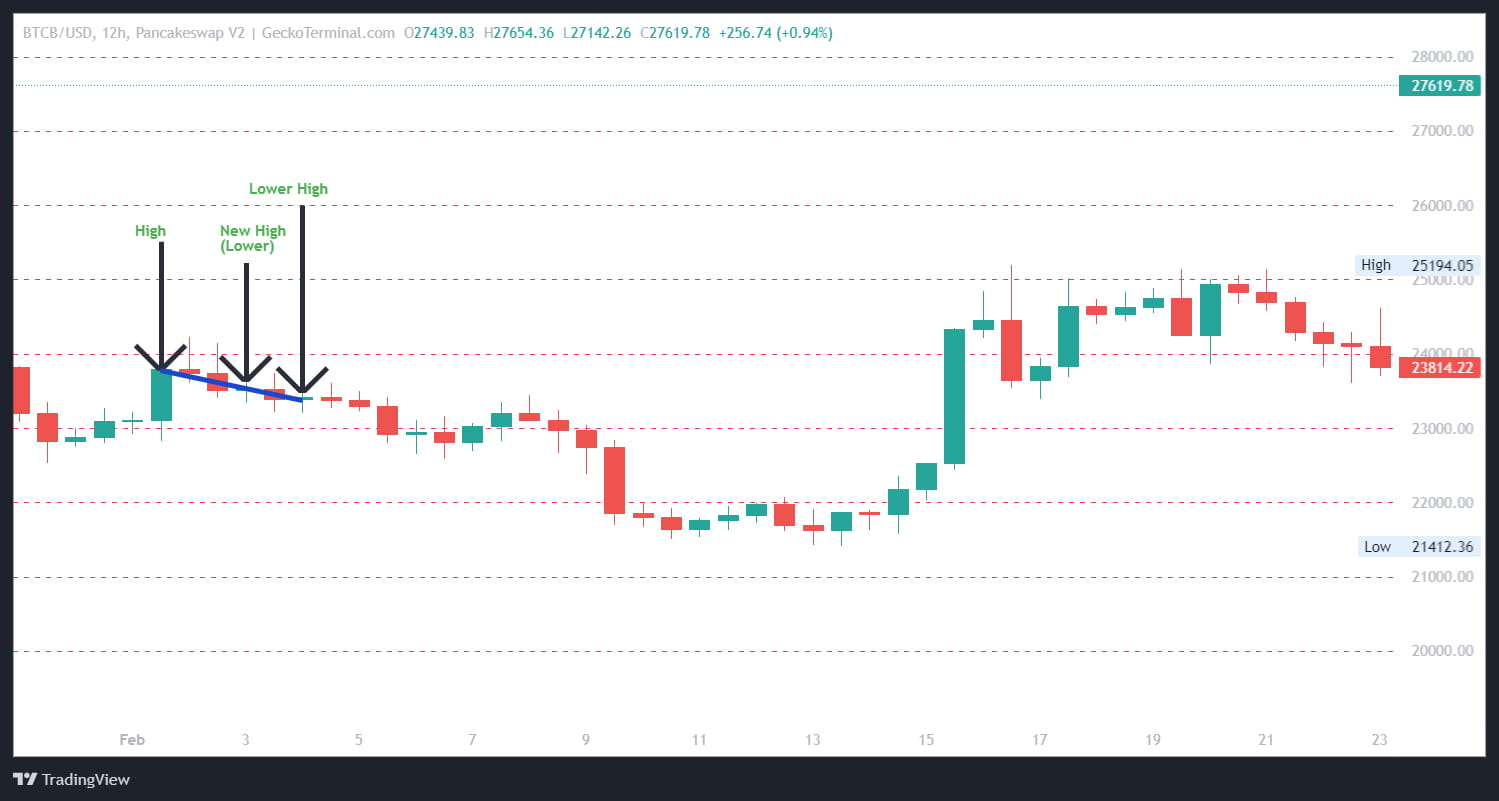
In the above example, as bitcoin recovers from the drop below $22,850 on January 30, 2023, it surges above $23,000 and breaks through this level to levels above $23,850 before it was halted by a drop back below $23,800. The $23,850 point becomes the new high and the reference for the chart drawn above.
The drop continues as bitcoin dropped further below $23,500 on 2 February. The brief recovery from this point to above $23,500 on February 3 marked a new high at $23,570. However, this new high is below the previous high of $23,850. The drop saw bitcoin go down again, below $23,400 before climbing back above $23,400 and printing a new high at $24,420. Once again, the new high is below the previous $23,570 high.
The blue line shows the relationship between the high points and the depression angle as the price drops further after each new high.
Lower Lows
In most charts showing price drops, lower lows usually succeed a lower high. Lower low patterns are printed when each new price drop sees the asset’s value go even lower than the previous point. As the name goes, the new low is lower than the previous low.

From the chart above, the reference low point is printed when bitcoin’s price went from levels above $23,770 to below $23,500 between 1 February to 2 February 2023. The short recovery to levels above $23,550 marks this point. The second low was reached after the recovery above $25,550 was halted by a drop below $23,400 on the following day, representing a new and lower low. The third successive low is marked by bitcoin’s drop below $22,850 on February 5.
The three lows illustrated are lower than the preceding lows. The blue dotted line shows the relationship between the low points and the descending angle as the price drops further after the previous low.
What Does the Highs and Lows Pattern Mean?
Apart from a record of price development, highs and lows are used by traders to speculate the next direction an asset takes in its price development.
Higher lows and higher highs are usually regarded as a show of strong positive sentiment for an asset, and are said to be bullish. The higher low pattern represents strong support at each point. It shows the resistance levels building at consistently higher levels. The higher highs show strong demand at each point as the asset breaches resistance at levels higher than the previous highs. When patterns like this set in, traders tend to assume that the next leg will follow the next pull-back.
On the other hand, lower lows and lower highs are regarded as indicators of dwindling positive sentiment or a building of negative sentiment around an asset. Patterns like this are deemed bearish. The lower highs that emerge at each point show a stronger sale force than the buying force as each recovery is followed by an even stronger drop. The asset continues to lose its momentum to the strong resistance.
The lower lows represent the asset’s inability to hold on to a support level as it drops further after each interval. Trading decisions deduced from this pattern might differ, while some traders expect a strong reversal after successive lower lows and highs, others might speculate even more drops depending on other factors they might have considered.
How to Apply These Trends in Trading
If you are planning to apply highs and lows to your next trade, you should first understand the fundamentals and the relevance. This article has introduced the concept to an extent; however, it is very important to explore ways to integrate it with other analytical tools.
To monitor or access the high and low patterns for an asset, you can use trading facilities like GeckoTerminal or TradingView. Visit the platform and select the asset in question. For a better view, it is recommended that you switch to the candlestick pattern.
On the trading chart and with the candlestick pattern, locate the latest high for the asset and the preceding high. Compare the latest high with the previous high. The latest high is a higher high if it is at a price level higher than the previous. If the price is lower than the previous high, it is a lower high.
Follow the same procedure to locate lows and deduce higher or lower lows.
Making trading decisions from these patterns is completely up to the trader, but traders use these patterns to proactively move towards the most profitable routes. This could be taking a short position and closing your long position when you speculate a bearish trend, or taking the opposite route when you expect the asset’s price to grow.
Final Thoughts
Traders’ behavior is a pattern, where the price charts are graphic proof of traders’ behaviors and a good tool for traders who are looking to deduce the next stage in the pattern development. High and low patterns are prints of how this behavior and sentiments affect the buy and sell trend of the asset in question. They join the ranks of other analytical tools that can be deduced from trading patterns.
While high and low patterns are easy to detect, making trading decisions using this pattern can be significantly more tedious. The increased tediousness comes from the fact that market trends and strength can change in response to other factors, including developments outside routine events. For cryptocurrency projects, this could be as major as a technical or marketing breakthrough, or as minor as periodic changes in sentiments.
It is then recommended that traders use each analytic tool alongside other tools to widen the scope of their decisions, such as by incorporating fundamental or on-chain analysis.
Having said this, do note that cryptocurrency trading is a risky venture and apply risk management strategies where possible. Also, note that this article is only for educational purposes and is not financial advice.