
I. Core on-chain signal: the second major wave of profit-taking this year
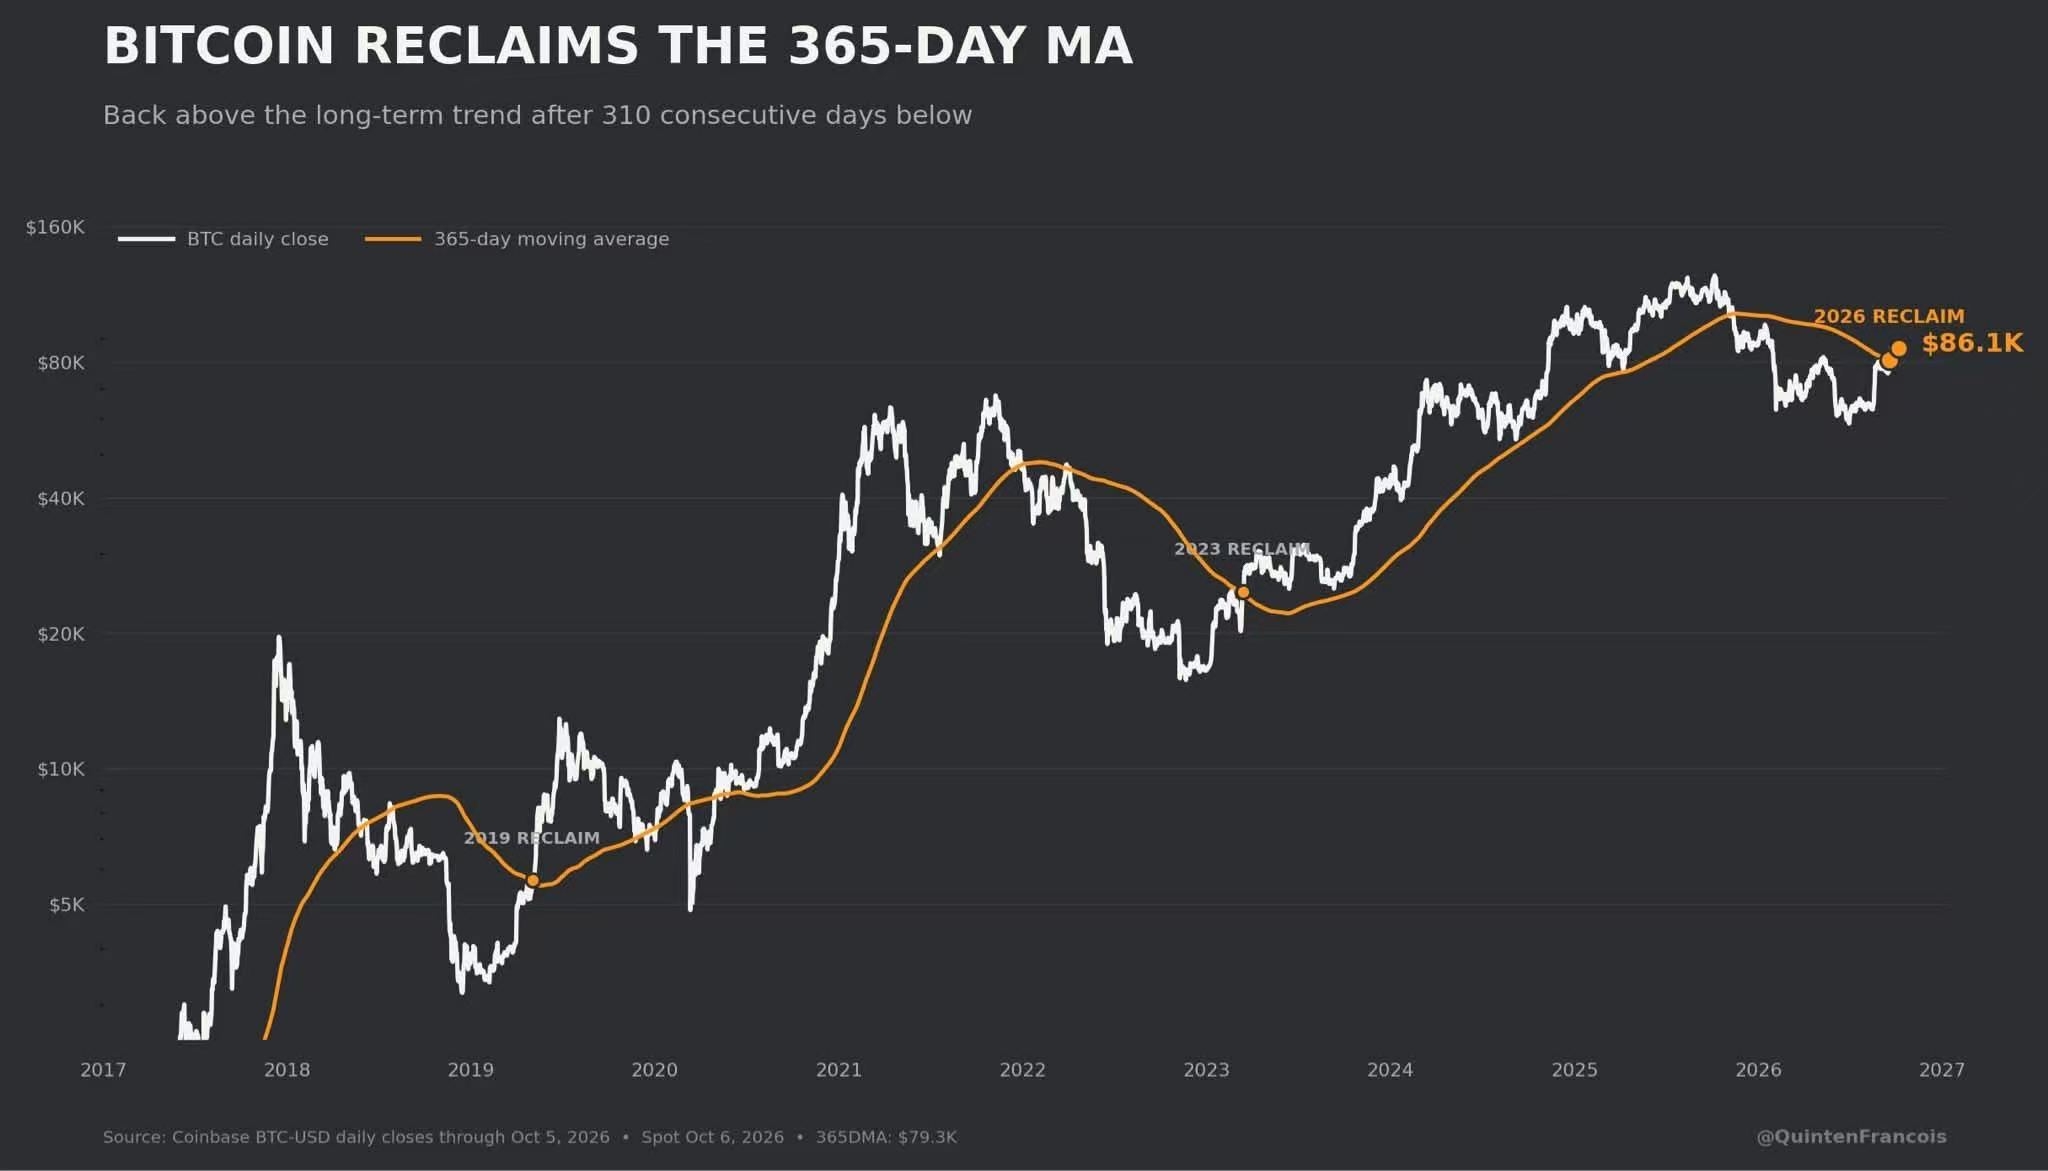
After BTC surged to test the $87,000 range, it recorded its second-largest daily realized-profit event of 2026. The network locked in as much as $1.03 billion in on-chain profits in a single day, second only to this year's peak of $1.04 billion.
“Network realized profit and loss” is a more accurate indicator of capital behavior than market prices:
A sharply positive realized-profit spike indicates that a large number of short- and medium-term positions were concentratedly closed to take profits. This is not retail behavior, but rather coordinated profit-taking by a cluster of addresses.
Historical patterns are clear:
Large-scale concentrated profit-taking → systematic increase in short-term market selling pressure → price action enters a period of choppy consolidation and temporary cooling.
Although this large-scale profit-taking does not directly end the trend, it has completely broken the previous one-way bullish momentum, leaving upside momentum under temporary pressure.
II. Core Cause of This Decline: Rapid Reversal in Institutional Flows
This pullback was not a technical retracement; its main driver was a reversal in spot ETF flows:
On October 7, spot BTC ETFs saw net outflows of $487 million in a single day. The figure was 2.1 standard deviations below the 90-day average, representing an extreme level of institutional selling.
For comparison: ETFs recorded cumulative net inflows of $2.65 billion over the entire month of September.
The underlying driver of this pullback was institutional funds shifting from sustained accumulation to concentrated profit-taking and exiting.
At the same time, the market decisively broke below the average ETF holding cost of 84318 USDT.
If the price falls below the average cost basis of institutional holdings, this range will shift directly from a “cost-basis support zone” to a “strong overhead supply zone.” Subsequent rebounds are likely to remain under pressure unless they break through on strong volume.
III. Technical Drivers of This Rebound (Why the Price Reversed at 80400)
BTC is currently trading at 81876 USDT, up 1.84% from the October 8 low of 80401 USDT.
This reversal was fully consistent with the order book and liquidation structure:
- 81000–81250: Low-price range where major players are positioning buy orders to absorb selling
- 81700–83300: Concentrated liquidation pressure zone
After the price retested the major-player buying zone and formed a long-wick low, bearish momentum was completely exhausted. This triggered bargain buying and forced liquidations, sparking the technical recovery seen in this rebound.
The effectiveness of the bottom can be clearly verified from the perspective of leveraged returns:
If you had gone long at the 80401 low with a standard position using 10x leverage, this rebound would have yielded nearly 18% in unrealized profit, making the risk-reward of buying at the bottom exceptionally attractive.
IV. Key Support and Resistance Levels Ahead (Core Trading References)
Resistance above
1. First short-term resistance: 83501 USDT (24H high)
Only a breakout can confirm that the rebound will continue and restore the short-term bullish structure.
2. Strong medium-term resistance: 87220 USDT (monthly high)
This is the core cost-basis zone for this round of profit-taking. Without incremental capital, it will be difficult to break through in one go.
Key support below
Ultimate defense level: 80401 USDT
A decisive break below this level would signal that buying support has failed, and a second wave of selling would likely follow.
V. Market Summary
BTC is currently in a “technical recovery phase following institutional profit-taking”
- Heavy profit-taking at elevated levels is capping upside
- Clear buying support from major players and a recovery in leveraged capital at lower levels
- The overall trend has shifted from a one-way rally to high-level range-bound consolidation and shakeout
There is no clear one-way trend in the short-term market. The core strategy is to buy dips rather than chase highs, reduce positions at resistance, and watch for directional cues while holding key support.