


$XRP 🚀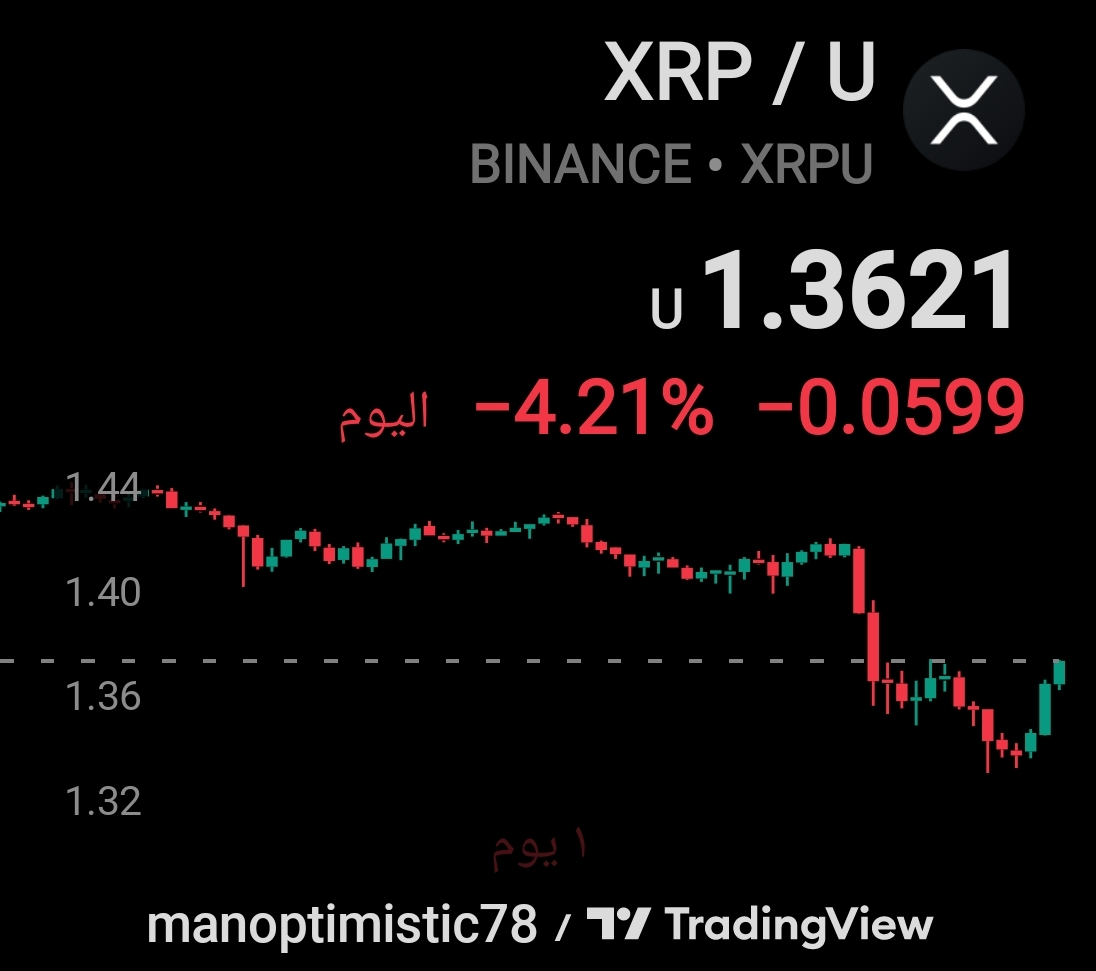
XRP saw notable declines during the recent trading sessions, recording a drop of 4.21%—to stabilize around the 1.3621 USDT levels. This strong move raises traders’ questions about the next direction, and whether we’re facing a temporary correction or the start of a deeper bearish trend.
📊 Reading in technical analysis and indicators
By following price action and technical indicators on trading platforms (Binance / TradingView):
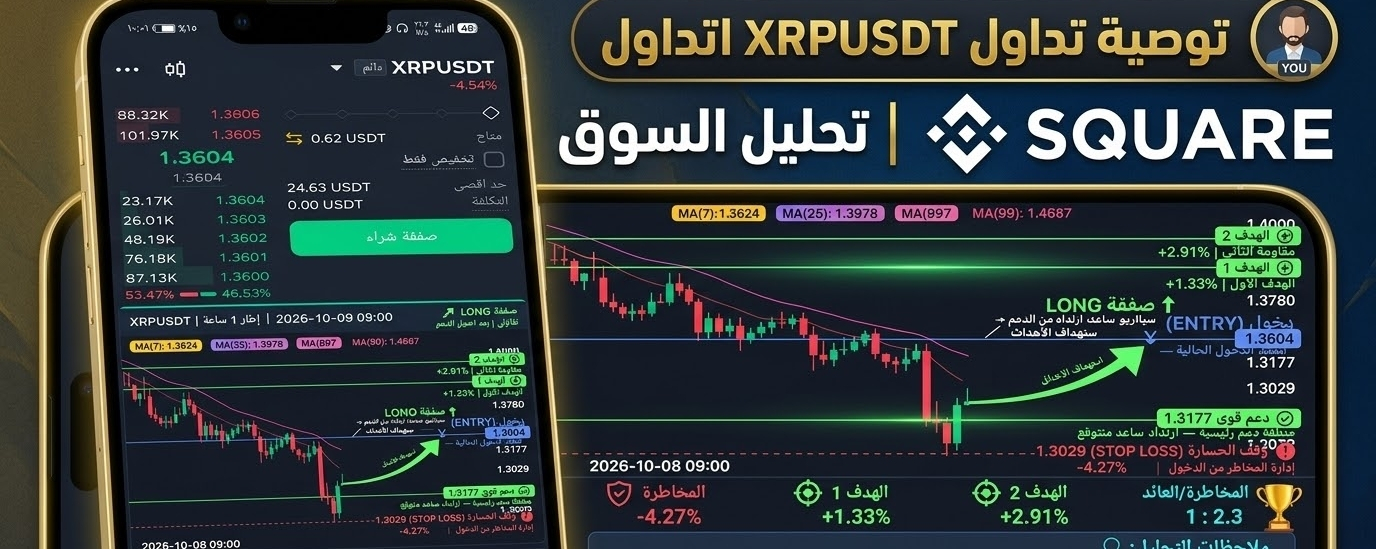
Overall immediate trend: The 24-hour chart shows a sustained decline from around 1.44 USDT to a local low of 1.3177 USDT, before prices saw a slight rebound toward 1.36 USDT.
Moving Averages: The moving average indicators (MA7 at 1.3677 and MA25 at 1.4005) show a "Strong Buy" signal, with the balance favoring near-term upside.
Overall indicator summary: The technical summary gives a Buy signal (14 Buy signals versus 4 Sell and 8 Neutral) on the short-term timeframe (1 minute), reflecting buying momentum attempting to capitalize on the current pullback.
🔮 Forecasts and Expected Scenarios
Bullish scenario (rebound): Holding above the 1.3177 USDT support level, along with continued buy signals from the moving averages, could push the price to retest resistance levels at 1.4000 USDT and then 1.4400 USDT.
Bearish scenario: A clear break below 1.3029 USDT (the suggested liquidation price for leveraged positions) could trigger forced closures, increasing selling pressure and pushing prices lower.
💡 Advice for traders: Always manage risk and activate stop-loss orders, especially when trading with leverage amid current market volatility.