

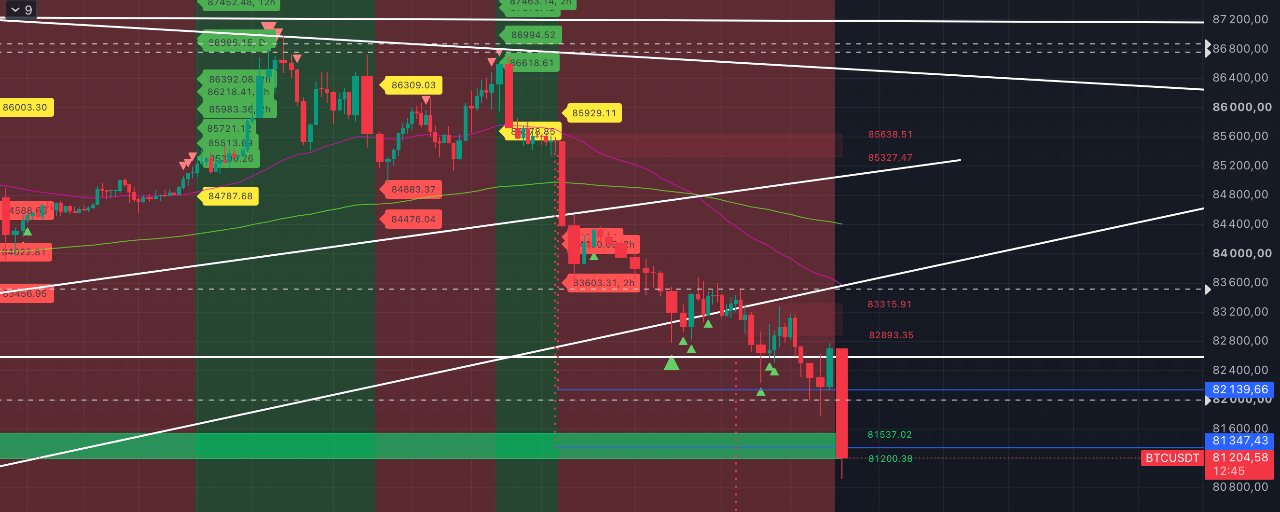


On the hourly timeframe, BTC has finally reached the liquidity zone at $81,200–$81,537. Which was our indicator-based target already since yesterday, and from the $84,400 area, when the price broke down into a steady downtrend on the hourly timeframe.
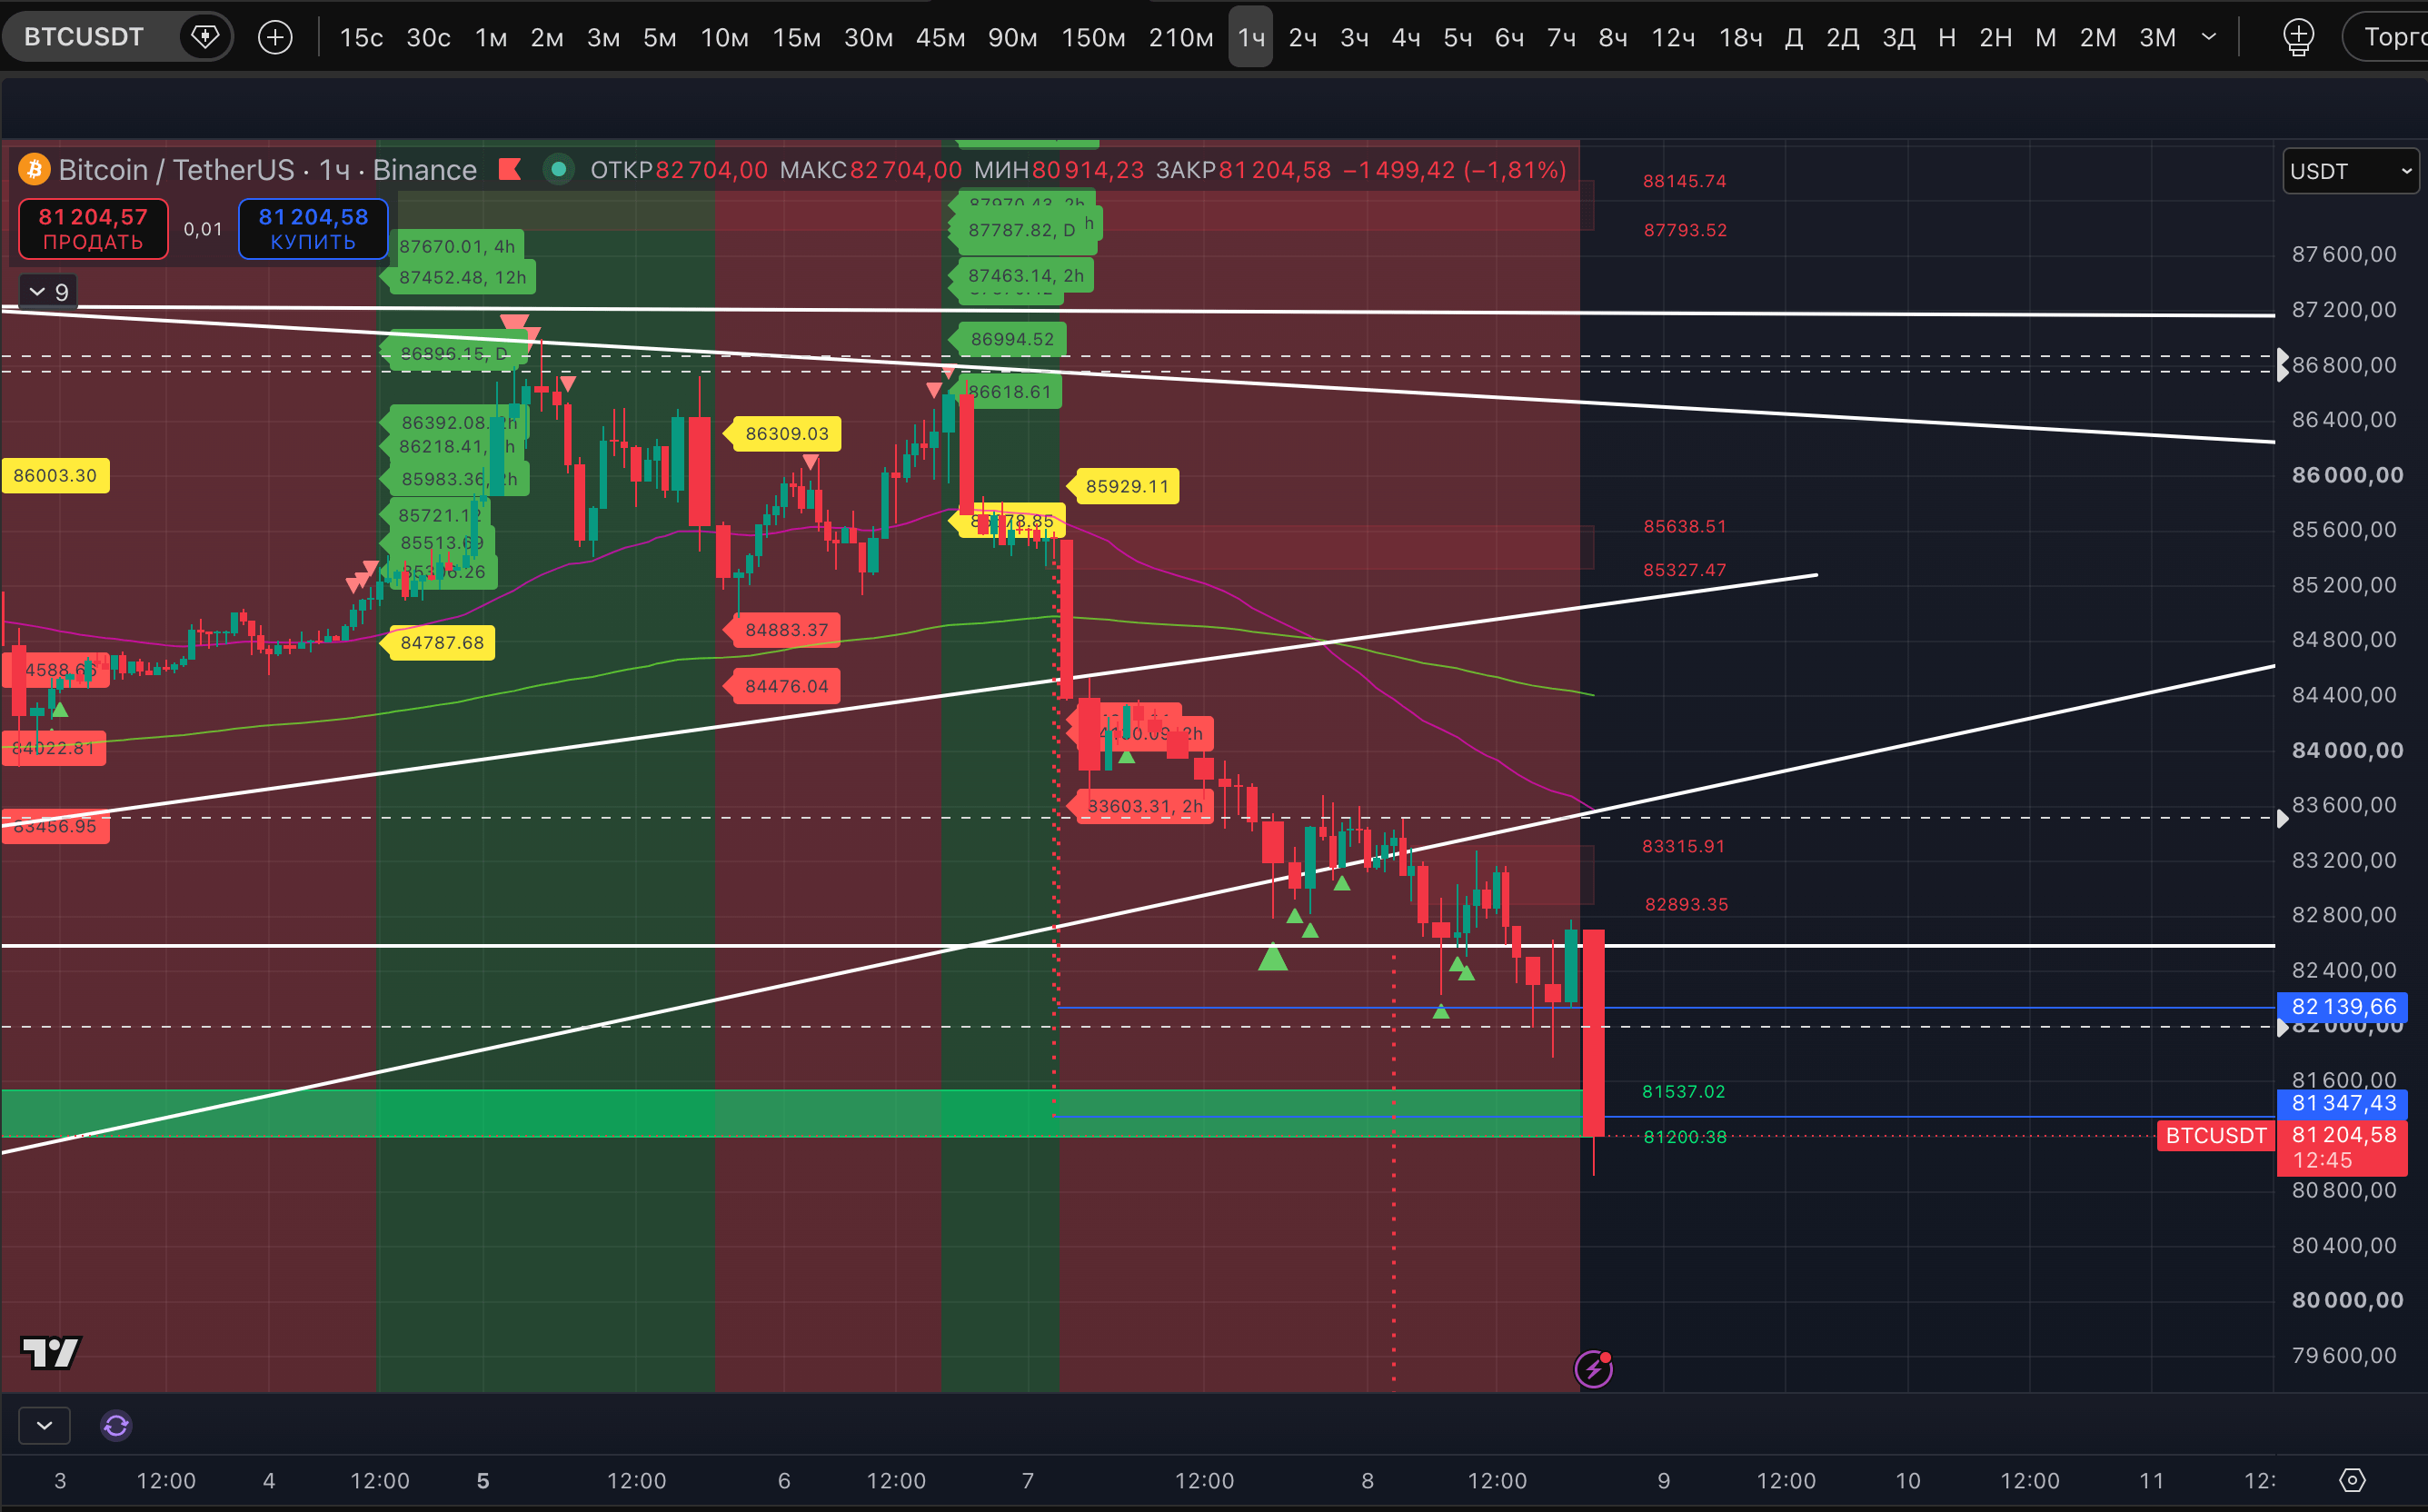
The first time we wrote about this zone was on September 28. Right now the zone is still holding, but if the current hourly candle closes below $81,200, then it can be considered invalidated as support.
On the 5-minute timeframe, there’s a dense concentration of targets, plus there’s been a test of liquidity zones and three Strong-signal highs—so the short impulse has slowed down.
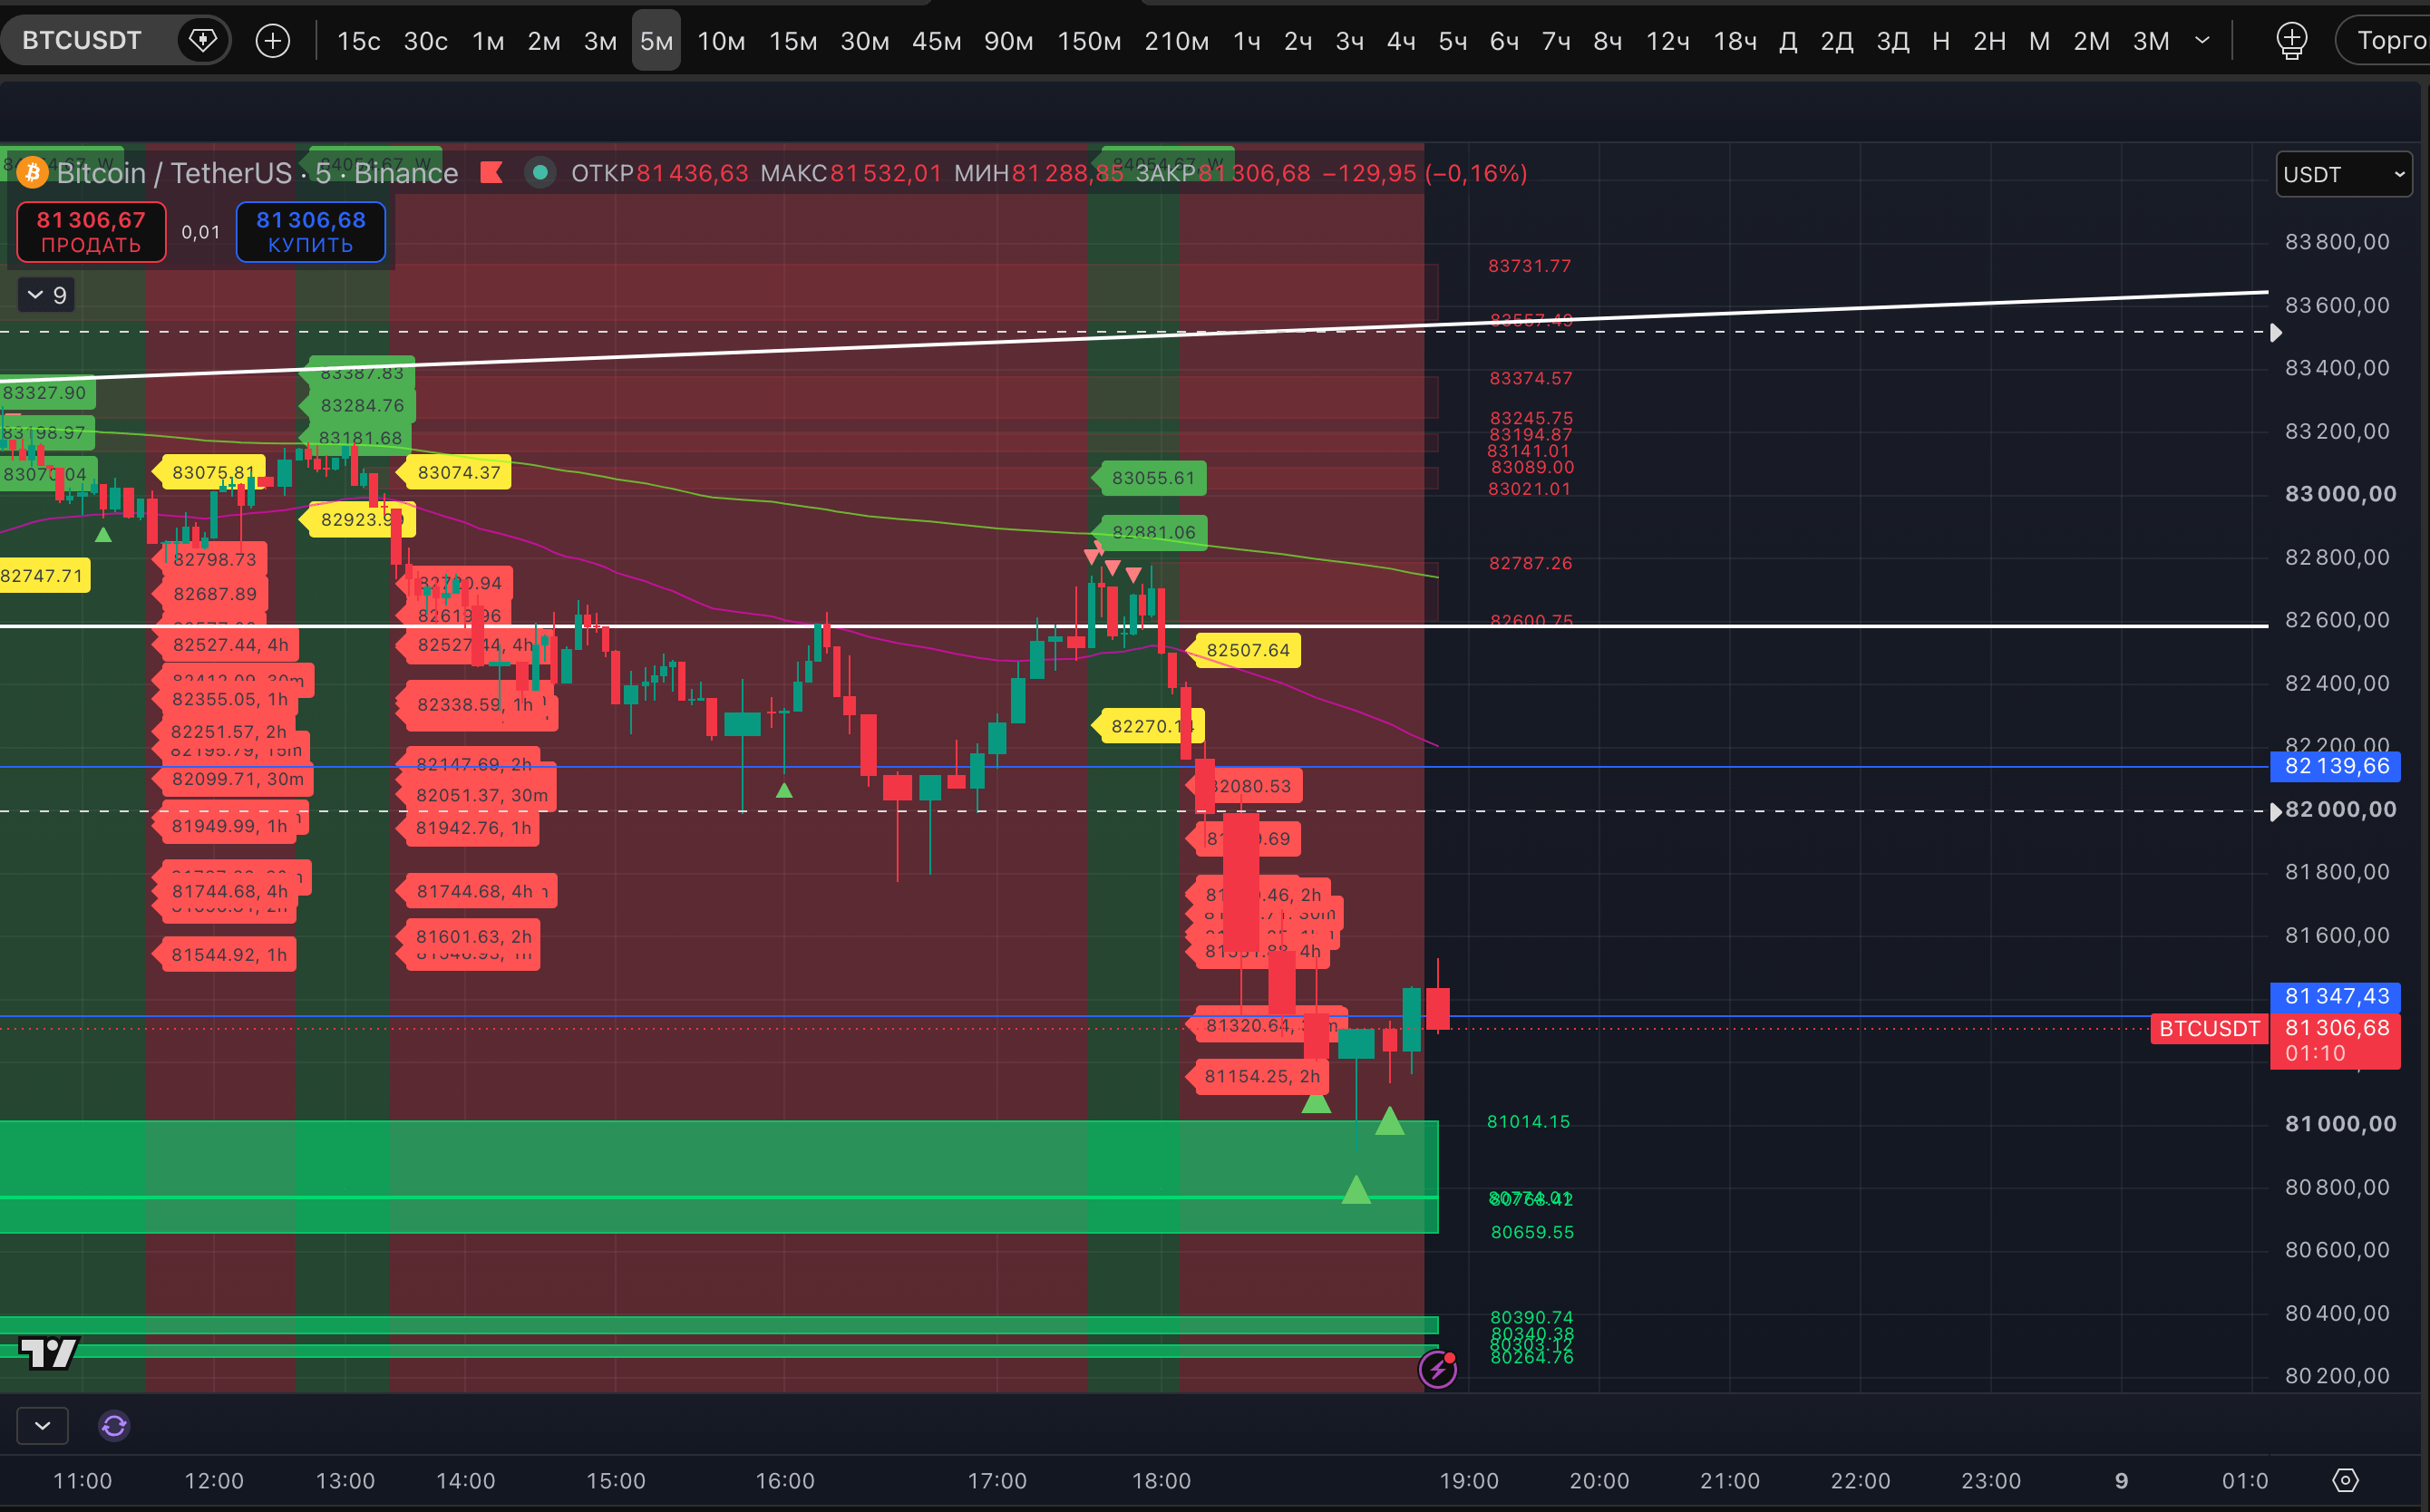
It’s still too early to draw any conclusions except one: the bounce that was expected since yesterday still hasn’t happened. The bounce forecast hasn’t played out. For those looking to add to a short after the first sell impulse—they’re not given an entry point and are being convinced in every way to add shorts at the current price. Subjectively, that was already stupid yesterday, and today it’s even more so.
For now, we’re just observing from the sidelines. The key question remains the same: will sellers be able to push #BTC back into a sustained downtrend on the 12-hour timeframe? The “bloodbath” in the altcoin market so far hints that sustained downtrends tonight could also spread to the daily timeframe.
Overall, we see the same market correction forecast we described, playing out through October 13. The massive labels of potential highs on the 3-day and weekly timeframes didn’t let us down 🦾. Now the main thing is not to miss the moment for the best accumulation of spot positions into crypto trading portfolios. We’re waiting for signals and mass labels of potential lows on significant timeframes from our Monitor. We’re considering the autumn correction specifically as an opportunity to build/add positions, no matter how strong it may be. Of course, within reasonable limits—because a mass breakdown of sustained uptrends on the weekly timeframe would wipe out all this optimism.