

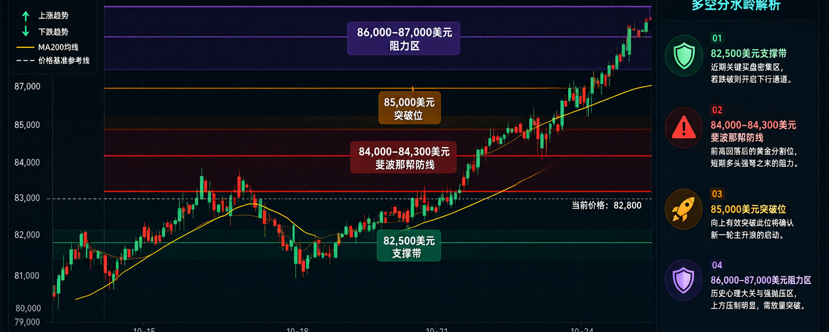

In early October, Bitcoin experienced a pivotal structural breakout. Fueled by a series of macroeconomic catalysts—including core PCE inflation falling to 3.0% and September nonfarm payrolls increasing by just 29,000—BTC broke through the $85,000 wall of selling pressure that had repeatedly capped its gains, touching the $87,000 level intraday. This marked a cumulative rebound of approximately 14.6% from the September 15 low of $74,968. Meanwhile, the reemergence of on-chain accumulation patterns, continued inflows into spot ETFs, and the release of the Fed’s draft stablecoin regulations are collectively reshaping the market’s medium-term narrative. However, a breakout does not necessarily confirm a trend: resistance remains in the $86,000–$87,000 range, and repeated tussles around $86,000 suggest that bulls and bears remain divided over what comes next. This article examines the market’s core dynamics and key variables to watch across four dimensions: technical structure, macro catalysts, regulatory developments, and institutional behavior.
I. From $82,500 to $85,000: A Decisive Breakthrough of the “Sell Wall”
In late September, Bitcoin was stuck for an extended period in a trading range of $82,500 to $85,700, with a dense cluster of sell orders around $85,000 overhead and repeated attempts to break higher failing. This pattern changed fundamentally in early October.
According to Glassnode, once buyers broke through the $85,000 sell-wall, some of the sell orders stacked in that area were filled while the rest were actively withdrawn. This sharply reduced the concentration of sell pressure near $87,000, and liquidity above that level became less apparent. This points to a fundamental reversal in the market’s supply-demand balance: price levels that once acted as resistance are turning into a new support base.
It is important, however, to recognize the fundamental difference between a technical breakout and confirmation of a trend. After reaching $87,000, BTC quickly retreated to trade within the $85,000–$86,000 range. The year-to-date high of $87,000 set on September 21 remains a key threshold for bulls to overcome. The $84,000–$84,300 area is a key 0.618 Fibonacci support level. If $82,500 breaks, the next major support will be lower, around $80,000.
The market’s central tension is that the structure below has improved, but upside momentum remains unconfirmed. The battle between bulls and bears in the $85,000–$87,000 range will determine whether this rebound marks the start of a new trend or a larger-scale technical recovery.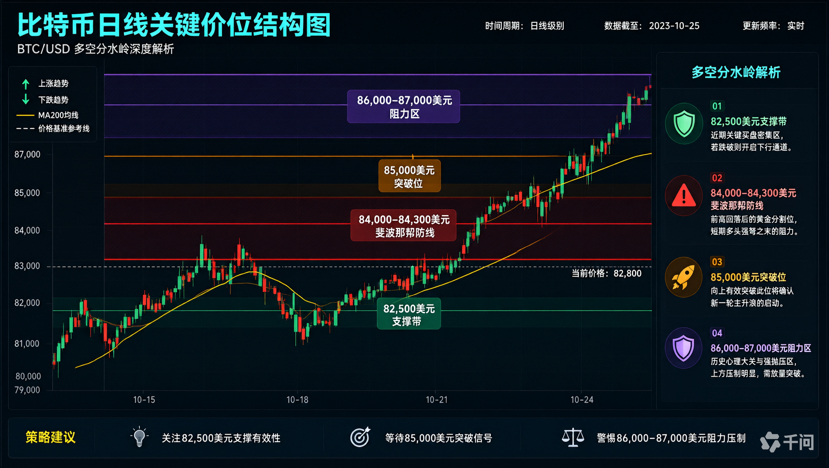
II. Macro Catalysts: The Combined Effect of Cooling Inflation and a Major Nonfarm Payrolls Surprise
The immediate trigger for this breakout came from an unexpected shift in macroeconomic data.
The U.S. PCE price index released on September 30 rose 3.4% year over year, slowing notably from 3.7% in July, while core PCE fell to 3.0%, below market expectations. After the data was released, Bitcoin quickly rose above $85,000, and risk assets broadly gained support.
More impactful still was the September nonfarm payrolls report released on October 2. Employment increased by just 29,000, far below the market expectation of 90,000. This major downside surprise completely changed expectations for the Fed’s policy path: the probability of another rate hike in October plummeted, and risk appetite rose rapidly. Bitcoin briefly surged to $87,000 after the data release, gaining more than 3% intraday.
However, the macroeconomic backdrop is not entirely favorable. The U.S. 30-year Treasury yield rose to 5.62% over the same period, while the 10-year yield briefly touched 5.29%. Gold also recorded its worst month of the year. Against a backdrop of rising real interest rates and pressure on traditional safe-haven assets, Bitcoin’s continued rise against the trend is itself a noteworthy structural signal. QCP Capital’s assessment is that this rally is more consistent with a concentrated flow-driven trade propelled by institutional inflows, regulatory catalysts, and technical improvements than with a simple currency-debasement trade.
III. A “Third Path” for Regulation: Administrative Action After CLARITY Stalls
The way U.S. crypto regulation is progressing is undergoing a subtle but important change. The CLARITY Act failed to pass in the Senate, meaning comprehensive market-structure legislation may be delayed until 2027. But the SEC and CFTC have not stood still; each is advancing its own regulatory arrangements through administrative action.
The most emblematic development was the stablecoin regulatory proposal released by the Federal Reserve before the GENIUS Act formally took effect. The proposal requires payment stablecoin issuers to back their tokens fully with short-term U.S. Treasury securities and other high-quality liquid assets, and to comply with standardized capital requirements and risk-management standards. This framework moves stablecoin issuance beyond the “issue tokens and that’s it” phase, toward requirements resembling prudential regulation in the banking sector.
Meanwhile, after the CLARITY Act failed to pass, the CFTC announced that it would develop a federal crypto regulatory framework on its own. The Federal Reserve also formally rescinded the restrictive policy it introduced in 2023, allowing uninsured state member banks to apply for approval on a case-by-case basis for “novel” crypto activities.
This series of moves reveals a clear trend: as legislative efforts run into obstacles, U.S. crypto regulation is advancing “by another route” through administrative rulemaking. Although this approach is more efficient, long-term policy certainty remains limited—as one member of Congress noted, administrative measures “lack the long-term stability of legislation passed by Congress and cannot replace a legislative solution.” For market participants, this means that the short-term regulatory environment has genuinely improved, but medium-term policy risks have not been eliminated.
IV. Underlying Institutional Signals: ETF Flows, On-Chain Accumulation, and Cost Basis
Institutional signals also warrant closer examination.
Spot ETF flows show a pattern of “recovering overall flows, but diverging by product.” On October 7, net inflows into spot Bitcoin ETFs totaled $119 million, including $122 million in one-day net inflows to BlackRock’s IBIT. Cumulative historical net inflows to IBIT have reached $65.924 billion. However, the Grayscale Bitcoin Mini Trust saw $10.97 million in net outflows on the same day, indicating that funds are moving from higher-fee products to lower-fee ones rather than entering the market broadly as new capital.
A more forward-looking signal comes from on-chain data. CryptoQuant’s Bitcoin Accumulation Trend chart shows a sharp contraction in the trading range—a pattern that is extremely rare historically, but that resembles price action ahead of the two major rallies in 2025, in April and March. The indicator tracks buying and selling behavior across different holder cohorts to show whether supply is being absorbed or distributed. Although this pattern has occurred too infrequently to serve as an absolutely reliable forecasting tool, its appearance now deserves close attention given the broader improvement in market conditions.
Cost-basis data provided by Bitwise offers the market clear reference points: the short-term holder cost basis is around $73,000, the true market mean cost basis is around $77,000, and the estimated average cost basis for spot ETF investors is about $83,000. After Bitcoin moved above the short-term holder realized price range of $85,000, the market entered a distribution zone where profits have historically been difficult to sustain. Bitwise puts the next short-term holder reference level at around $90,000, with the next two-standard-deviation level at $95,000. In its historical data, Bitcoin has traded above these two thresholds on only about 3.8% and 1.7% of days, respectively.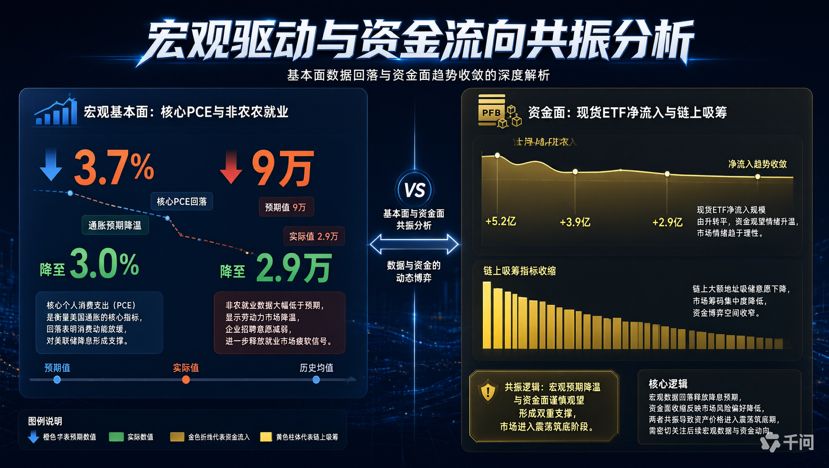
V. Diverging Institutional Narratives: Citi’s Bullish View and QCP’s Caution
The medium- and long-term outlooks for Bitcoin among major financial institutions are diverging significantly.
Citi raised its 12-month Bitcoin price target sharply, from $82,000 to $113,000, citing increased crypto-market activity, a supportive macroeconomic environment, and the resumption of ETF inflows. Citi expects crypto ETFs to attract around $5 billion in inflows over the next year. A weaker dollar and factors such as the U.S. Treasury’s buyback of long-term bonds are also expected to support digital-asset prices. TD Cowen takes a broader macro perspective, arguing that Bitcoin is evolving from a standalone investment asset into financial infrastructure for institutions, with the market’s focus beginning to shift from Bitcoin itself to the ecosystem forming around it.
QCP Capital’s perspective, however, offers a necessary counterbalance. QCP noted that the annualized funding rate for perpetual futures was just 5.4% during this rally, indicating that the move was driven mainly by spot-market flows rather than leveraged trading—an encouraging sign in itself. At the same time, the 30-day options risk reversal was around -2.5 volatility points, indicating increased demand for short-term downside protection. QCP’s central assessment bears repeating: BTC has shown resilience in a macro environment of rising interest rates, but the market is still driven mainly by flows and positioning changes, so it is too early to conclude that macro risks have disappeared.
VI. Technical Structure and Key Price Levels
Taken together, current market signals suggest that Bitcoin’s technical structure can be summed up as “an improving base, but an unconfirmed top.”
On the support side, $82,500 has been tested three times over the past week and held each time. This level has evolved from simple technical support into a dividing line between bulls and bears. The $84,000–$84,300 area, corresponding to the 0.618 Fibonacci support level, forms a second line of defense. If prices pull back to this area and find solid demand, the current structure will remain healthy.
On the resistance side, the $86,000–$87,000 area is the first major test. The year-to-date high of $87,000 set on September 21 is just above the current price, but repeated failed attempts to break through indicate meaningful selling pressure in this area. The September high of $87,400 is a key resistance level Bitcoin must clear to challenge $90,000.
In terms of market structure, the Fed’s FOMC meeting on October 28 will be the next major macro catalyst. Against the backdrop of Fed official Williams saying there is “no need to rush to adjust policy” and core PCE coming in below expectations, market expectations for rates to remain unchanged in October have risen, though the probability of a 25-basis-point rate hike in December is still estimated at around 80%. If the Fed signals a dovish stance at its October meeting, it could give Bitcoin fresh momentum to break above $87,000. Conversely, a hawkish policy stance could send the price back toward $82,500 or even $80,000 in search of support.
Conclusion: Staying Clear-Eyed Between Breakout and Confirmation
Bitcoin’s move from the lower end of its $82,500 trading range to a break above the key $85,000 barrier reflects deeper changes taking place in the market: a shift in macroeconomic data, the gradual formation of a regulatory framework, a structural increase in institutional participation, and improving on-chain supply dynamics. Together, these factors form a richer narrative than a simple “technical rebound.”
But markets never move in a straight line. The repeated back-and-forth in the $85,000–$87,000 range is a reminder that breakouts need ongoing confirmation from time and trading volume. With variables such as the October FOMC meeting, subsequent revisions to the nonfarm payrolls data, and the specific implementation of regulatory rules still ahead, the most rational approach at this stage may be to stay alert to structural signals while avoiding the mistake of equating short-term momentum with a long-term trend.#币安推出BinanceIntelligence #Evernorth推迟纳斯达克上市至10月12日 #美联储纪要聚焦10月暂停加息 #Robinhood增持2500万美元比特币 #标普500与纳指创历史新高 $BTC


