

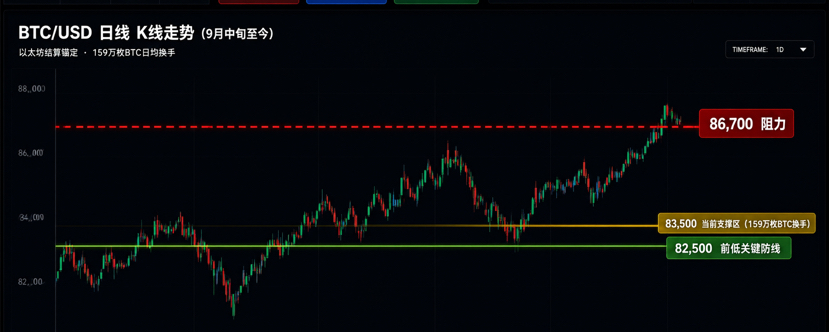

On October 7, 2026, Bitcoin plunged from $86,500 to around $83,500, wiping out more than $550 million in leveraged positions within 24 hours. Amid widespread market panic, however, the Fear and Greed Index fell only from 73 to 70, remaining far from capitulation territory. On-chain data shows that whales accumulated more than 40,000 BTC over 10 days, while BlackRock’s IBIT saw net inflows of $122 million in a single day. The real risk isn’t in today’s candlestick chart, but in 2028: the strategic Bitcoin reserve established by executive order could unravel with a change in presidents. This article unpacks the true significance of the crash through three lenses: technicals, capital flows, and policy.
I. The Battle Between Bulls and Bears Behind the Candlesticks: $83,500 Isn’t the End—$82,500 Is the Line in the Sand
In the early hours of October 7, Bitcoin plunged nearly $2,000 in about 20 minutes, briefly hitting $83,556, as roughly $400 million in leveraged long positions were wiped out in an instant. This was not an isolated event: since late September, BTC has been rejected three or four times near $87,000, with selling pressure pushing each rebound back down in the same area.
But amid the panic, one key fact has been overlooked. Even after this decline, Bitcoin is still trading within the $83,000–$87,000 range established over the past two weeks. The “stair-step” uptrend that has been rising in stages since July remains intact. The base of each step has moved higher: from the $62,000–$67,000 range in mid-July, to $76,000–$81,500 in late August, and then to $83,000–$87,000 from mid-September onward.
URPD (Unspent Realized Price Distribution) data provides a more precise line of defense: 1.59 million BTC changed hands in the $83,300–$84,600 range, meaning a substantial amount of Bitcoin was exchanged at these prices, establishing a solid cost basis. Analyst alicharts further notes that if Bitcoin can hold this support and break above $86,700, there may be little significant selling pressure before it reaches around $105,000.
So the key level to watch now isn’t whether Bitcoin can “hold the close” above $83,500, but the prior low of $82,500 below it. Giottus CEO has clearly identified $83,000 as key support, warning that a decisive break below it could lead to a retest of the $80,000–$81,500 range. As long as the prior low of $82,500 holds, the technical framework for the uptrend remains intact.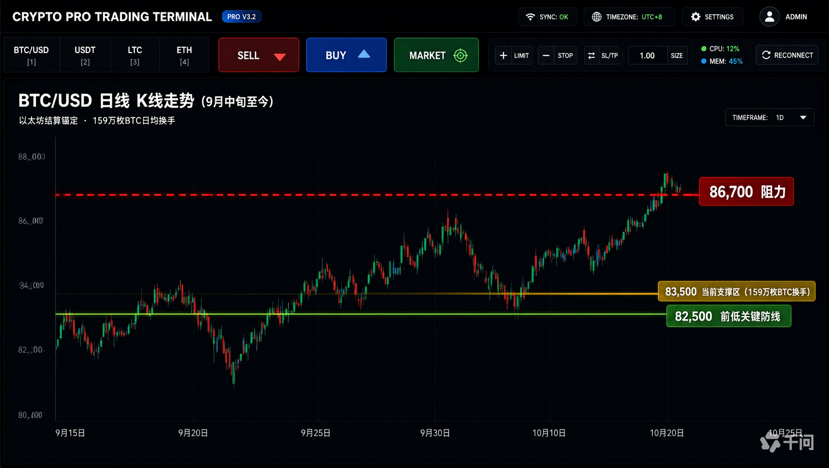
II. Who’s Buying and Who’s Selling: The Divergence Between Institutional Buying and Retail Panic
The most valuable signals during a sharp sell-off are often hidden in fund flows.
At the ETF level, spot Bitcoin ETFs saw total net inflows of $119 million on October 7. BlackRock’s IBIT alone recorded $122 million in net inflows that day, bringing its cumulative net inflows to $65.924 billion. Over the past month, IBIT has accumulated approximately $1.57 billion in net Bitcoin purchases. It now holds more than 800,000 BTC, worth about $67.87 billion.
On-chain data is also sending positive signals. Santiment data shows that wallets holding between 10 and 10,000 BTC accumulated a total of 41,025 bitcoins over the past 10 days. These wallets now control 13.64 million BTC, or 67.93% of the circulating supply. Meanwhile, Bitcoin balances on exchanges have fallen to around 2.68 million BTC, their lowest level since 2023. Binance alone saw net outflows of 23,137 BTC in the week ending September 27.
Retail leveraged longs are being liquidated, while institutional ETFs and whale wallets continue to accumulate. This divergence suggests that the current decline is a leverage flush, not a collapse in demand. As analyst Darkfost has pointed out, spot trading volume has been recovering from a three-year low in July. Binance’s spot trading volume exceeded $50 billion in September, a clear improvement on July’s $42 billion.
III. The Macroeconomic Backdrop: Rate-Hike Expectations Plunge, but Treasury Yields Remain a Sword of Damocles
A subtle but important shift is taking place at the macroeconomic level.
The U.S. core PCE price index rose just 0.2% month over month in August, below market expectations. The probability of another 25-basis-point Fed rate hike in October quickly fell from about 36% a week earlier to 15%–17%. Citi even expects the Fed to cut rates three times in a row starting in October, by 25 basis points each time—earlier than the previous expectation of cuts by year-end. The marginal easing in the rate environment is providing crucial support for Bitcoin and other risk assets.
But there’s another side to the coin: Treasury yields. The 10-year U.S. Treasury yield is currently around 5.32%, near its highest level since 2002. A risk-free return above 5% means the opportunity cost of holding Bitcoin has risen significantly. Analyst Benjamin Cowen expects the 10-year Treasury yield to peak by mid-November, a shift that could become a key catalyst for Bitcoin’s subsequent price action.
In other words, Bitcoin is currently caught between improving interest-rate expectations and still-elevated yields. This explains why its price has been seesawing within the $83,000–$87,000 range, unable to break higher but not experiencing a trend-level collapse either.
IV. The Real Risk Isn’t Today, but 2028
Returning to the central question raised at the beginning of this article: short-term market volatility is certainly severe, but what investors truly need to be wary of is the political vulnerability of the strategic Bitcoin reserve policy.
The U.S. government currently holds approximately 328,372 bitcoins, worth about $25 billion and representing 1.56% of the circulating supply. These assets were acquired through criminal and civil forfeitures, not market purchases. In March 2025, Trump signed an executive order requiring these bitcoins to be held as a permanent strategic reserve and prohibiting their sale. But the order has a fundamental legal flaw: it was not enacted by Congress, so a future president could revoke it at any time.
More concerning is the lag in implementation. The deadlines for the 30-day asset report and 60-day legal assessment required under the executive order passed in May 2026, but neither has been formally released to the public. A jurisdictional dispute between the Treasury and Commerce departments over which agency should manage the reserve remains unresolved and is currently being mediated by the Justice Department’s Office of Legal Counsel.
Two competing bills are currently seeking to make the reserve permanent: Lummis’s (Bitcoin Act) and the (ARMA Act), which aims to secure broader bipartisan support. If neither bill passes Congress, the reserve technically exists solely by virtue of an executive order.
One noteworthy recent event: On October 7, a U.S. government address transferred 833.6 BTC (worth approximately $71.56 million) to Coinbase Prime’s custody division. The transfer was small relative to the government’s total holdings of 324,000 BTC, but it was a reminder to the market that any activity involving government addresses can act as a catalyst for sentiment. It is worth watching for any larger transfers that may follow.
V. What Does a Fear and Greed Index Reading of 71 Tell Us?
The Fear and Greed Index currently stands at 70–71, in the “Greed” zone, down just 2–4 points from yesterday’s reading of 73. This figure is an important signal in itself: despite a sharp sell-off and more than $500 million in liquidations, market sentiment has barely changed in any meaningful way.
Historically, major market tops have often coincided with the Fear and Greed Index rising above 85 or even reaching “Extreme Greed” levels above 90. At genuine capitulation bottoms, the index typically falls below 20 into “Extreme Fear” territory. The current reading of 70–71 indicates a state of “cautious greed,” still some distance from either extreme.
This confirms a simple but effective market principle: a true top comes when everyone is euphoric, while a true bottom comes when everyone is in despair. One large red candle cannot change the direction of the trend, but it can certainly shake out holders who lack conviction.
Key Takeaway
Bitcoin is currently undergoing a “healthy pullback within a stair-step uptrend.” The high-volume trading zone around $83,000–$83,500 provides short-term support, while the prior low of $82,500 is the dividing line for whether the trend continues. Three factors underpin the medium-term bullish case: sustained inflows into institutional ETFs, accelerated accumulation by whale wallets, and easing expectations for rate hikes. But elevated Treasury yields and unresolved legislation for the strategic reserve pose significant downside risks. Traders should watch two key signals: whether support at $82,500 holds, and whether the U.S. government makes any further large transfers. As long as these two signals remain unchanged, the outlook remains unchanged.
The above is an analysis based on publicly available market data and news, and is for informational purposes only. It does not constitute investment advice. Cryptocurrency markets are highly volatile, and leverage magnifies risk. Make informed decisions and exercise caution.#币安推出BinanceIntelligence #比特币跌破8.4万美元 #迪拜VARA发布储备资产审计规定 #SEC批准3倍比特币ETF上市 #Winklevoss向美国SEC提交现货ZcashETF申请 $BTC



