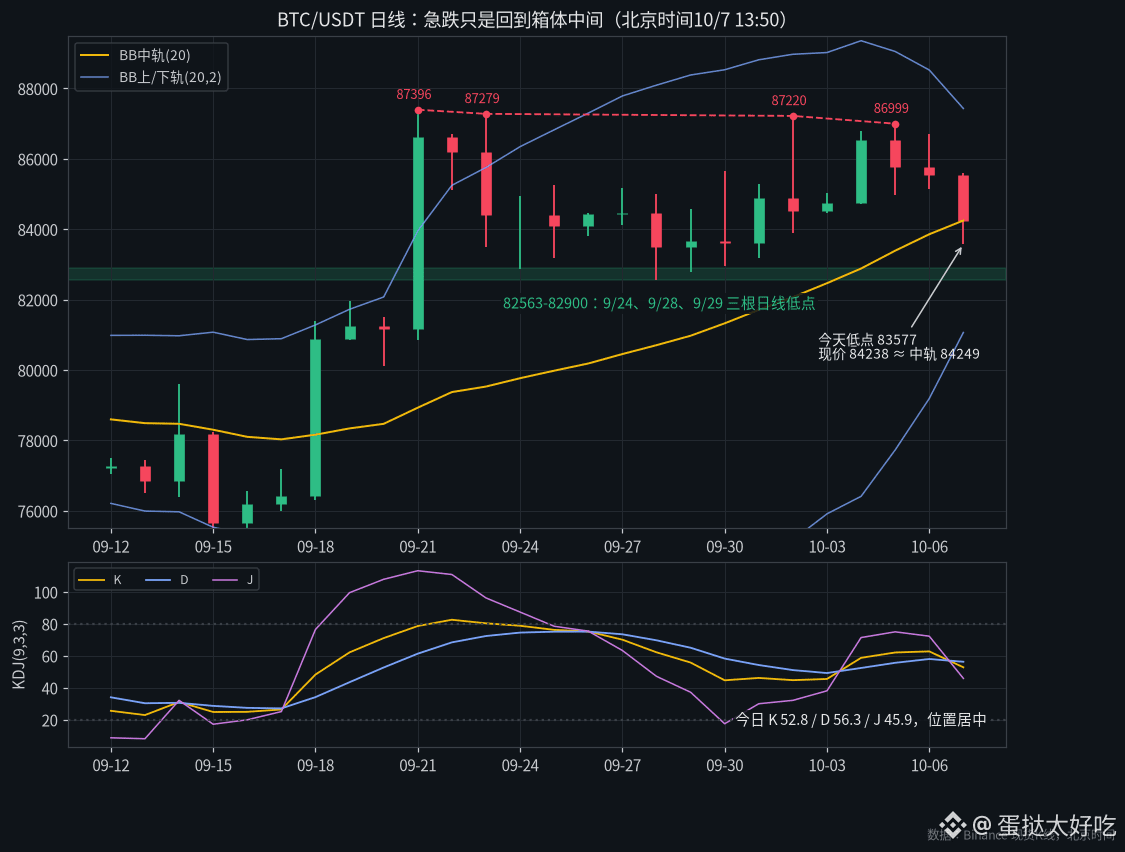
That sharp drop this morning barely changed anything on the daily chart. $BTC is now at 84238, while the daily Bollinger middle band is at 84249—a difference of just $11.
From 9 to 10, the price plunged from 85540 to 83577, dropping nearly $2,000 in an hour. The 1-hour RSI briefly hit 23. But zooming out, over the 15 daily candles since September 23, the high was 87279 and the low was 82563. This morning’s low was still $1,000 above the bottom of the range. Today’s daily KDJ is K 52.8, D 56.3, J 45.9. It has just turned into a bearish crossover, but it’s right in the middle—not oversold, and not exactly bearish either.
The positioning is even more interesting. After the sharp drop, contract open interest rose instead of falling, adding about 1050 coins from 9 to 12. The share of retail accounts holding longs climbed from 52.7% to 57.8%, up 5 percentage points in 4 hours. The top traders’ long/short position ratio only edged down from 1.633 to 1.607.
Over the past 20 days, this kind of widespread retail dip-buying within 4 hours has happened only twice. The last time was early on October 3, when the price was 84315—almost exactly where it is now. Over the following 48 hours, it pulled back by no more than 0.1%, and two days later it was up 1.3%. It’s only one data point, so it’s no rule—but it does at least show that buying the middle of the range doesn’t mean retail traders get wiped out immediately.
The short-term 4-hour RSI is 39.8, and the price is hugging the 4-hour Bollinger lower band at 84304. It’s a bit oversold, but still far from a level where I’d short or chase longs.
Trades opened in the middle of the range have about the same odds as a coin toss. For the past couple of days, I’ve only been watching the two extremes: the three daily lows around 82563–82900 below, and the progressively lower highs around 87000–87400 above. Only a break of one side is worth adding leverage for; these back-and-forth moves in the middle aren’t worth trading.
#BTC #Futures
From 9 to 10, the price plunged from 85540 to 83577, dropping nearly $2,000 in an hour. The 1-hour RSI briefly hit 23. But zooming out, over the 15 daily candles since September 23, the high was 87279 and the low was 82563. This morning’s low was still $1,000 above the bottom of the range. Today’s daily KDJ is K 52.8, D 56.3, J 45.9. It has just turned into a bearish crossover, but it’s right in the middle—not oversold, and not exactly bearish either.
The positioning is even more interesting. After the sharp drop, contract open interest rose instead of falling, adding about 1050 coins from 9 to 12. The share of retail accounts holding longs climbed from 52.7% to 57.8%, up 5 percentage points in 4 hours. The top traders’ long/short position ratio only edged down from 1.633 to 1.607.
Over the past 20 days, this kind of widespread retail dip-buying within 4 hours has happened only twice. The last time was early on October 3, when the price was 84315—almost exactly where it is now. Over the following 48 hours, it pulled back by no more than 0.1%, and two days later it was up 1.3%. It’s only one data point, so it’s no rule—but it does at least show that buying the middle of the range doesn’t mean retail traders get wiped out immediately.
The short-term 4-hour RSI is 39.8, and the price is hugging the 4-hour Bollinger lower band at 84304. It’s a bit oversold, but still far from a level where I’d short or chase longs.
Trades opened in the middle of the range have about the same odds as a coin toss. For the past couple of days, I’ve only been watching the two extremes: the three daily lows around 82563–82900 below, and the progressively lower highs around 87000–87400 above. Only a break of one side is worth adding leverage for; these back-and-forth moves in the middle aren’t worth trading.
#BTC #Futures