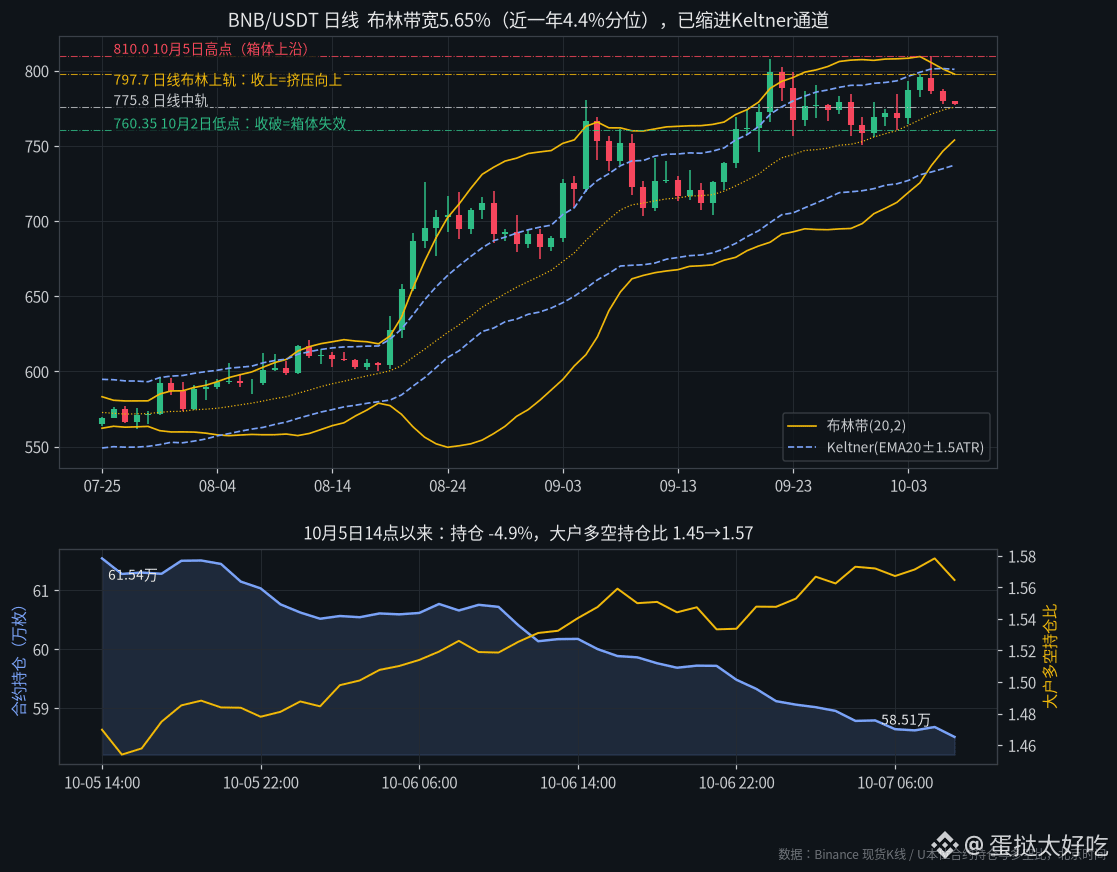
$BNB 43 hours saw futures open interest fall by 30,300 coins, down 4.9%, while the price only slipped from 794 to 777. Positions are being closed, but mostly short positions, so chasing shorts at this level isn’t worthwhile.
From 14:00 on October 5 to 9:00 this morning, open interest declined for 30 hours. This wasn’t a single liquidation event; positions were gradually being unwound. Over the same period, the large-trader long/short position ratio rose from 1.45 to 1.57. Longs haven’t really gone anywhere, but total open interest has shrunk, with more of the reduction coming from shorts closing their positions. At 8:00 this morning, the funding rate was 0.0005%—basically zero—and no one was willing to pay to add leverage.
The daily Bollinger Band (20,2) width is 5.65%. Over the past year, the bands have been narrower on only 4.4% of days. The upper and lower bands, at 797.7 and 753.8, have contracted inside the Keltner Channel, and the daily ATR is down to just 20.6. The 4-hour KDJ J-value is 1.6, meaning the short-term price is already pressed to the bottom.
Structurally, the daily low rose from 756 to 782. Over the past two days, the price has returned to around 777, with October 5’s high of 810 above. The 760–810 range is a trading box, and the daily middle band at 775.8 is right underfoot.
Looking back over nearly two years, the daily band width has fallen below 6% five times. In four cases, the bands first expanded upward, and the deepest pullback within the following 10 days was only 0.4% to 2.7%. The only downward move was on June 18 last year, when the price fell 6.7% over 10 days. The most recent case was July 20 this year: the band width contracted to 5.9%, then stayed tight for another nine days before the price moved up on July 30.
So I’d rather wait patiently around 770–775 than chase shorts at 777. A daily close above 797.7 would confirm that the squeeze has resolved upward; a daily close below 760.35 would invalidate this trading range.
#BNB #合约数据 #Technical Analysis
From 14:00 on October 5 to 9:00 this morning, open interest declined for 30 hours. This wasn’t a single liquidation event; positions were gradually being unwound. Over the same period, the large-trader long/short position ratio rose from 1.45 to 1.57. Longs haven’t really gone anywhere, but total open interest has shrunk, with more of the reduction coming from shorts closing their positions. At 8:00 this morning, the funding rate was 0.0005%—basically zero—and no one was willing to pay to add leverage.
The daily Bollinger Band (20,2) width is 5.65%. Over the past year, the bands have been narrower on only 4.4% of days. The upper and lower bands, at 797.7 and 753.8, have contracted inside the Keltner Channel, and the daily ATR is down to just 20.6. The 4-hour KDJ J-value is 1.6, meaning the short-term price is already pressed to the bottom.
Structurally, the daily low rose from 756 to 782. Over the past two days, the price has returned to around 777, with October 5’s high of 810 above. The 760–810 range is a trading box, and the daily middle band at 775.8 is right underfoot.
Looking back over nearly two years, the daily band width has fallen below 6% five times. In four cases, the bands first expanded upward, and the deepest pullback within the following 10 days was only 0.4% to 2.7%. The only downward move was on June 18 last year, when the price fell 6.7% over 10 days. The most recent case was July 20 this year: the band width contracted to 5.9%, then stayed tight for another nine days before the price moved up on July 30.
So I’d rather wait patiently around 770–775 than chase shorts at 777. A daily close above 797.7 would confirm that the squeeze has resolved upward; a daily close below 760.35 would invalidate this trading range.
#BNB #合约数据 #Technical Analysis