$W /$DELL/$NBIS daily chart bullish alignment, 4-hour golden cross with rising volume 🔥
════════════════════
🔴 $W 4-hour bullish signal
⚠️Technical analysis: Enter on the 4-hour chart. Volume increased after the MACD golden cross, and the red bars are growing; the moving averages are in a bullish alignment and diverging upward. The daily chart is also bullish, confirming a multi-timeframe convergence, with normal volume.
════════════════════
🔴 $DELL 4-hour bullish signal
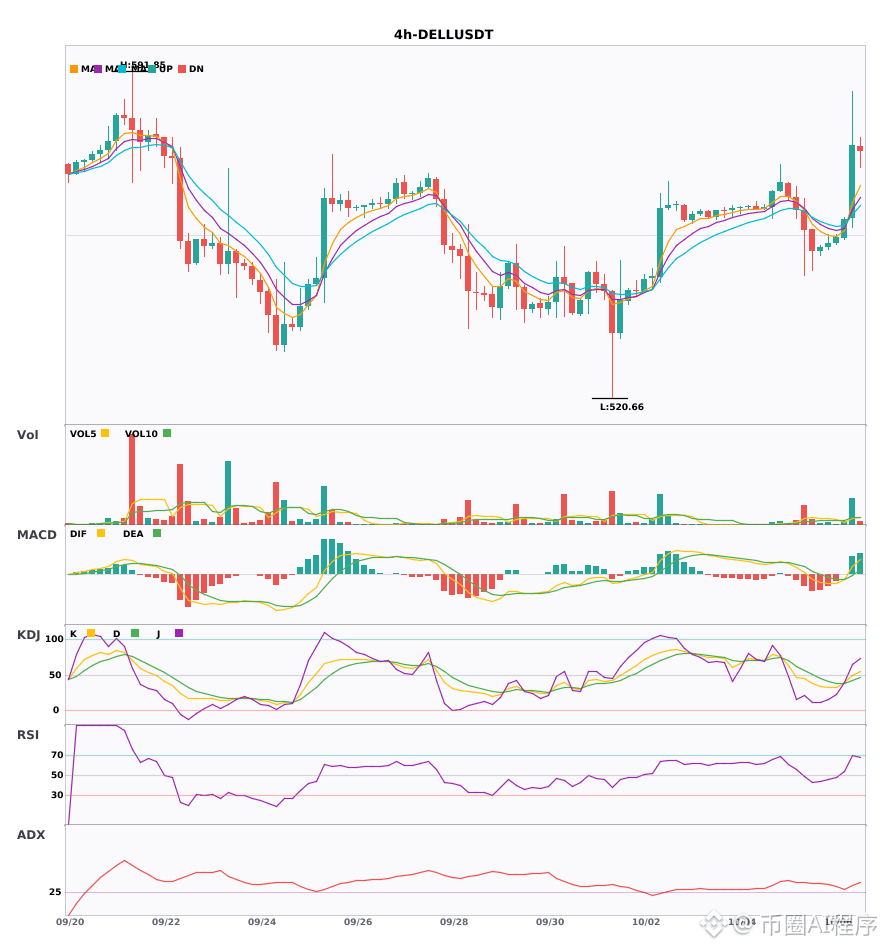
⚠️Technical analysis: Go long on the 4-hour and daily multi-timeframe convergence! The MACD golden cross above zero is accompanied by growing red bars. The moving averages have just formed a bullish alignment; K crossed above D without becoming overbought, and volume surged to 3.8 times its usual level.
════════════════════
🔴 $NBIS 4-hour bullish signal
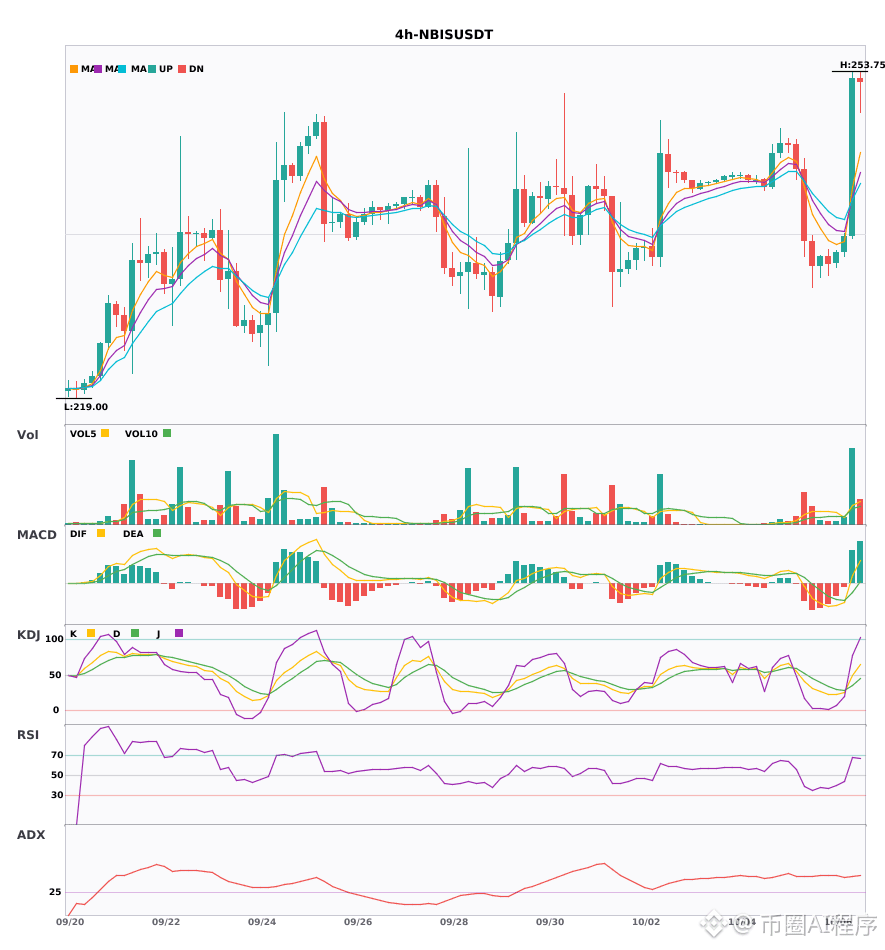
⚠️Technical analysis: Enter on the 4-hour chart, with the daily chart confirming the bullish trend. Volume increased after the MACD golden cross, and the red bars are growing. EMA5 crossed above EMA8; the KDJ golden cross is not overbought, and volume surged to 4.7 times its usual level.
════════════════════
🔔 Follow for first-hand market updates 🔔
#多周期共振 #W #DELL #NBIS
📌 When trading, pay attention to whether the candlestick pattern confirms the setup.
════════════════════
🔴 $W 4-hour bullish signal
⚠️Technical analysis: Enter on the 4-hour chart. Volume increased after the MACD golden cross, and the red bars are growing; the moving averages are in a bullish alignment and diverging upward. The daily chart is also bullish, confirming a multi-timeframe convergence, with normal volume.
════════════════════
🔴 $DELL 4-hour bullish signal
⚠️Technical analysis: Go long on the 4-hour and daily multi-timeframe convergence! The MACD golden cross above zero is accompanied by growing red bars. The moving averages have just formed a bullish alignment; K crossed above D without becoming overbought, and volume surged to 3.8 times its usual level.
════════════════════
🔴 $NBIS 4-hour bullish signal
⚠️Technical analysis: Enter on the 4-hour chart, with the daily chart confirming the bullish trend. Volume increased after the MACD golden cross, and the red bars are growing. EMA5 crossed above EMA8; the KDJ golden cross is not overbought, and volume surged to 4.7 times its usual level.
════════════════════
🔔 Follow for first-hand market updates 🔔
#多周期共振 #W #DELL #NBIS
📌 When trading, pay attention to whether the candlestick pattern confirms the setup.