


Solana price has held near $121 after its September recovery, with positive daily money flow supporting a renewed test of $125 resistance as traders watch whether October can bring a move toward $150.
Solana ( $SOL ) daily chart showed its price at $120.83 on Oct. 6, with a daily high of $122 and a low of $118.88. The token was little changed on the day, following a sharp September rebound and several sessions of trading below its recent peak.
The daily chart shows SOL recovering from the mid-$90s in September to the mid-$120s later that month. Price has since moved sideways around $120 rather than extending the rally, leaving the late-September high as the nearest barrier to another advance.
At $120.83, SOL sat approximately 3.5% below the weekly chart’s $125 pivot. A move to $150 would require a gain of roughly 24%, making the nearer resistance levels central to the October outlook.
Solana’s $125 barrier separates recovery from another advance
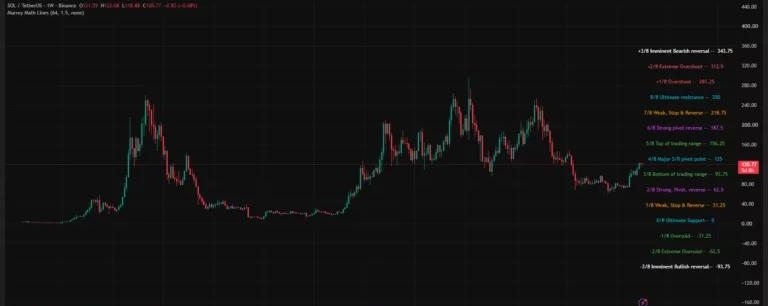
The weekly TradingView chart places $125 at the Murrey Math indicator’s major support and resistance pivot. SOL was trading at $120.77 on that timeframe, below a level that also overlaps the recent September peak.
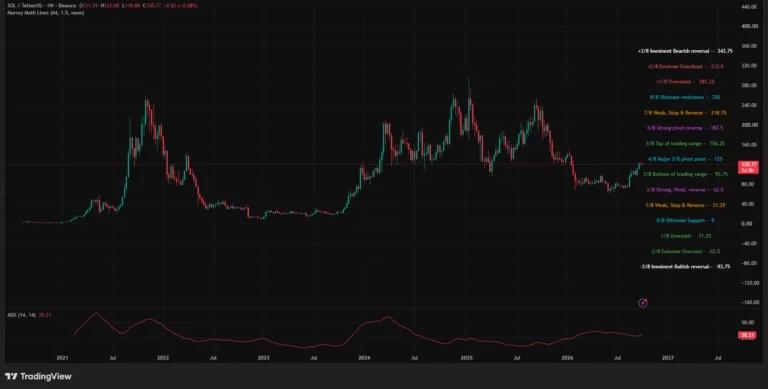
The next higher Murrey Math level stands at $156.25, marked as the top of the indicator’s trading range. Below the current price, the corresponding lower boundary sits at $93.75.
The weekly indicator creates a broad trading framework, while the daily chart places the immediate contest much closer to $125. A sustained break above that barrier would move SOL beyond its recent consolidation ceiling; another rejection would keep price inside the existing range.
Weekly Average Directional Index stood at 30.21. ADX measures trend strength rather than direction, so the reading does not independently establish a bullish October forecast.
The weekly price history also shows that the current recovery remains below the much higher trading levels recorded in 2025. October’s nearer upside setup therefore centers on reclaiming $125 before testing the next resistance areas.