

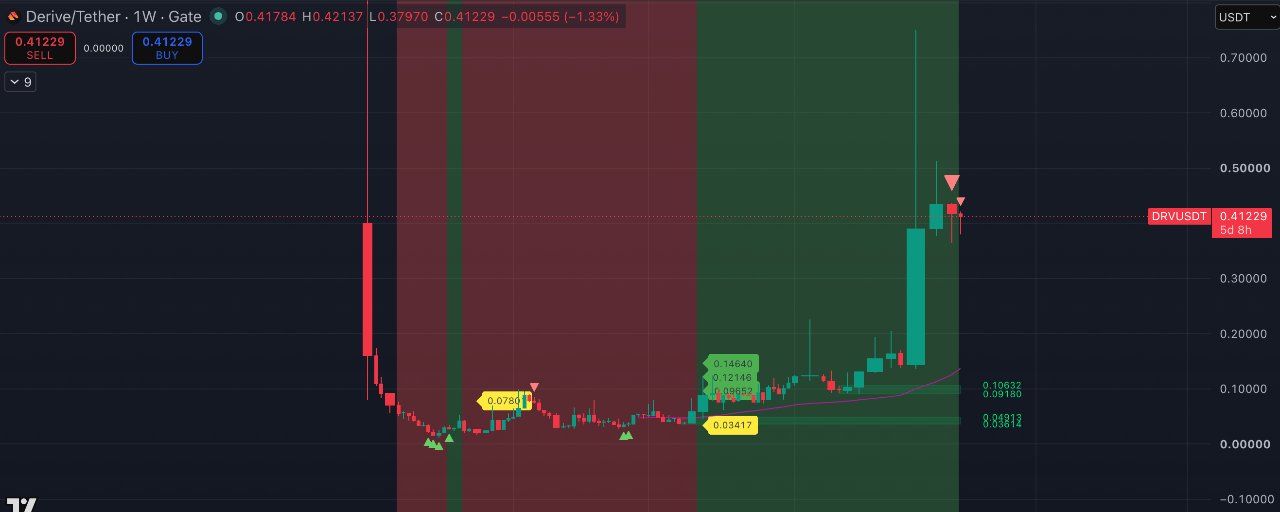


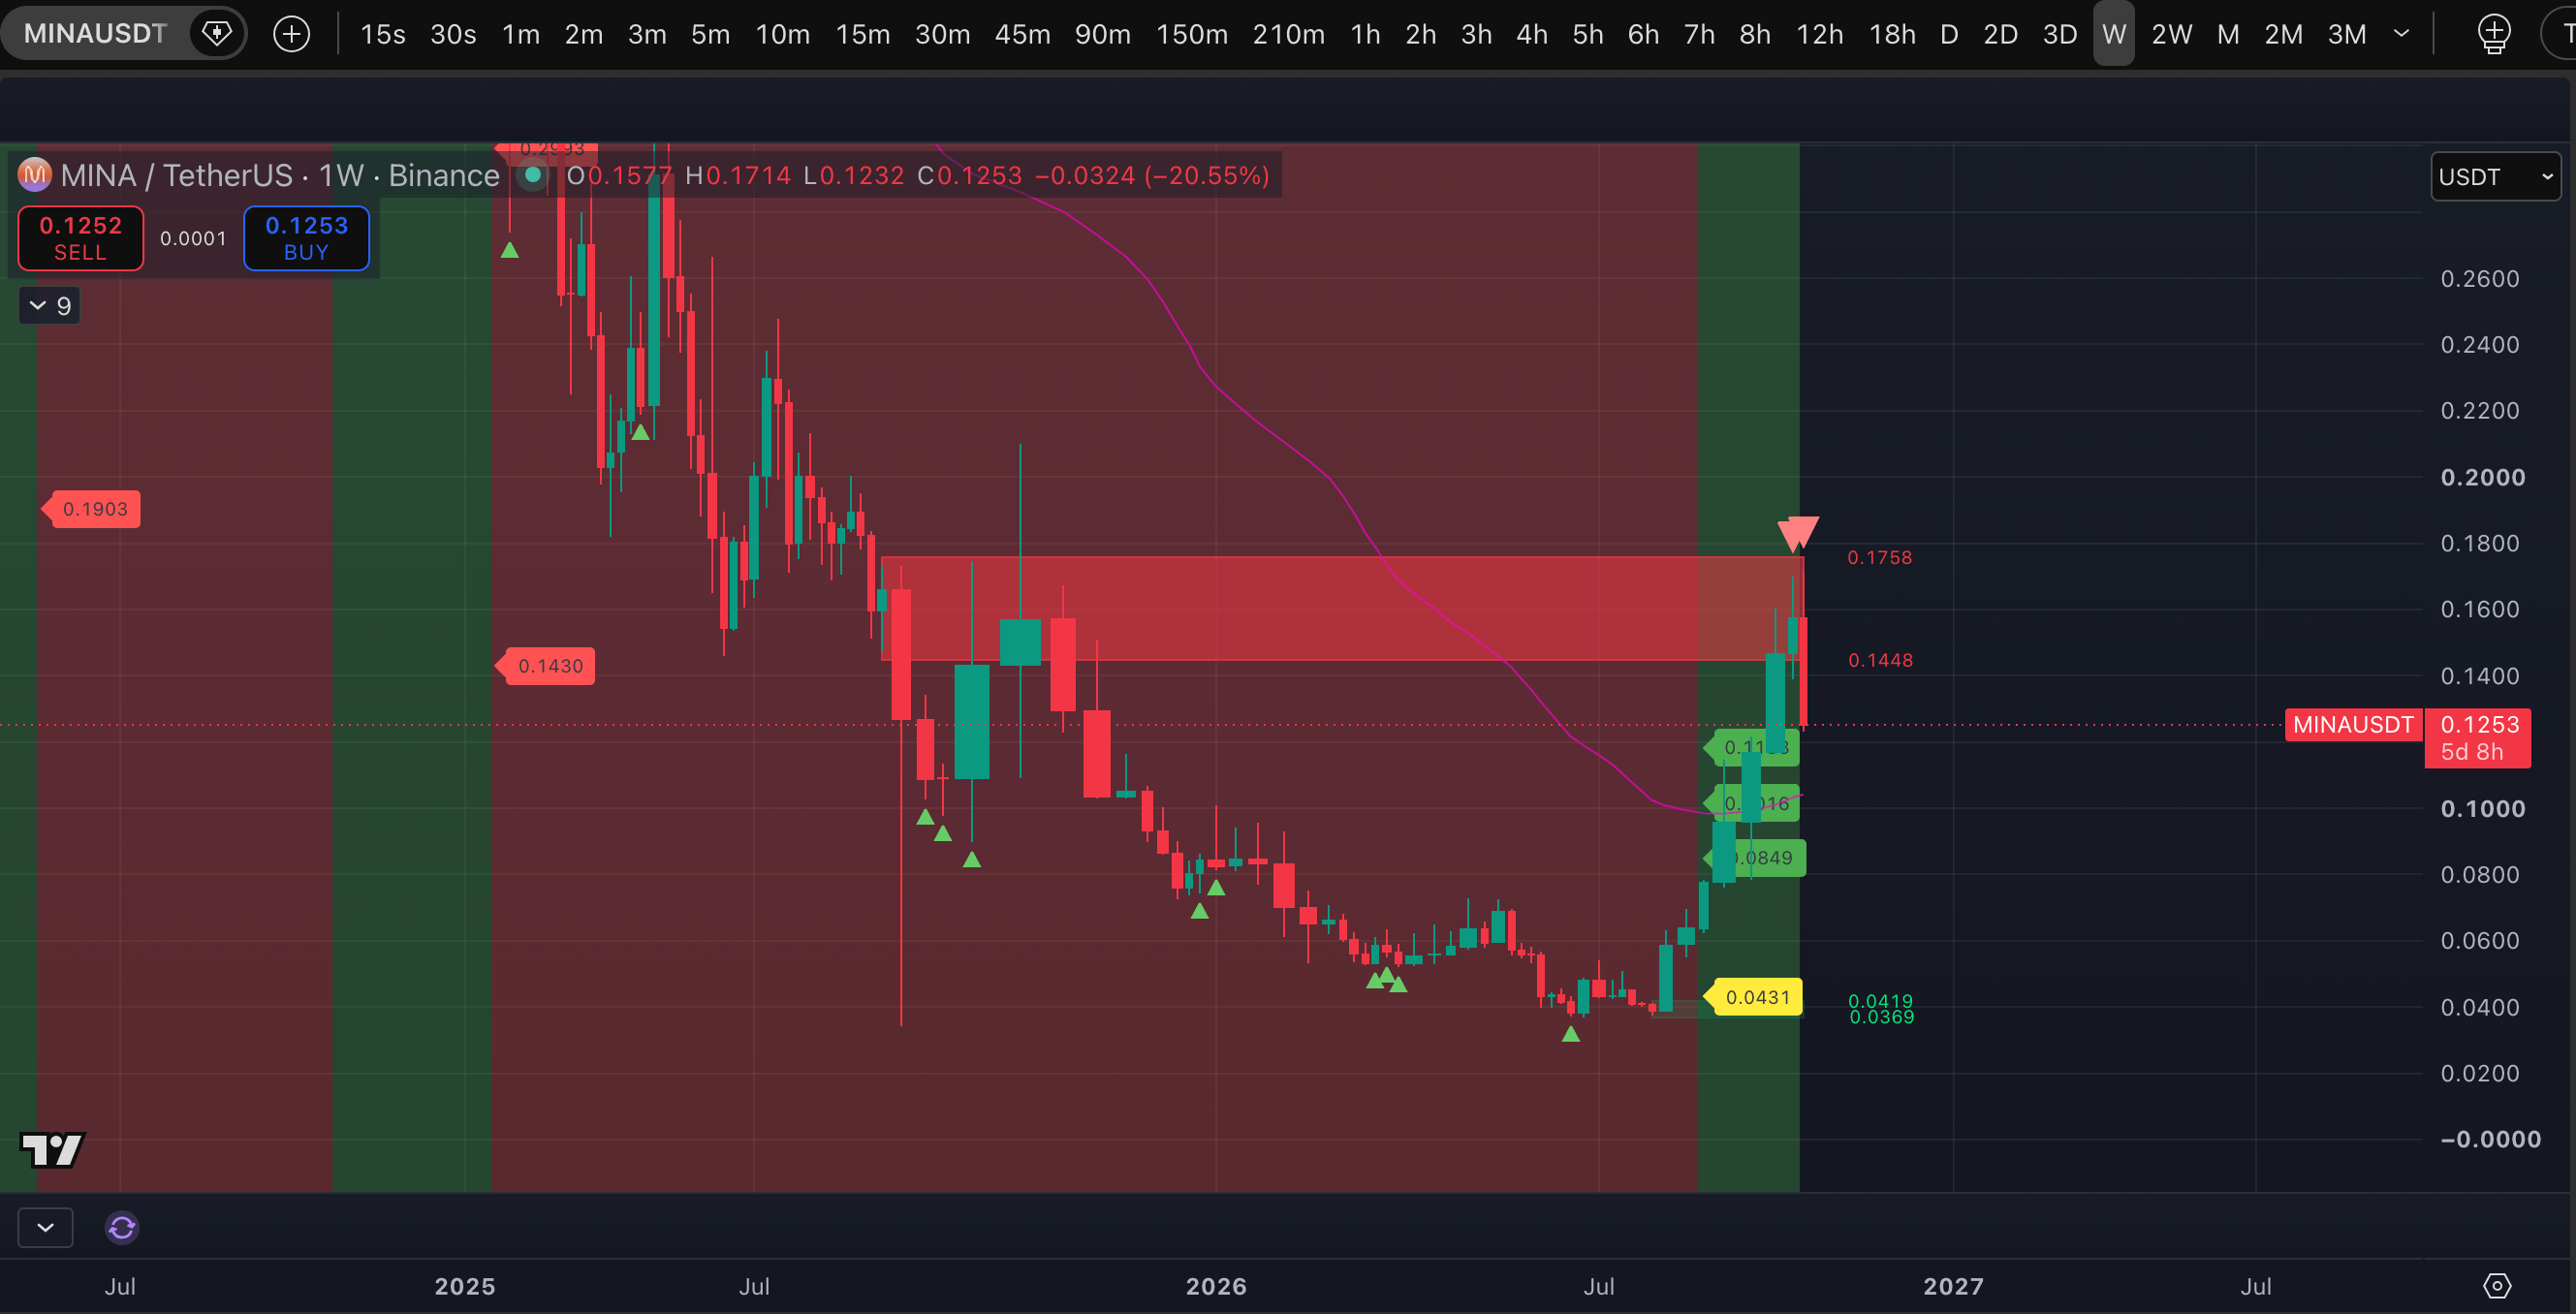
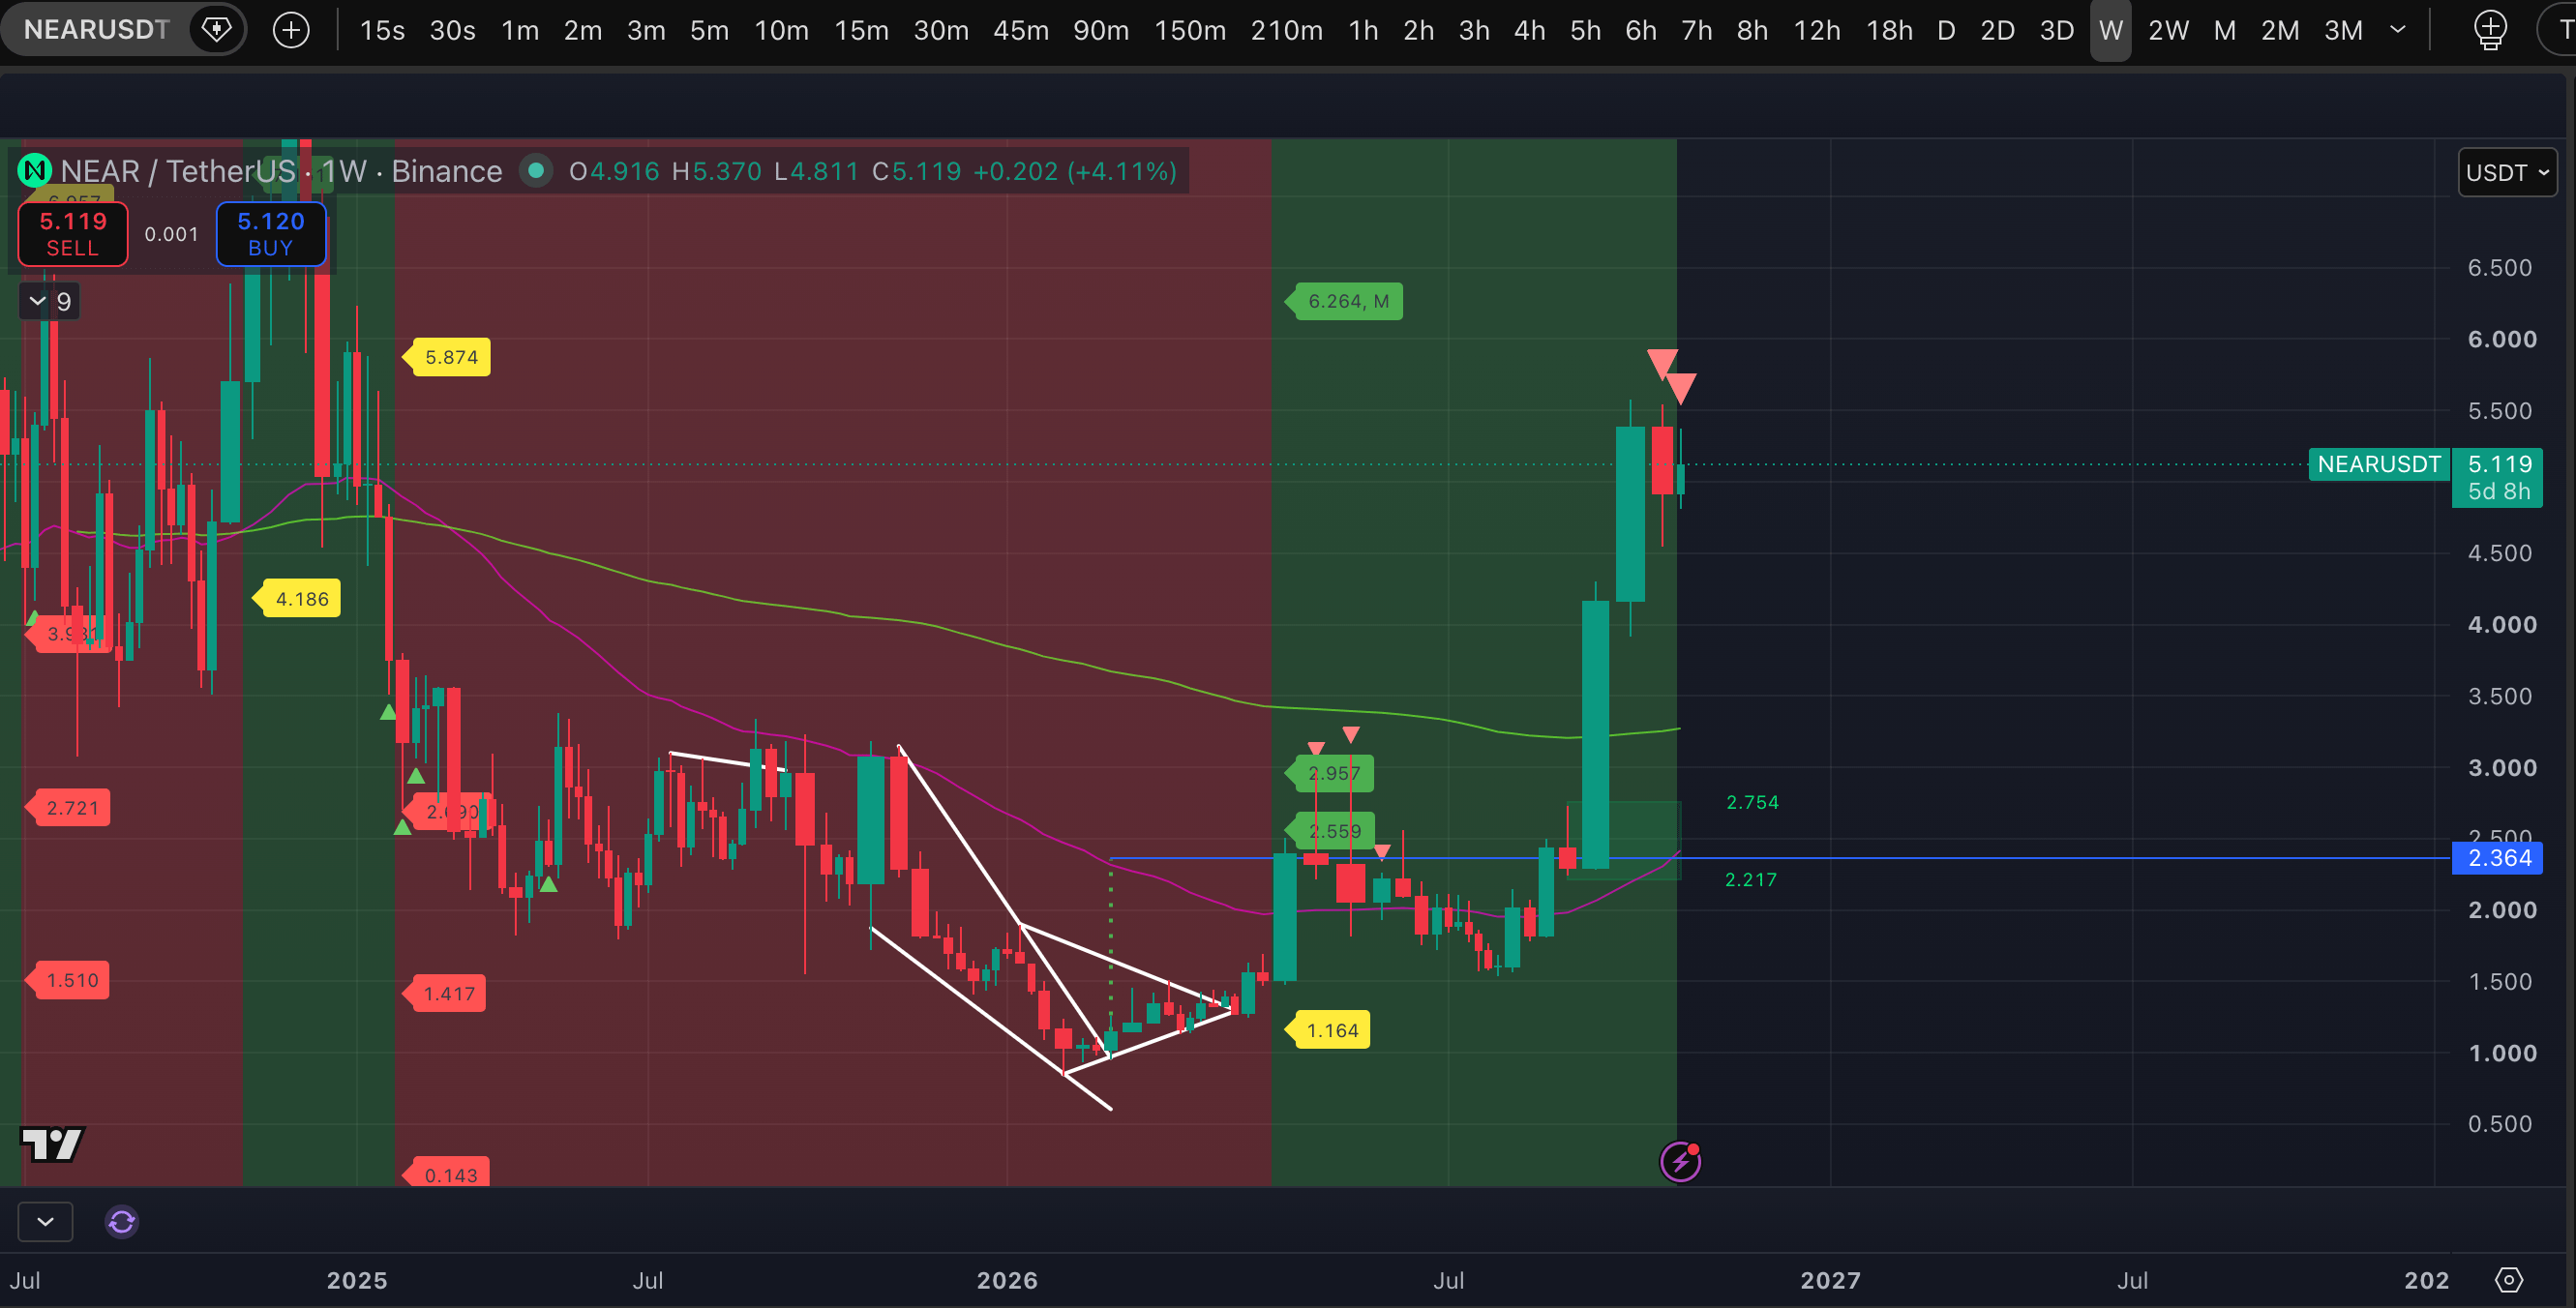
On the weekly candle that opened yesterday, three assets from the TOP-200 showed a Strong signal of a potential high. All of them had already received this label last week. They are #DRV, #MINA, and #NEAR.
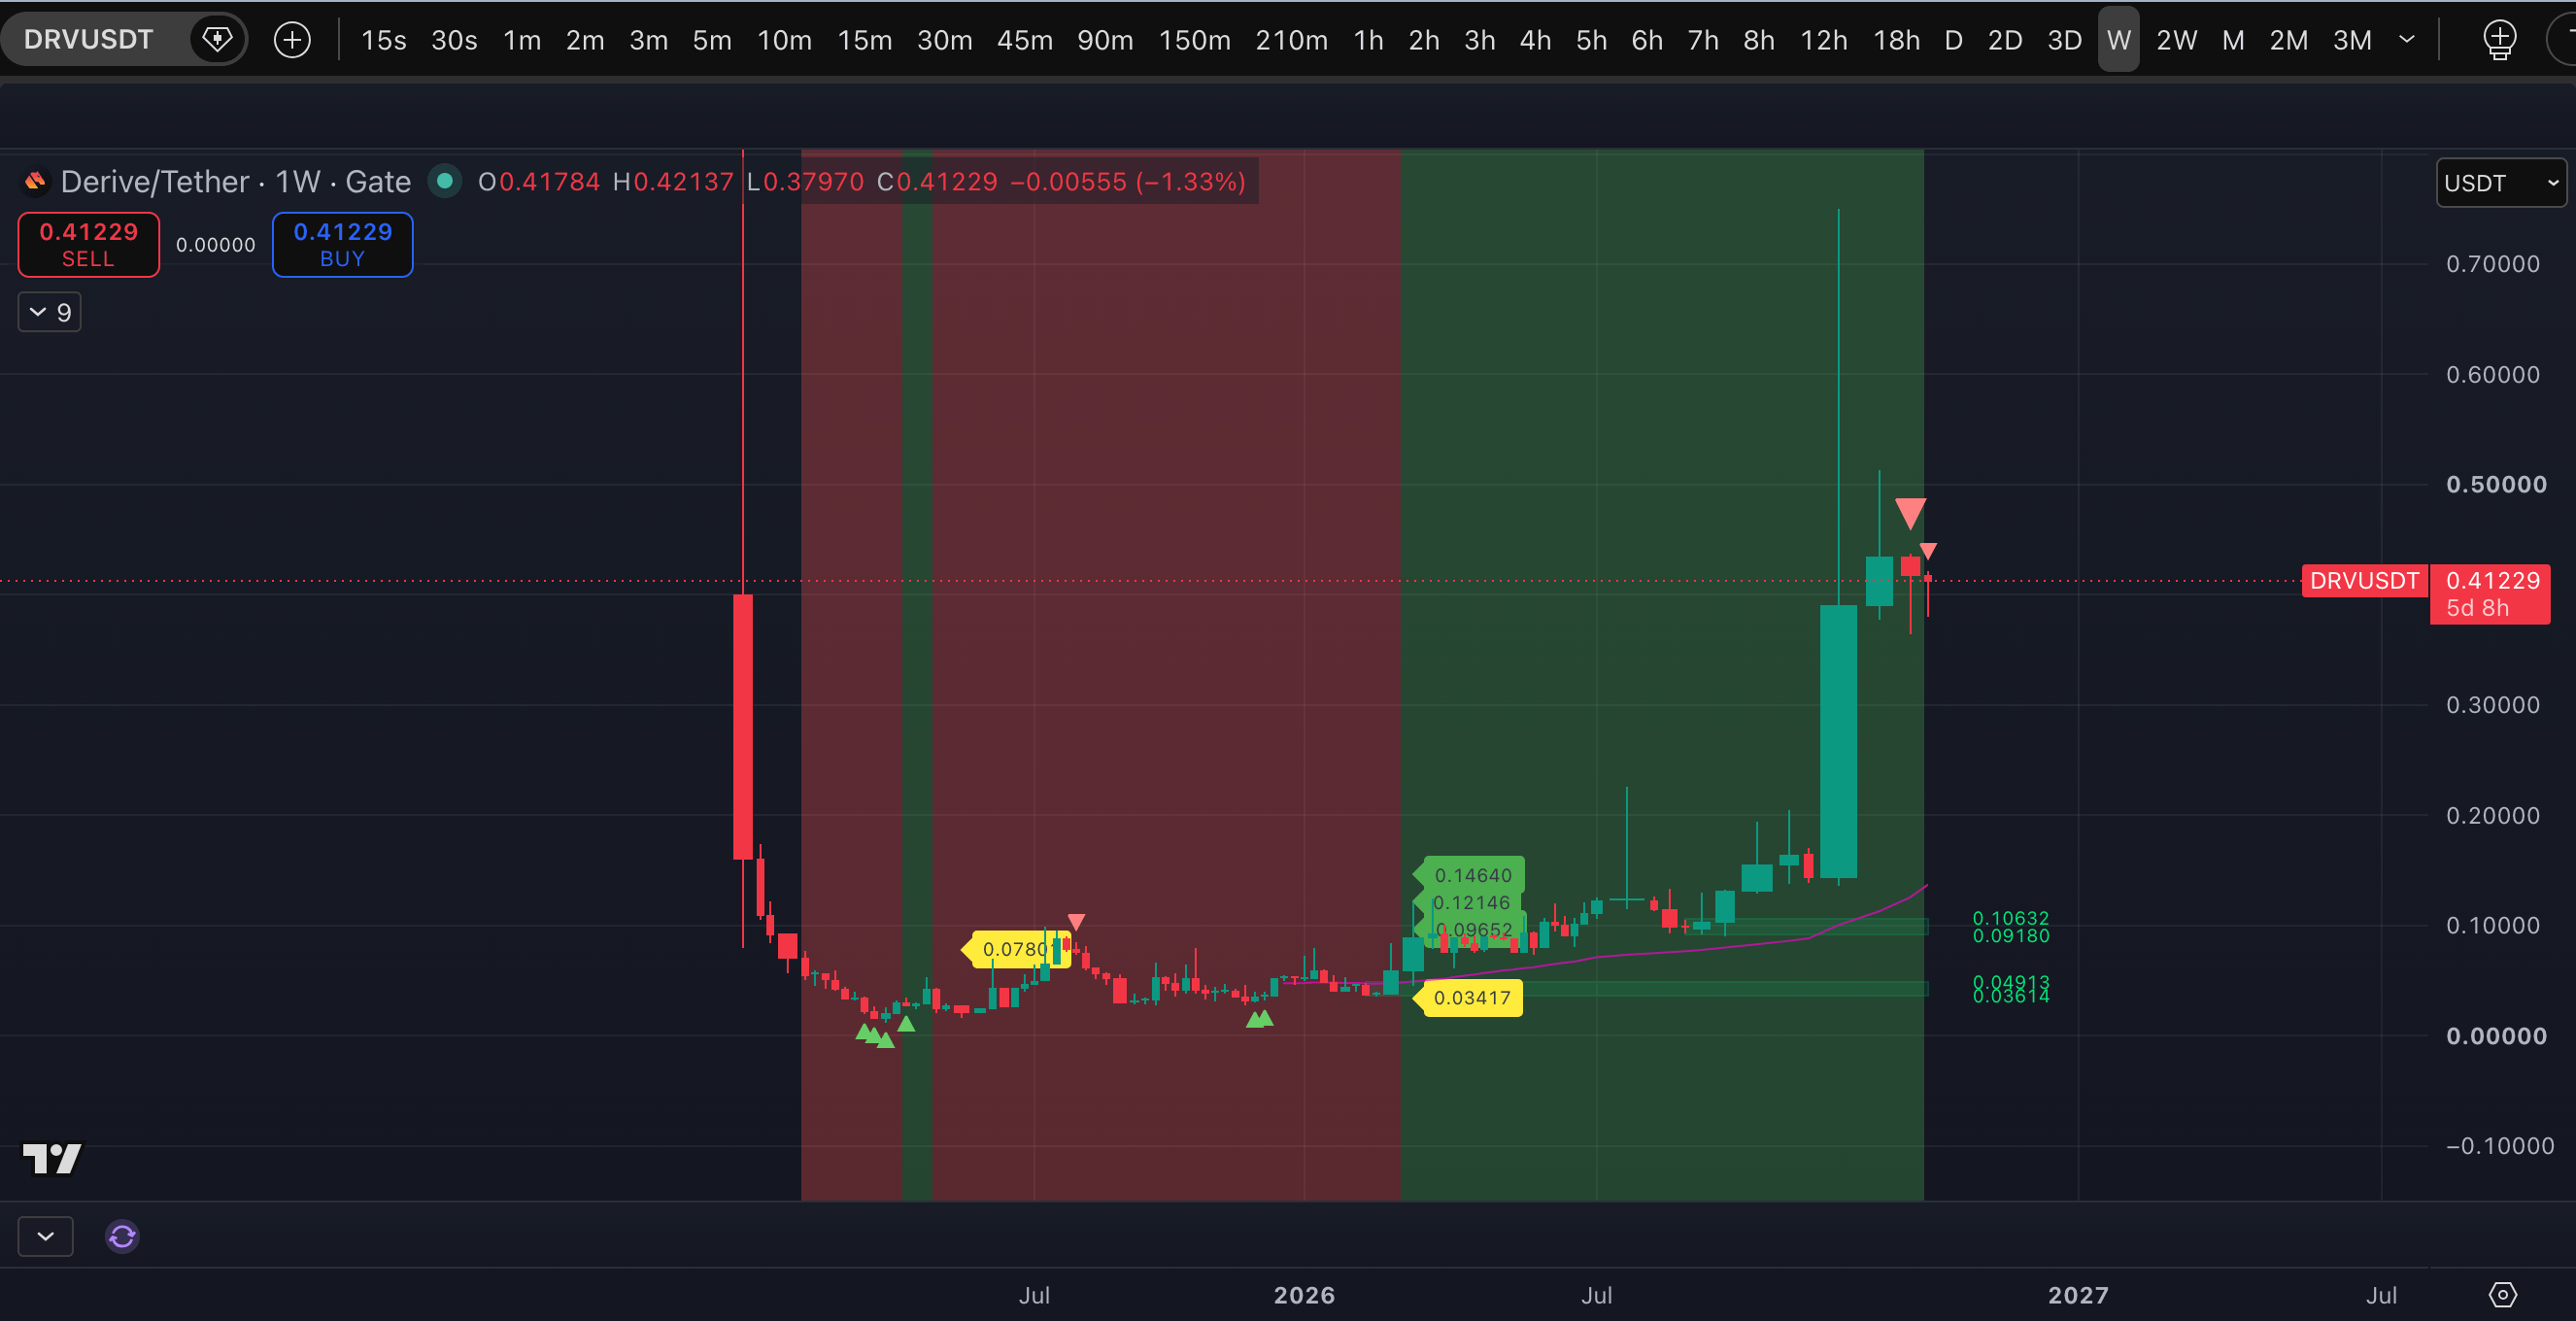
For DRV, though, the label has since become ordinary. But that doesn't change the fact that last week's label was confirmed as Strong. Another three assets showed ordinary potential-high labels this week; the list is available to Monitor subscribers.
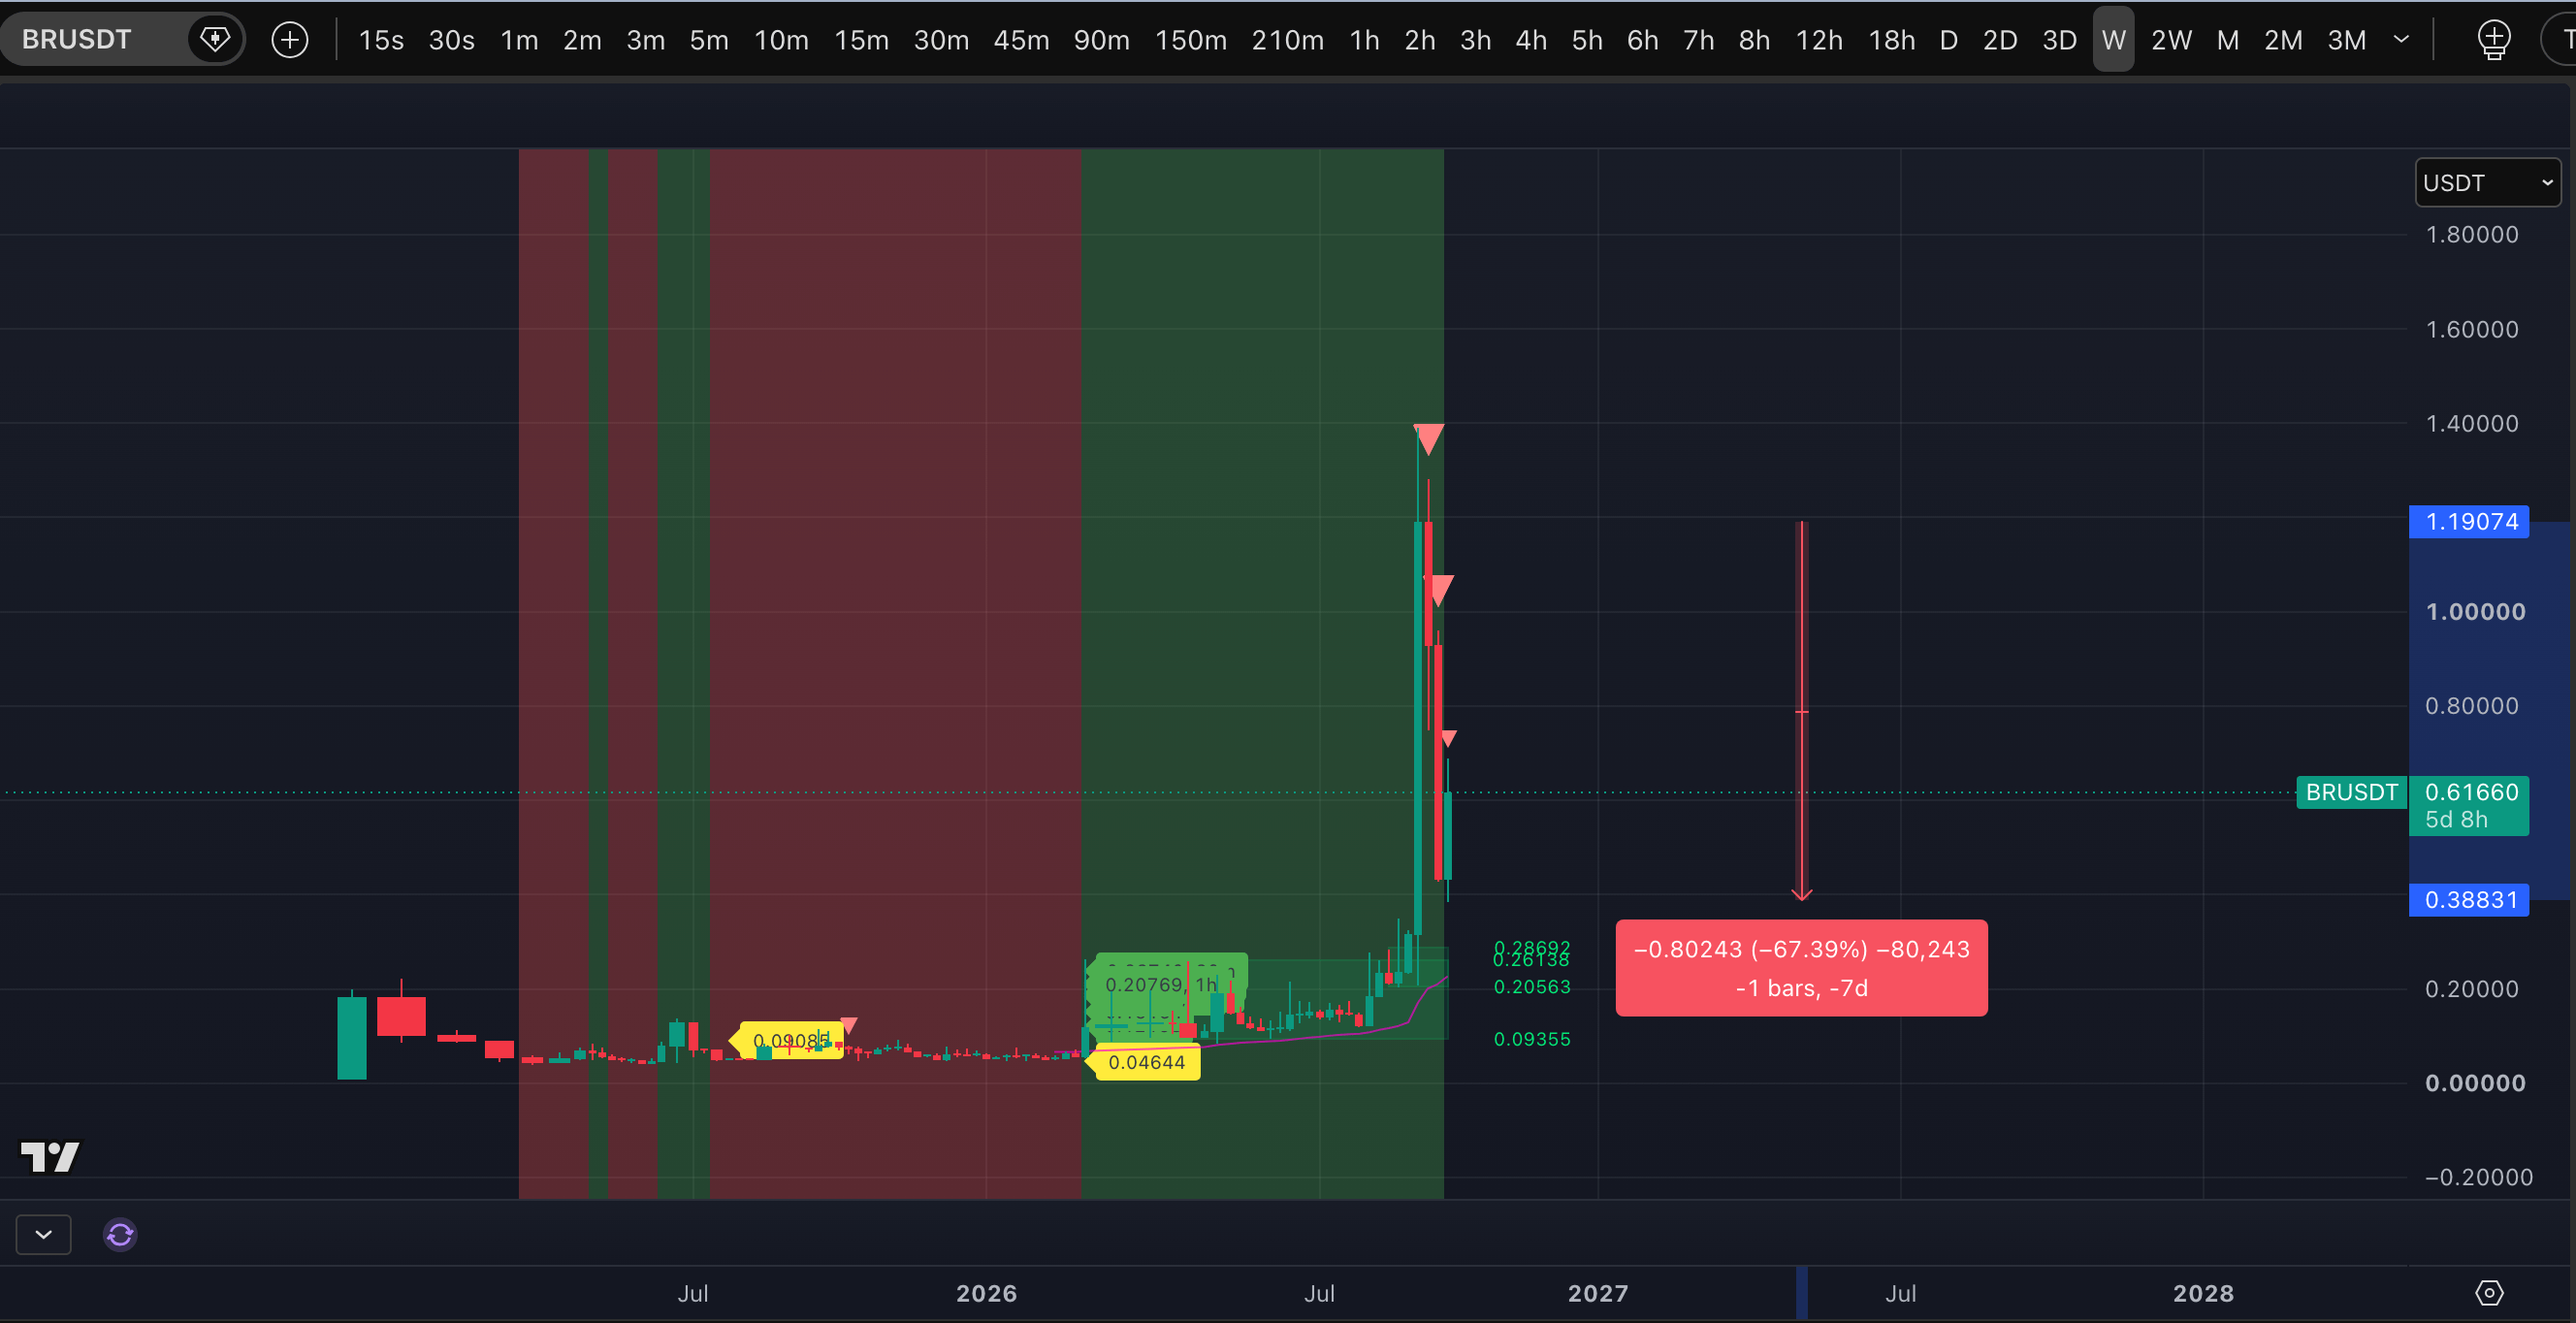
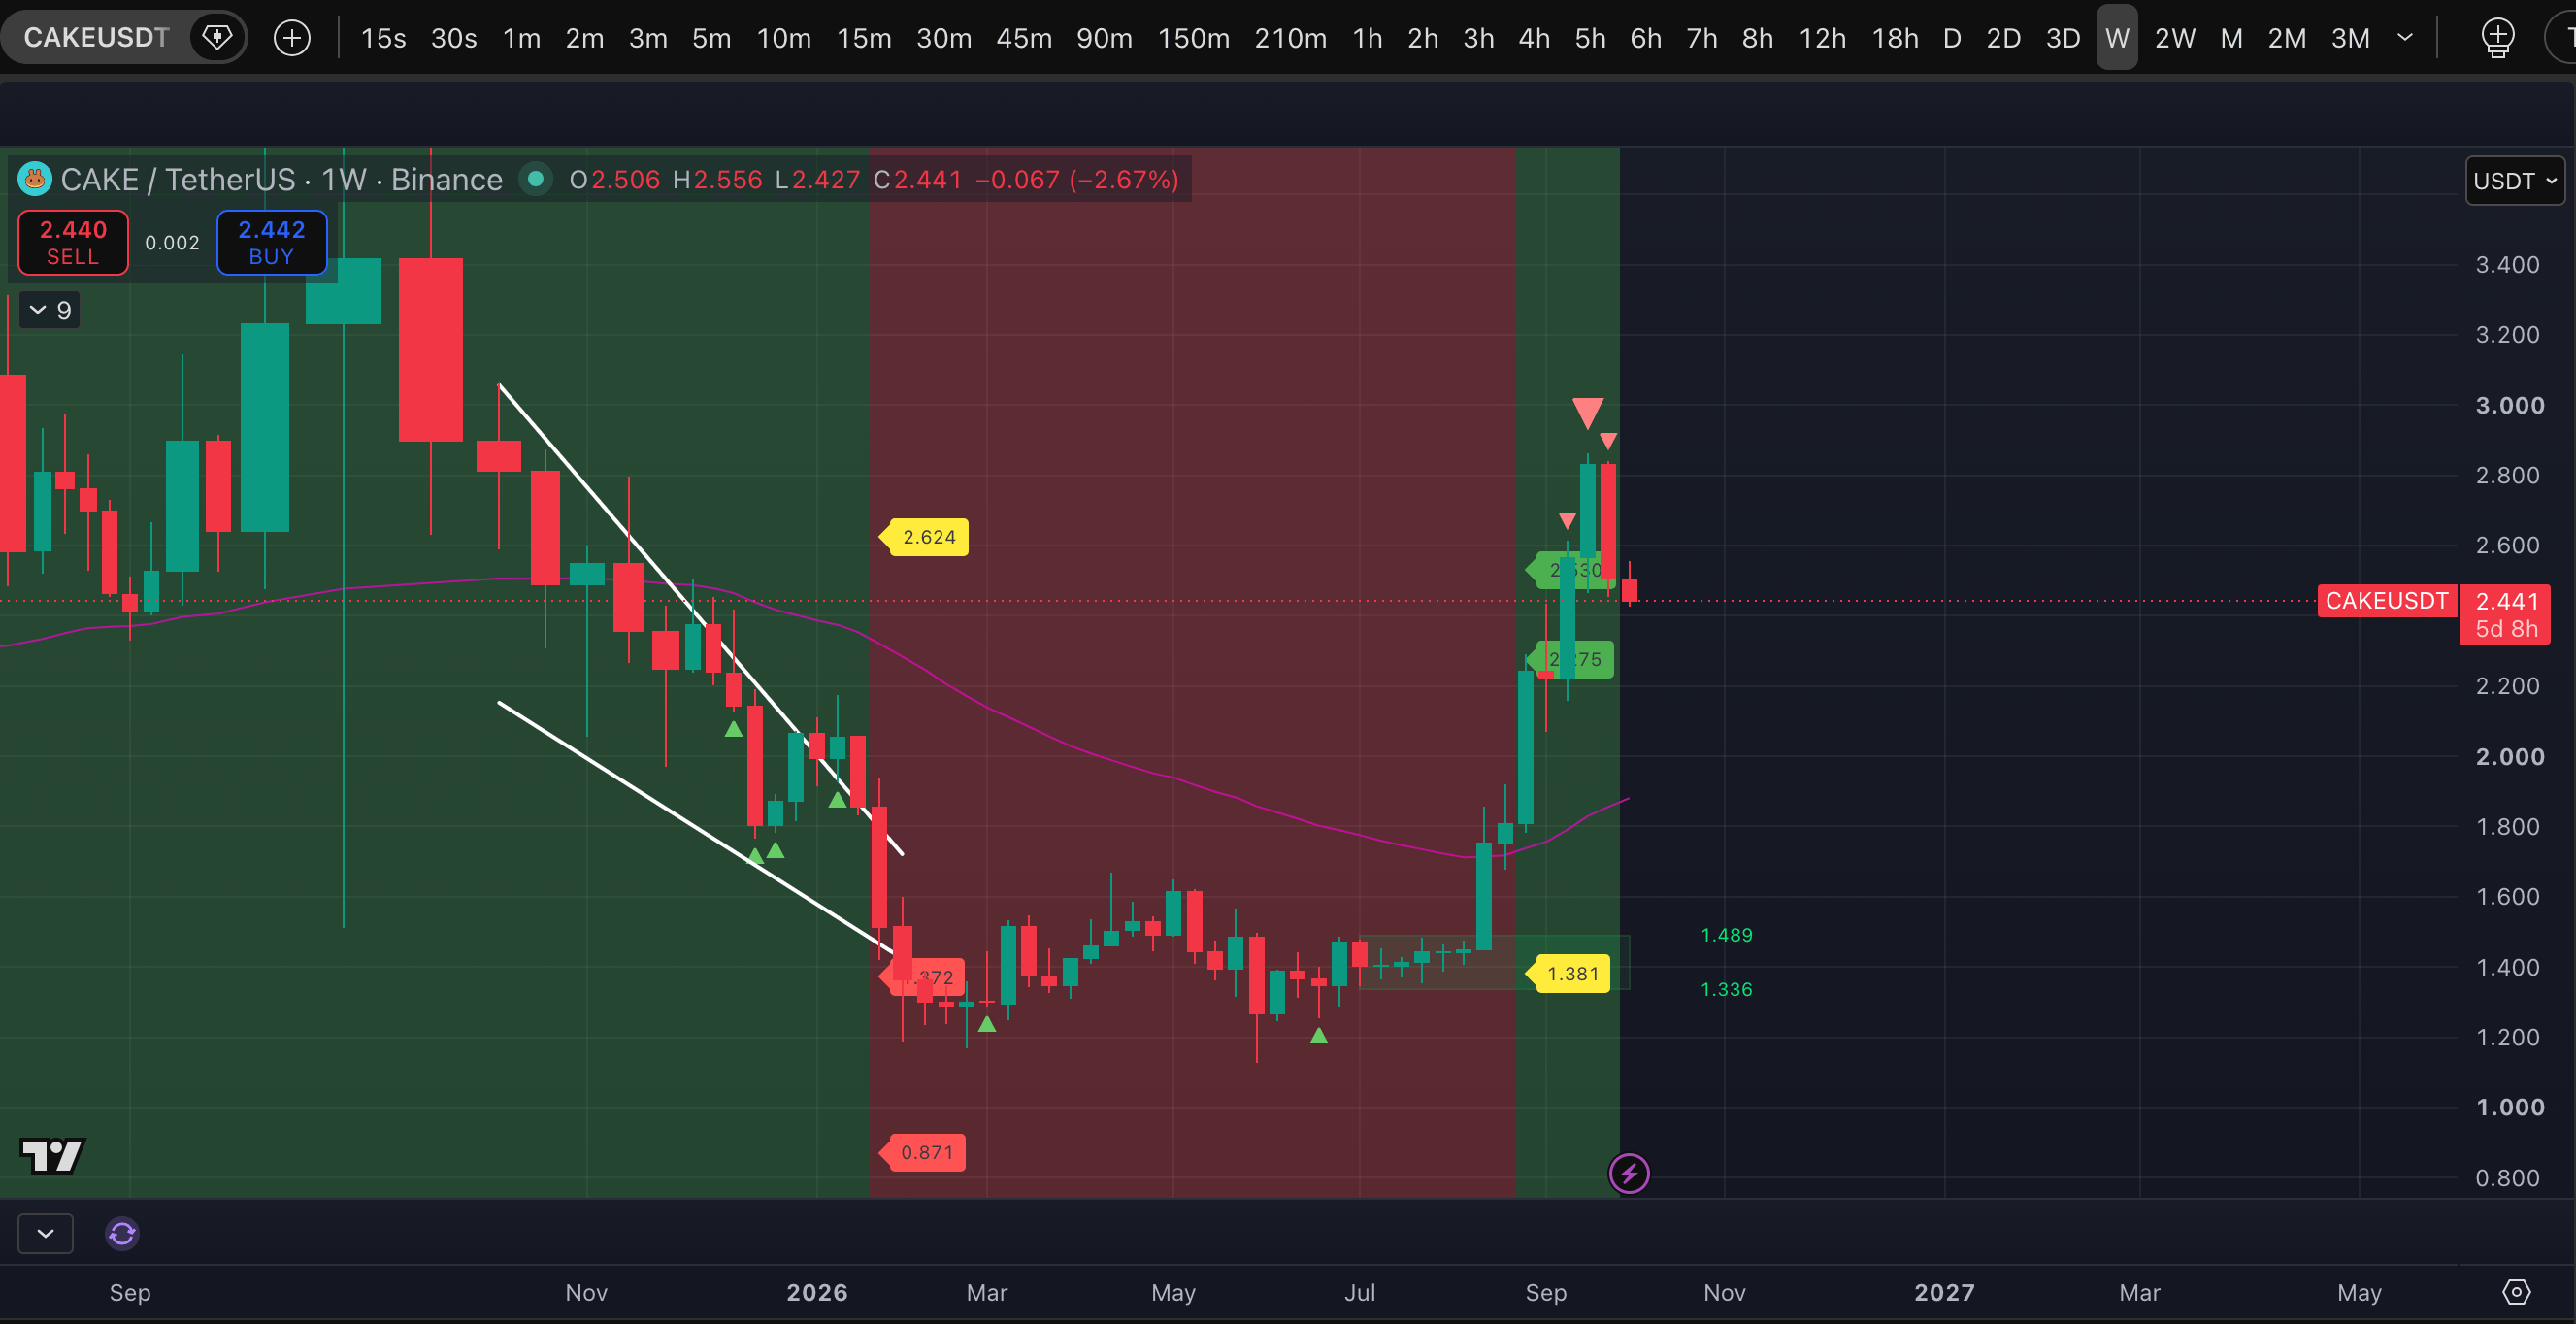
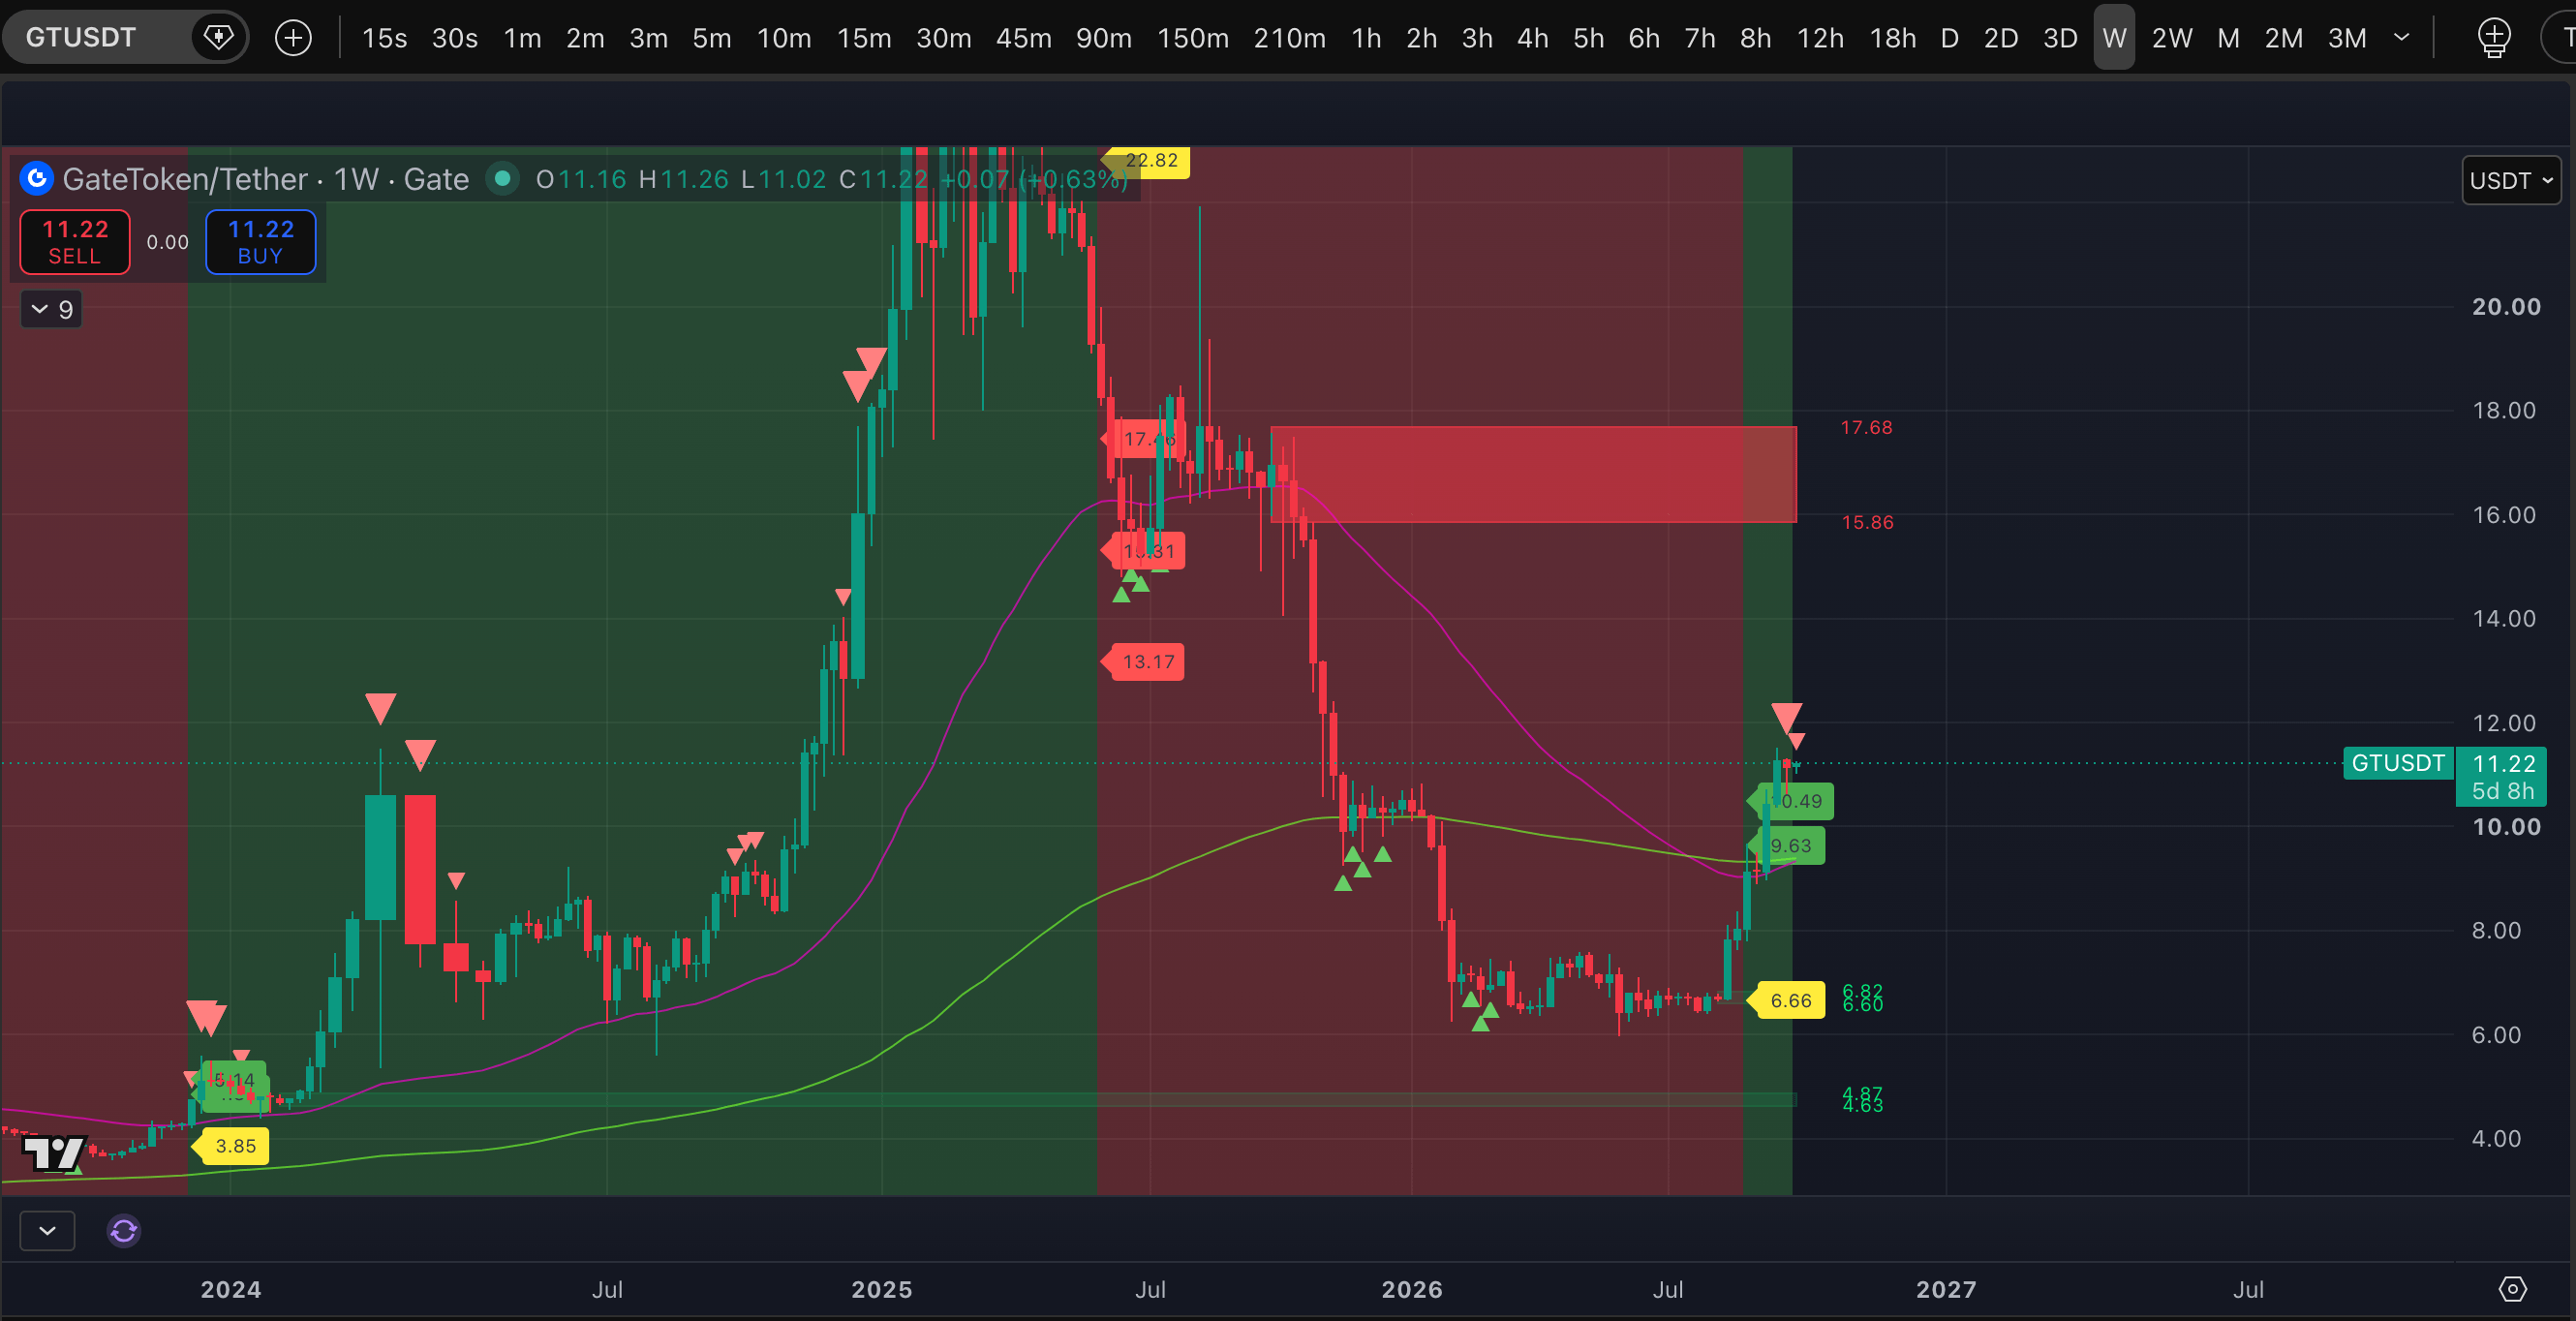
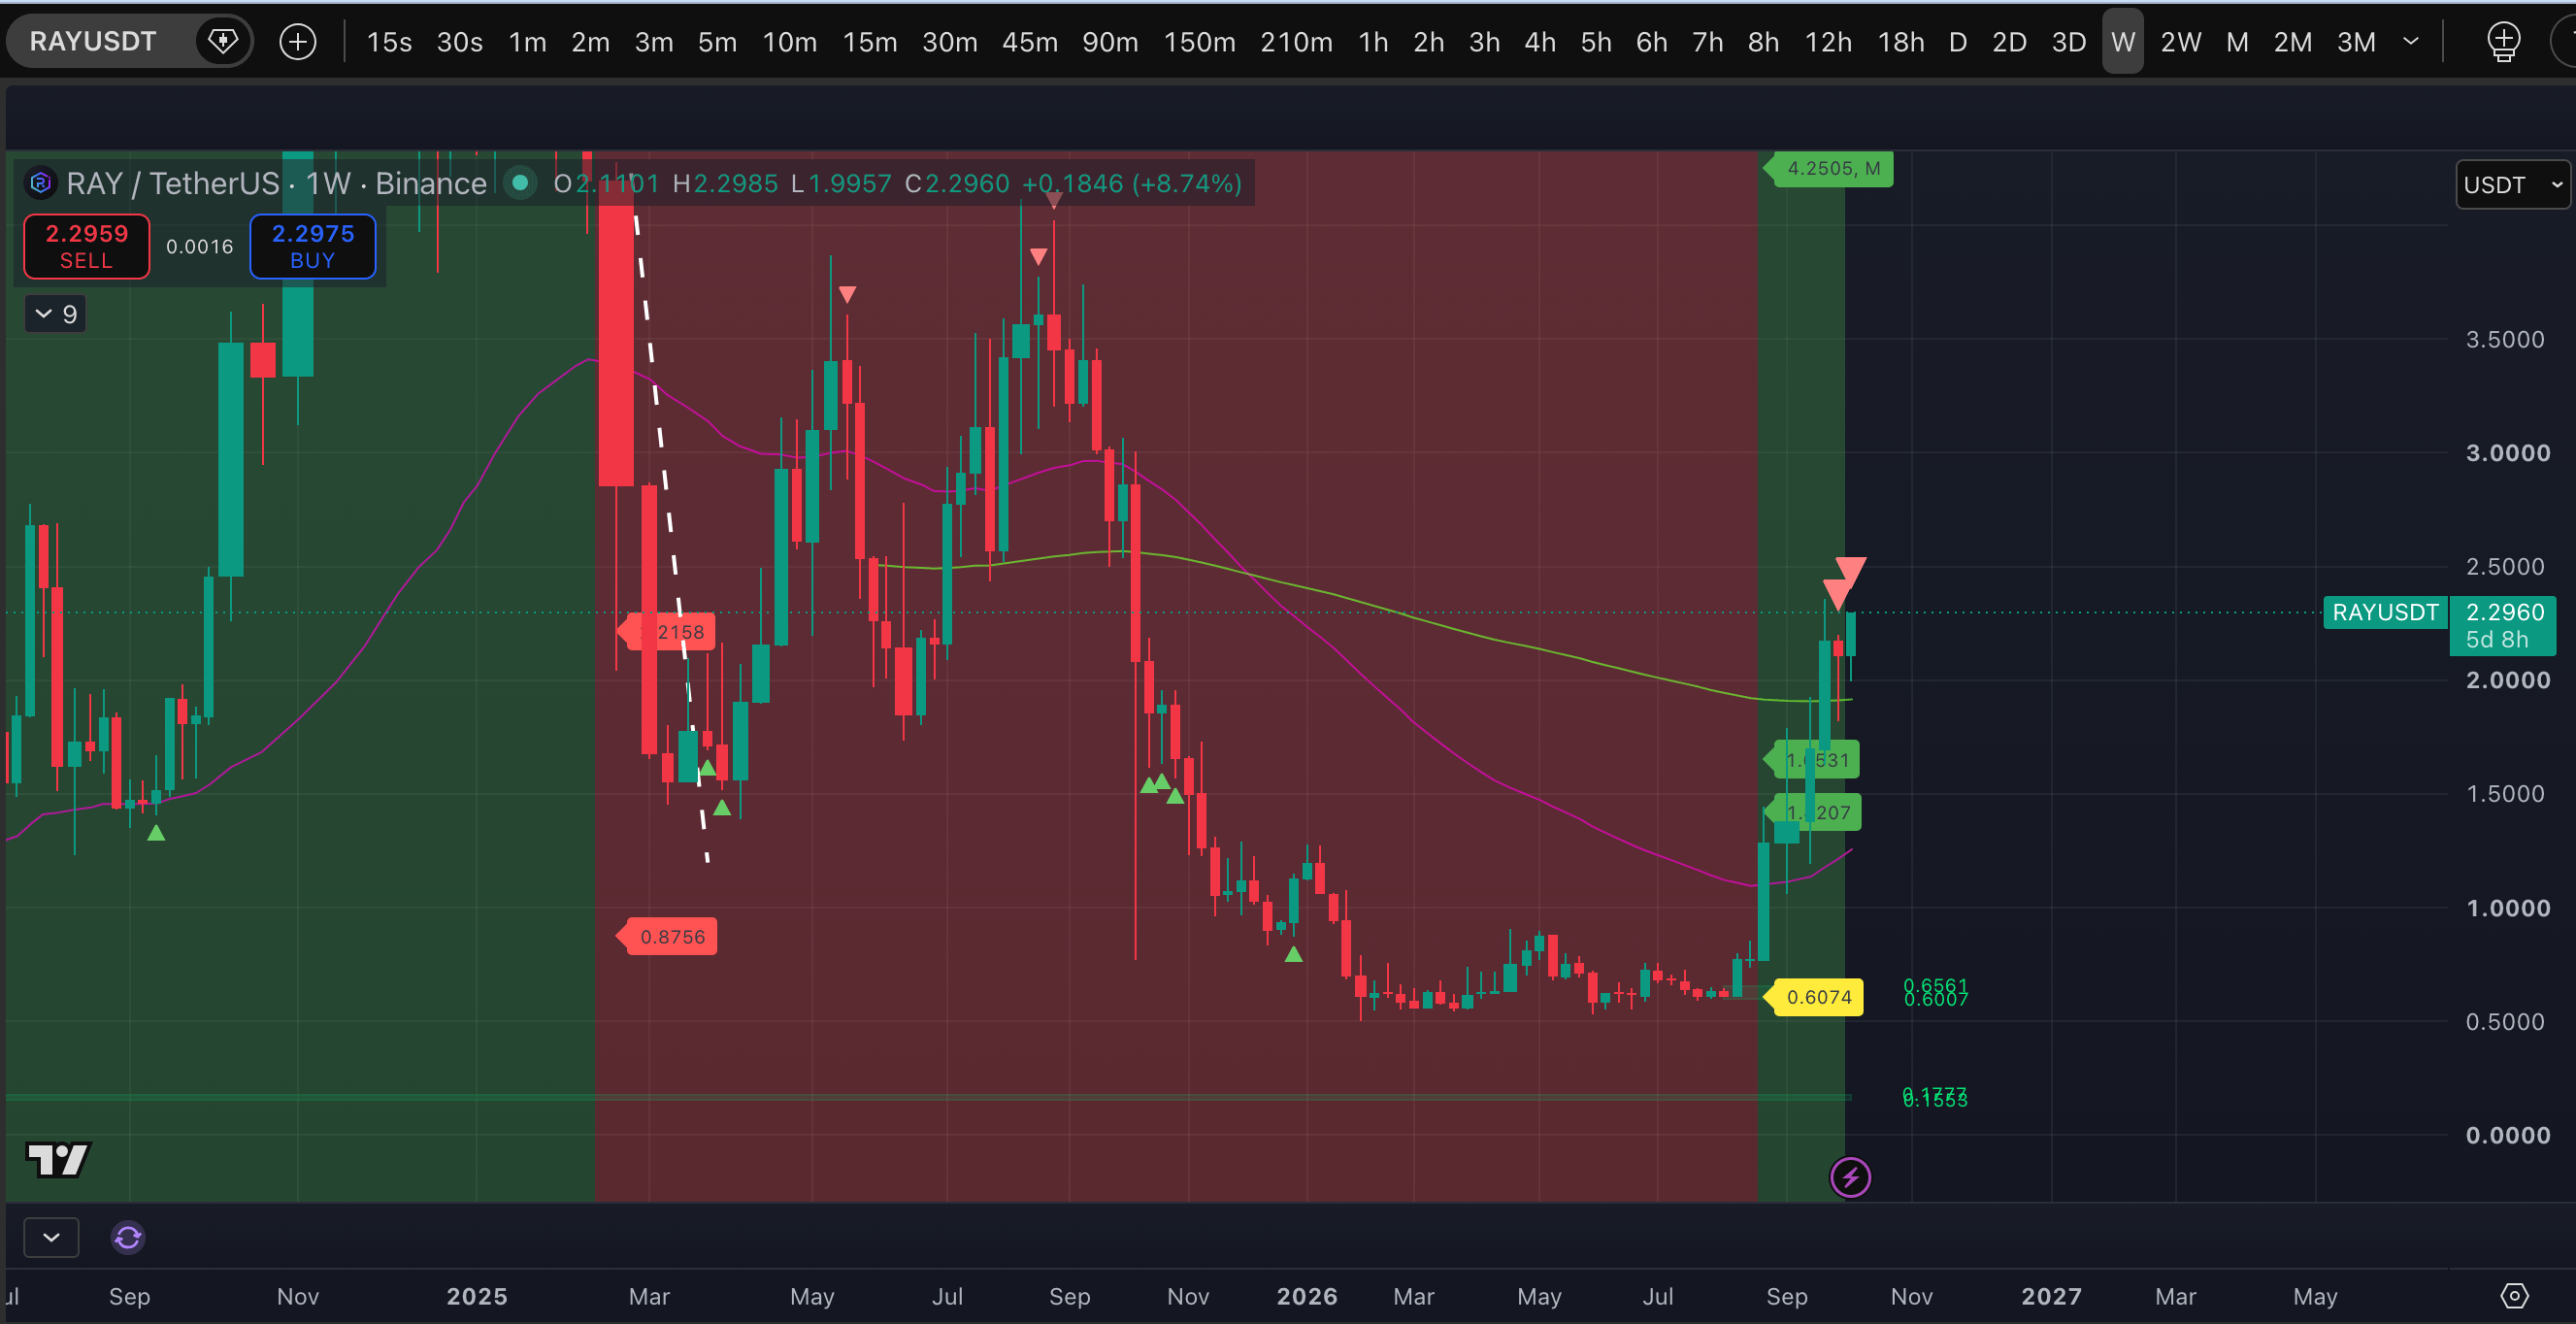
As a reminder, last week 9 assets in the TOP 200 received this mark: the three already mentioned, as well as #BR, #CAKE, #GT, #RAY, #UNI, and #ZEC.
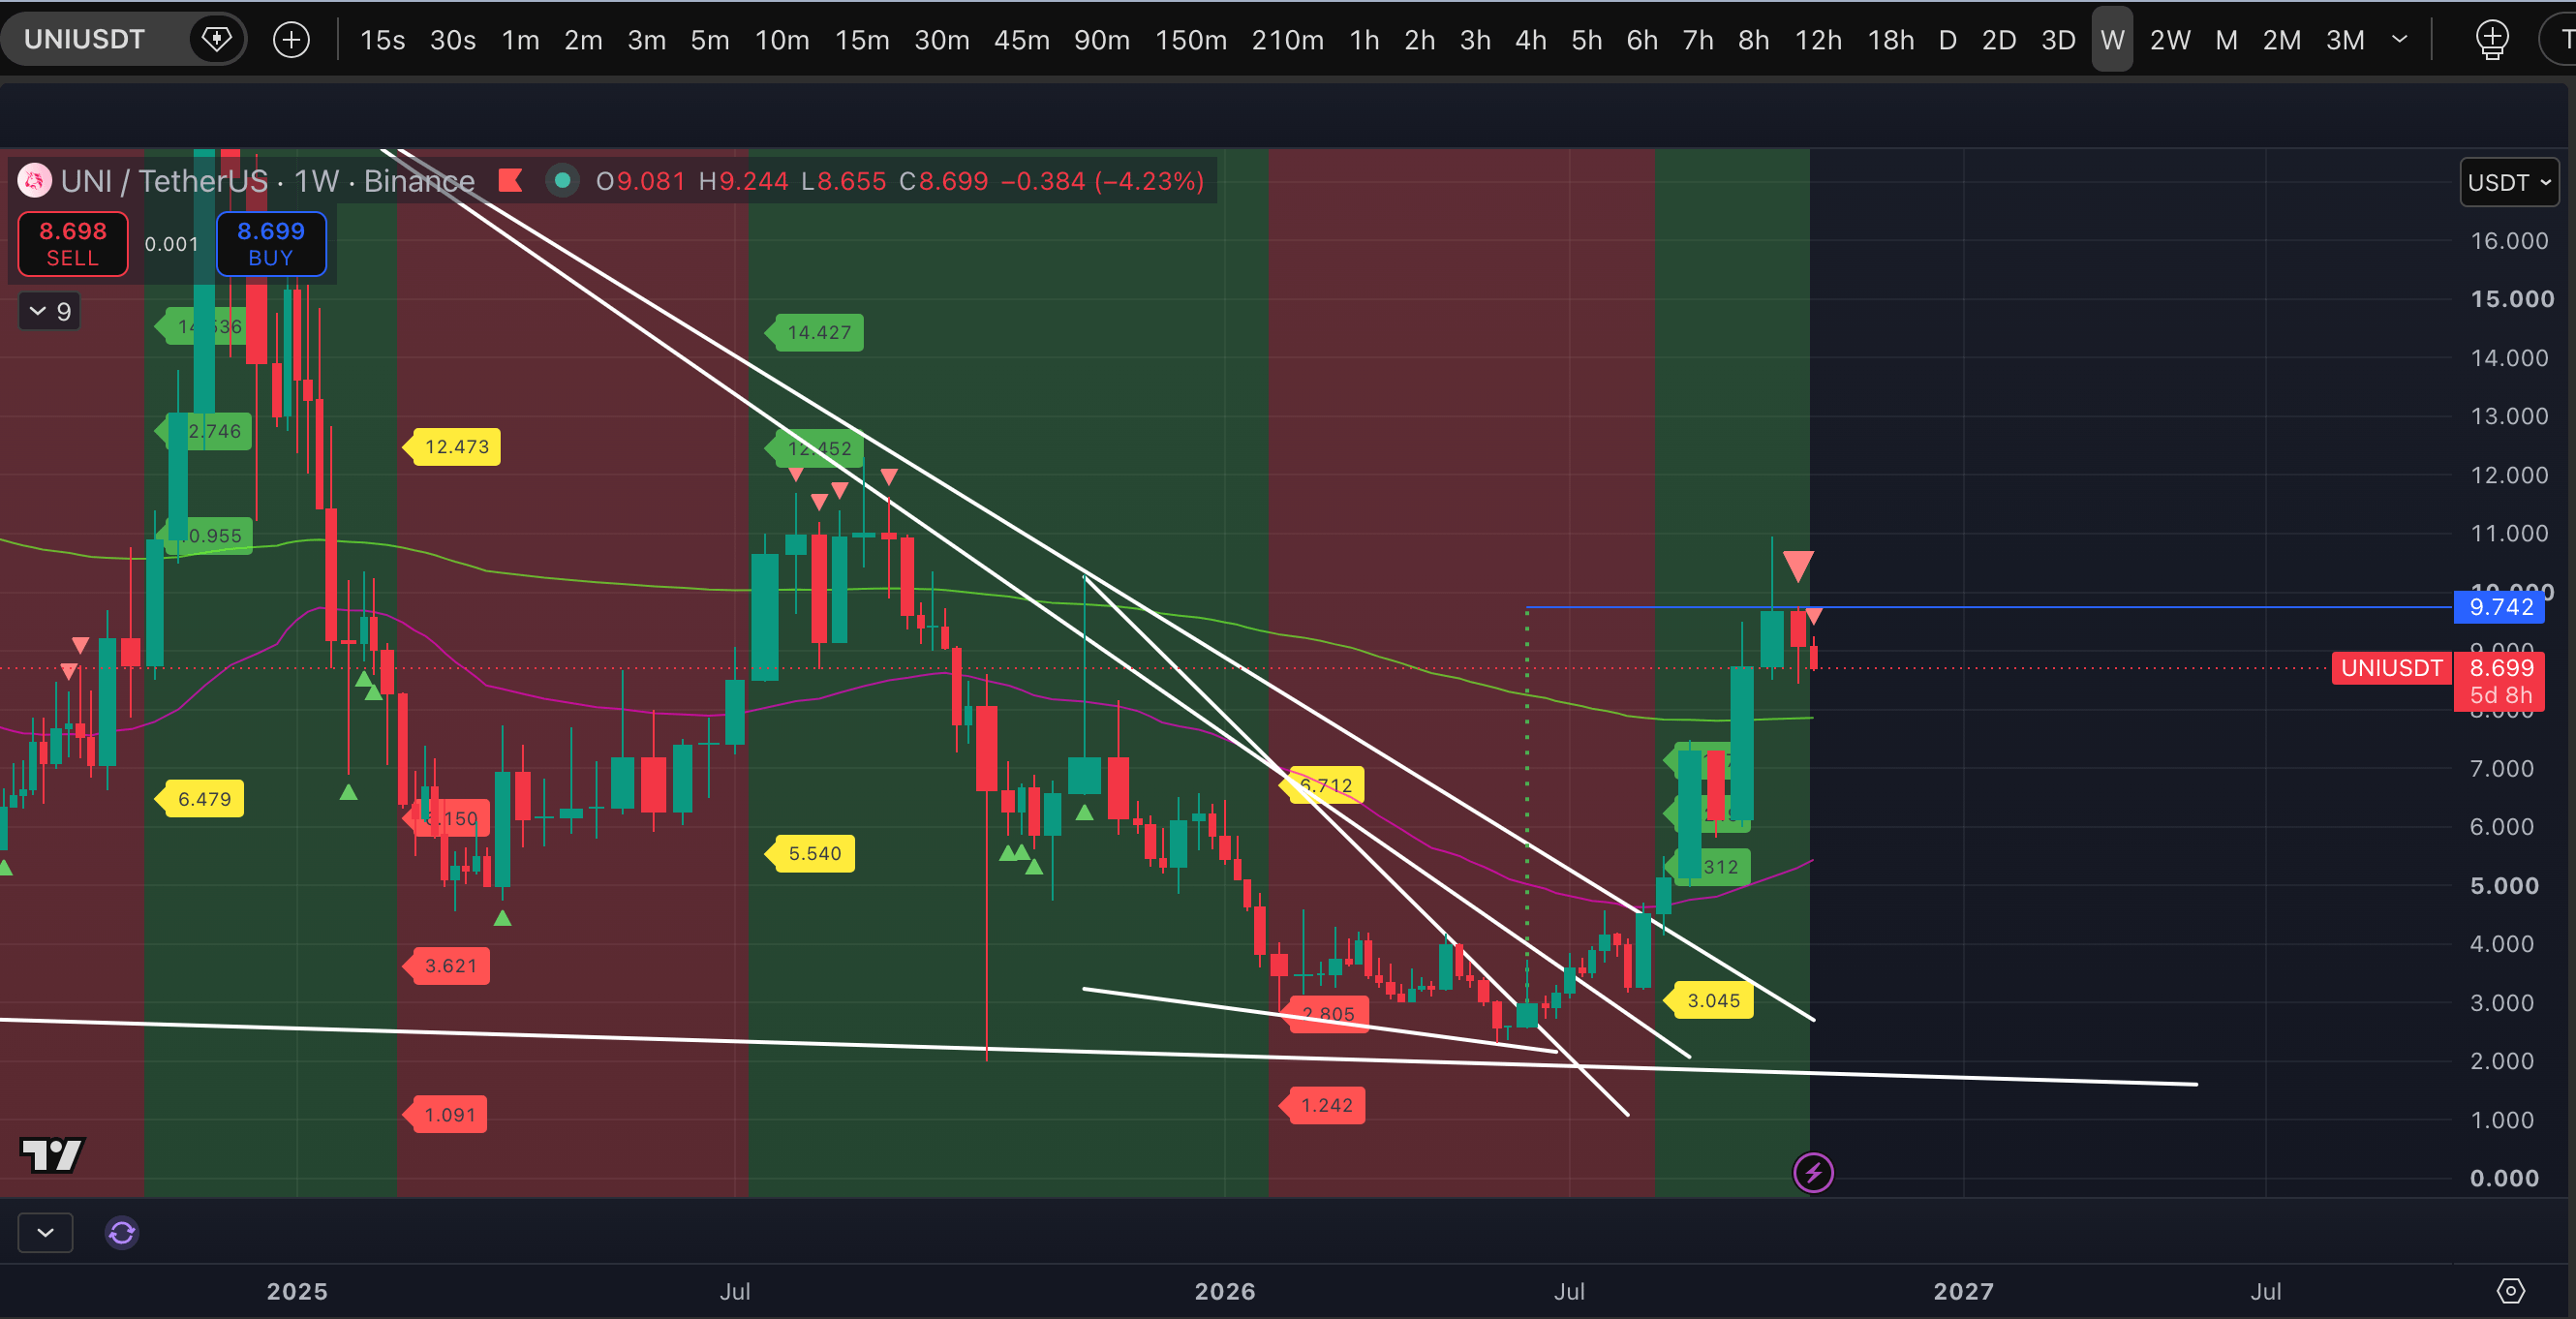
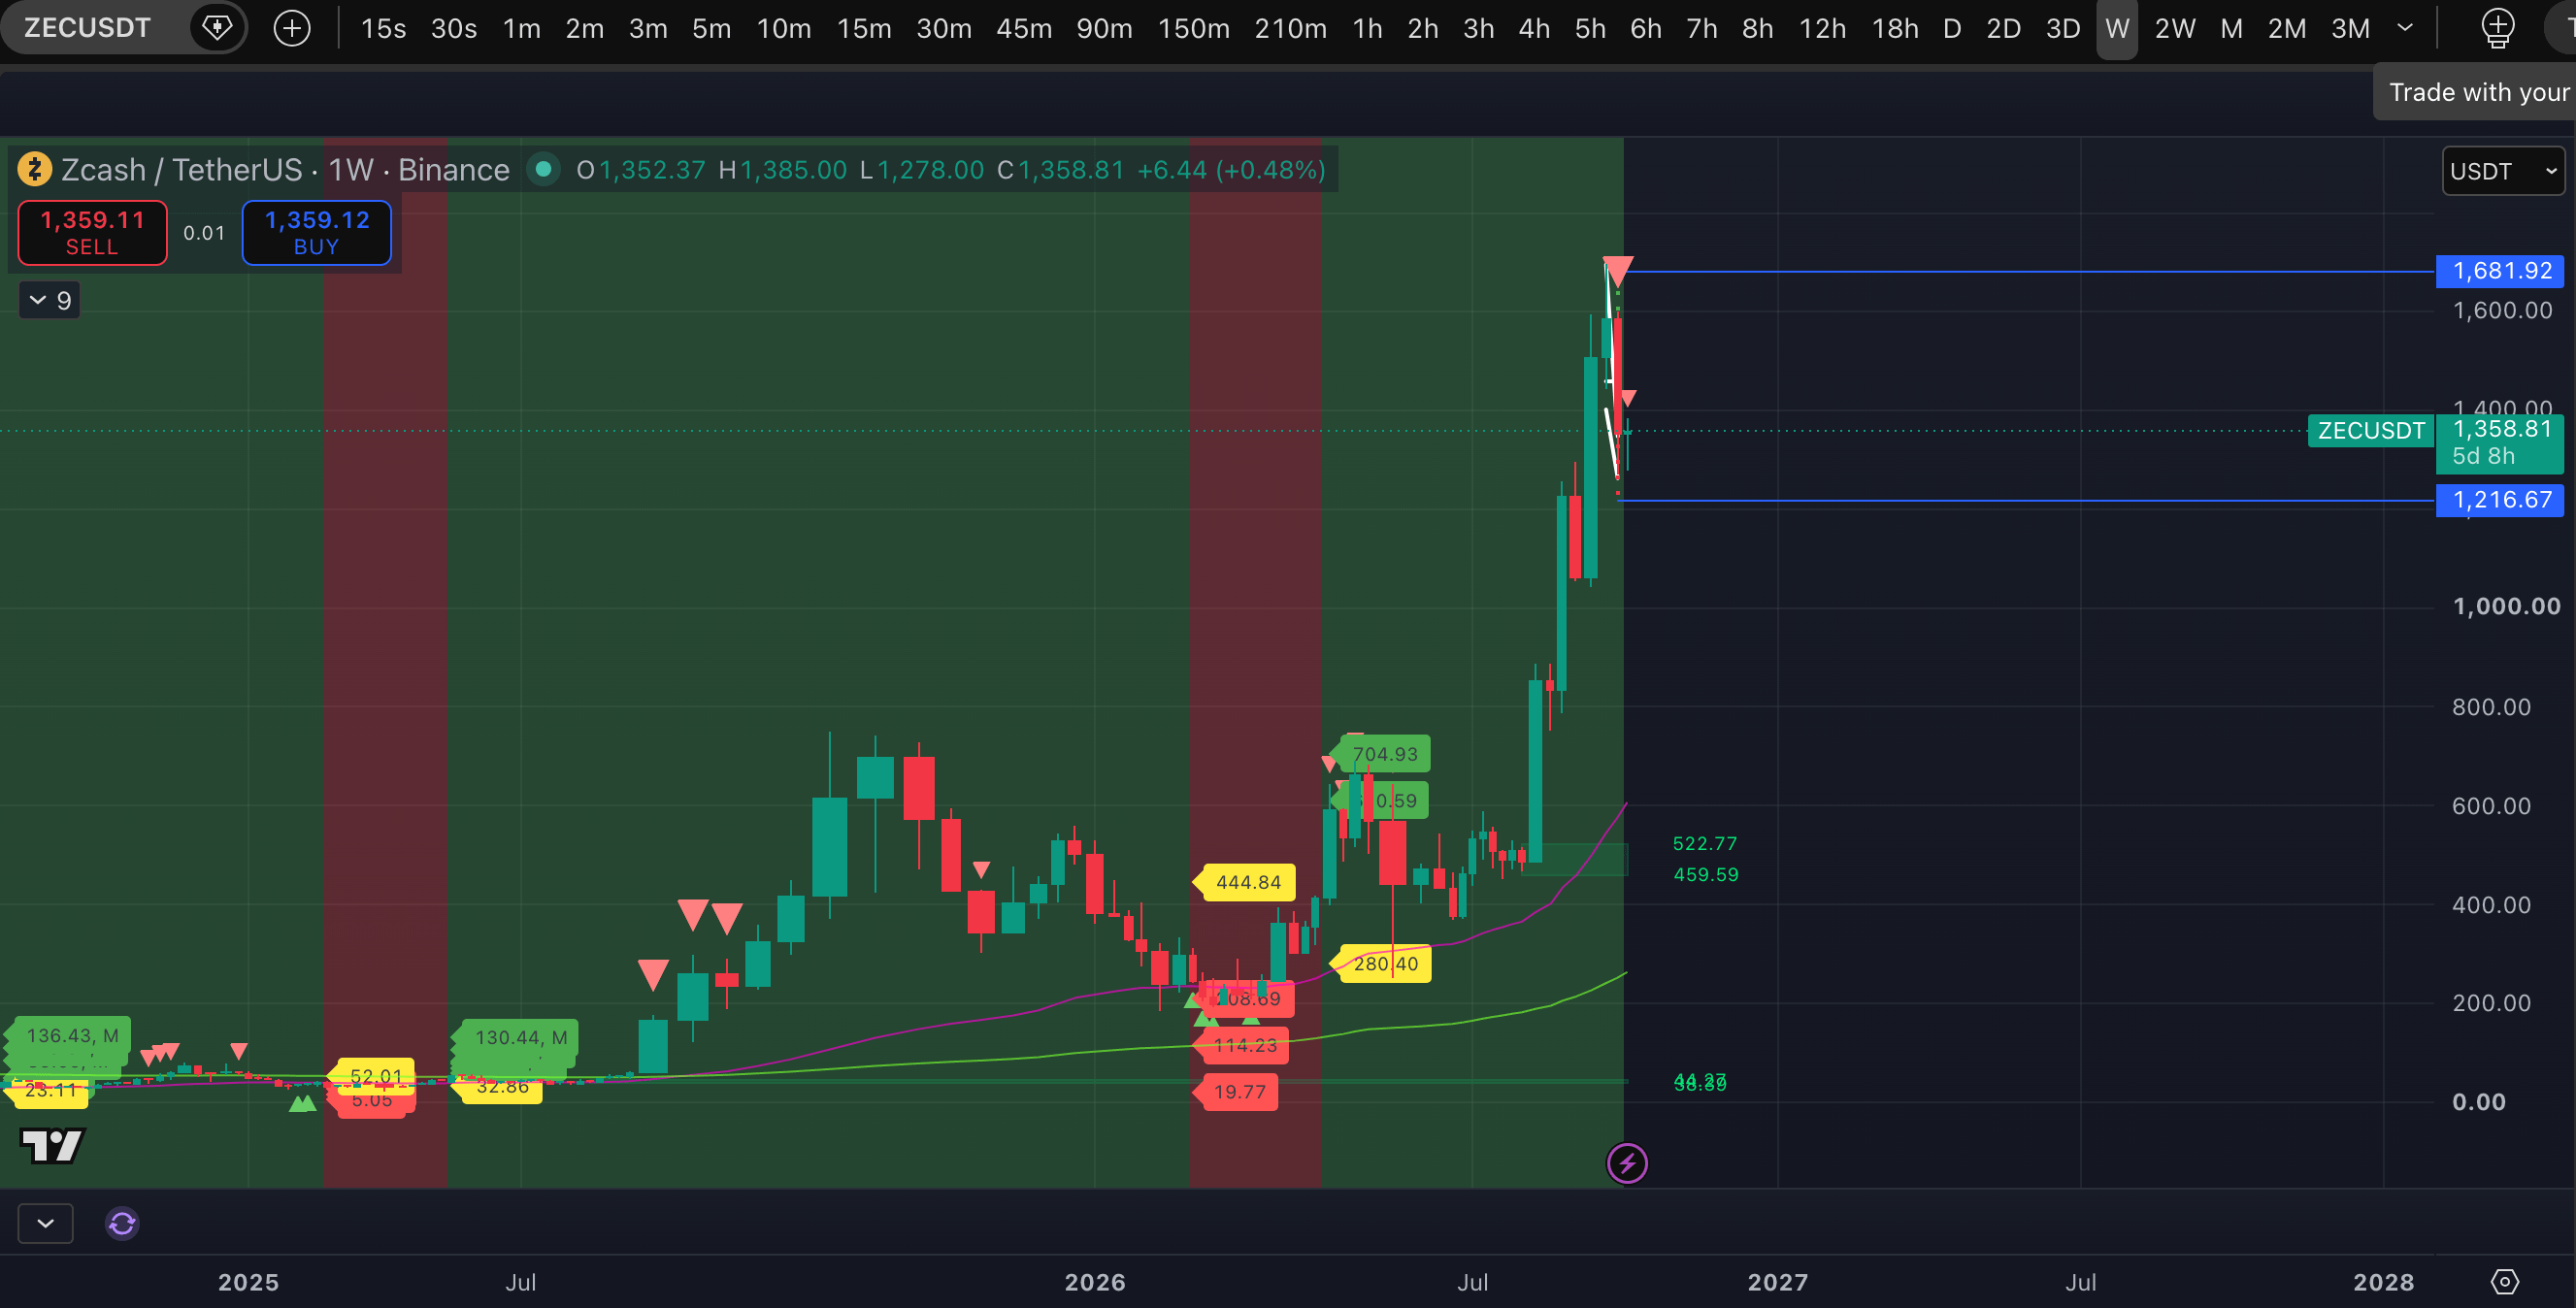
At the same time, 41 assets in the TOP 200, including BTC and SOL, showed ordinary potential-high marks. And on the night of October 3–4, 23 assets in the TOP 200 showed a potential-high mark on the 3-day timeframe.
All of this leads us to expect the autumn correction to begin this fall, likely as soon as October. We’ve written about this many times, and these expectations remain valid. For the near term, we’re leaving room for prices to maneuver in the form of a short squeeze.
Among the assets listed with a Strong signal at the weekly timeframe highs, it’s already clear that some of them have started to play out. The indicator clearly showed strong marks at the highs, after which an active correction began in MINA, NEAR, CAKE, UNI, and ZEC. Signals for GT and RAY are still waiting to play out. BR was the first to show Strong signal marks, back on September 21, and since then the price has corrected by -67% in net movement. The signals played out perfectly!
As the screenshots show, all the assets are in a steady uptrend on the weekly timeframe, making them interesting buys. If a correction develops, we believe the most advantageous entries would be at extremes—marks indicating a potential low on the 12-hour, daily, 3-day, or weekly timeframe, or even a Strong signal low on lower timeframes. You can also pay attention to support levels—liquidity zones and the 50 and 200 EMAs—on timeframes of 12 hours and above.
It’s worth noting separately that a Strong signal for a potential high is an extremely powerful signal that an uptrend is ending. If sellers’ strength is confirmed (a downtrend on the 3-hour timeframe), you can generally expect either a long range in a new price band (which would be the best-case scenario), a full-fledged correction of the pump lasting months, or a rapid, sharp dump that “shakes out” the most impressionable passengers.
One thing is certain: these marks are definitely a bad time to buy. But they are a preview of what lies ahead—“discounts.”