Daily Market Analysis — BTC
Compared with yesterday’s price action, BTC’s structure across timeframes has changed very little. The higher timeframes are still moving sideways within the right-shoulder range of the “golden pit,” while the lower timeframes are also consolidating within a bullish range structure.
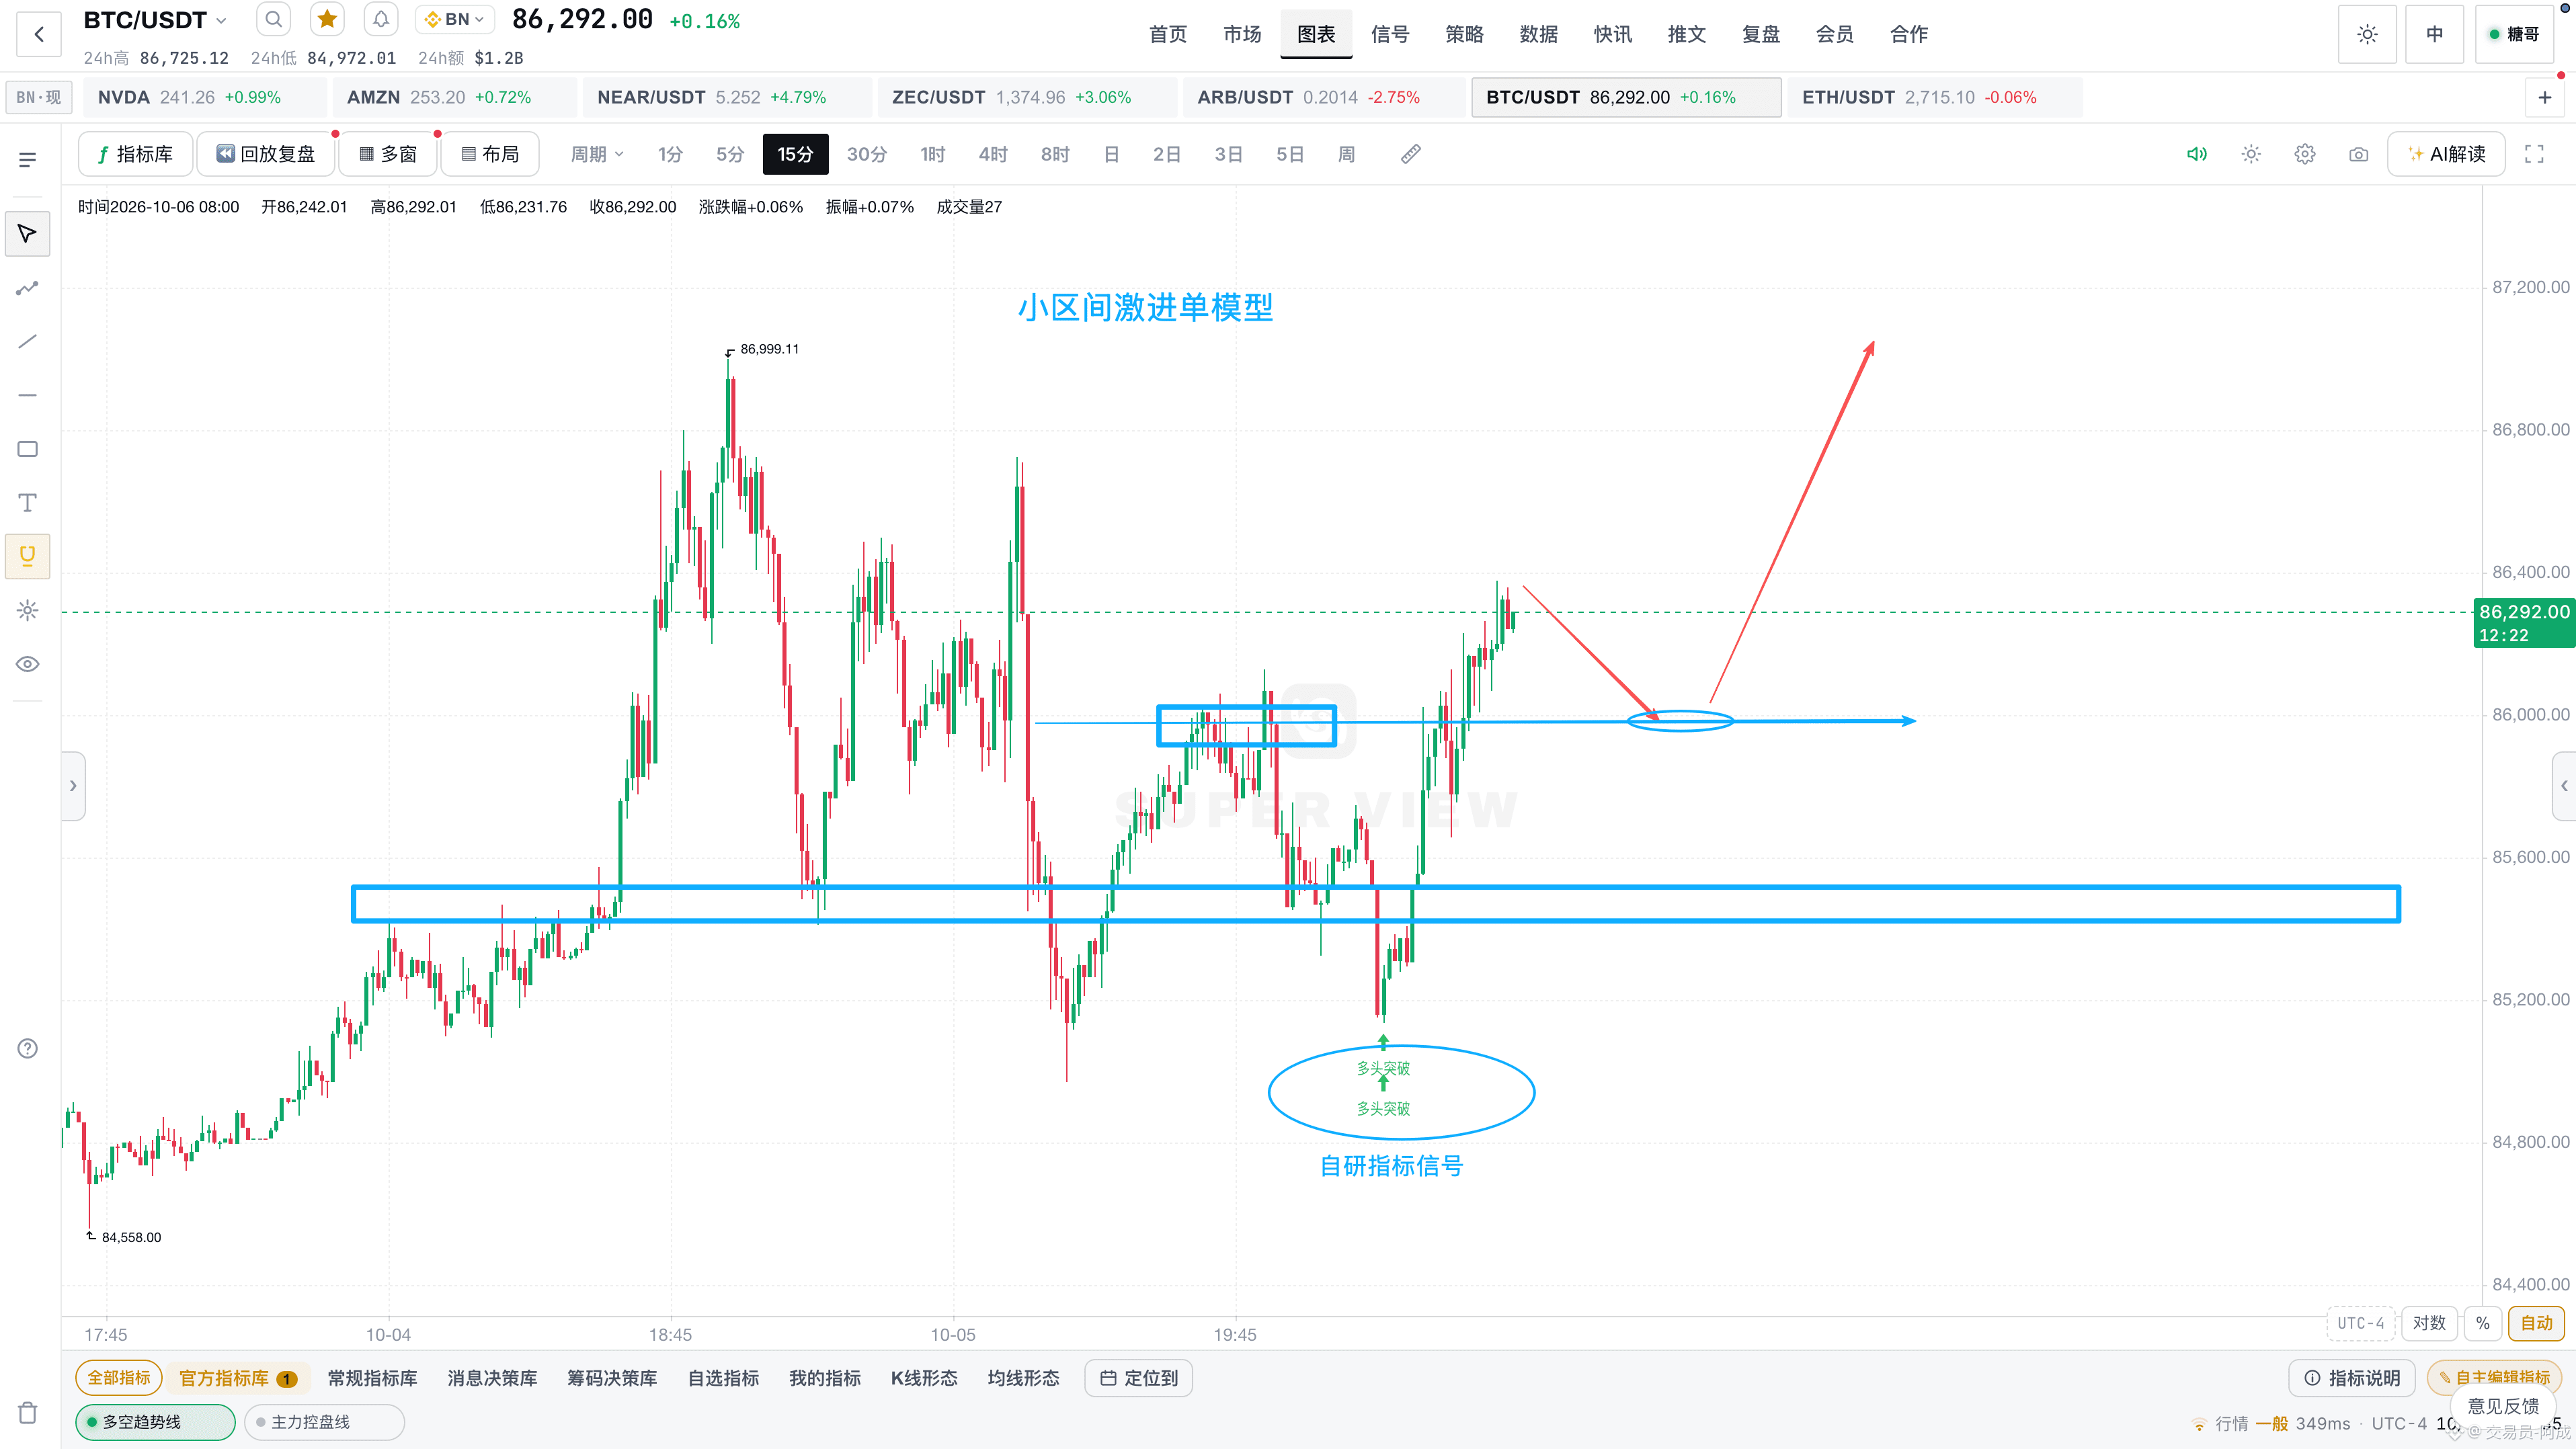
Under current conditions, live traders should watch for a potential shift in direction as the lower timeframes continue to build up during sideways movement. If a shift in structure occurs on the lower timeframes, the initial highs and lows are still likely to be bounded by the upper and lower edges of the higher-timeframe range.
High-risk, aggressive trade (purely speculative; you can skip it): Enter at a 1:2 ratio in the 86285–85220 area at the current price; stop loss at 84910 (1H candle body); take-profit reference: 871–882 (ideally, take profits while you can).
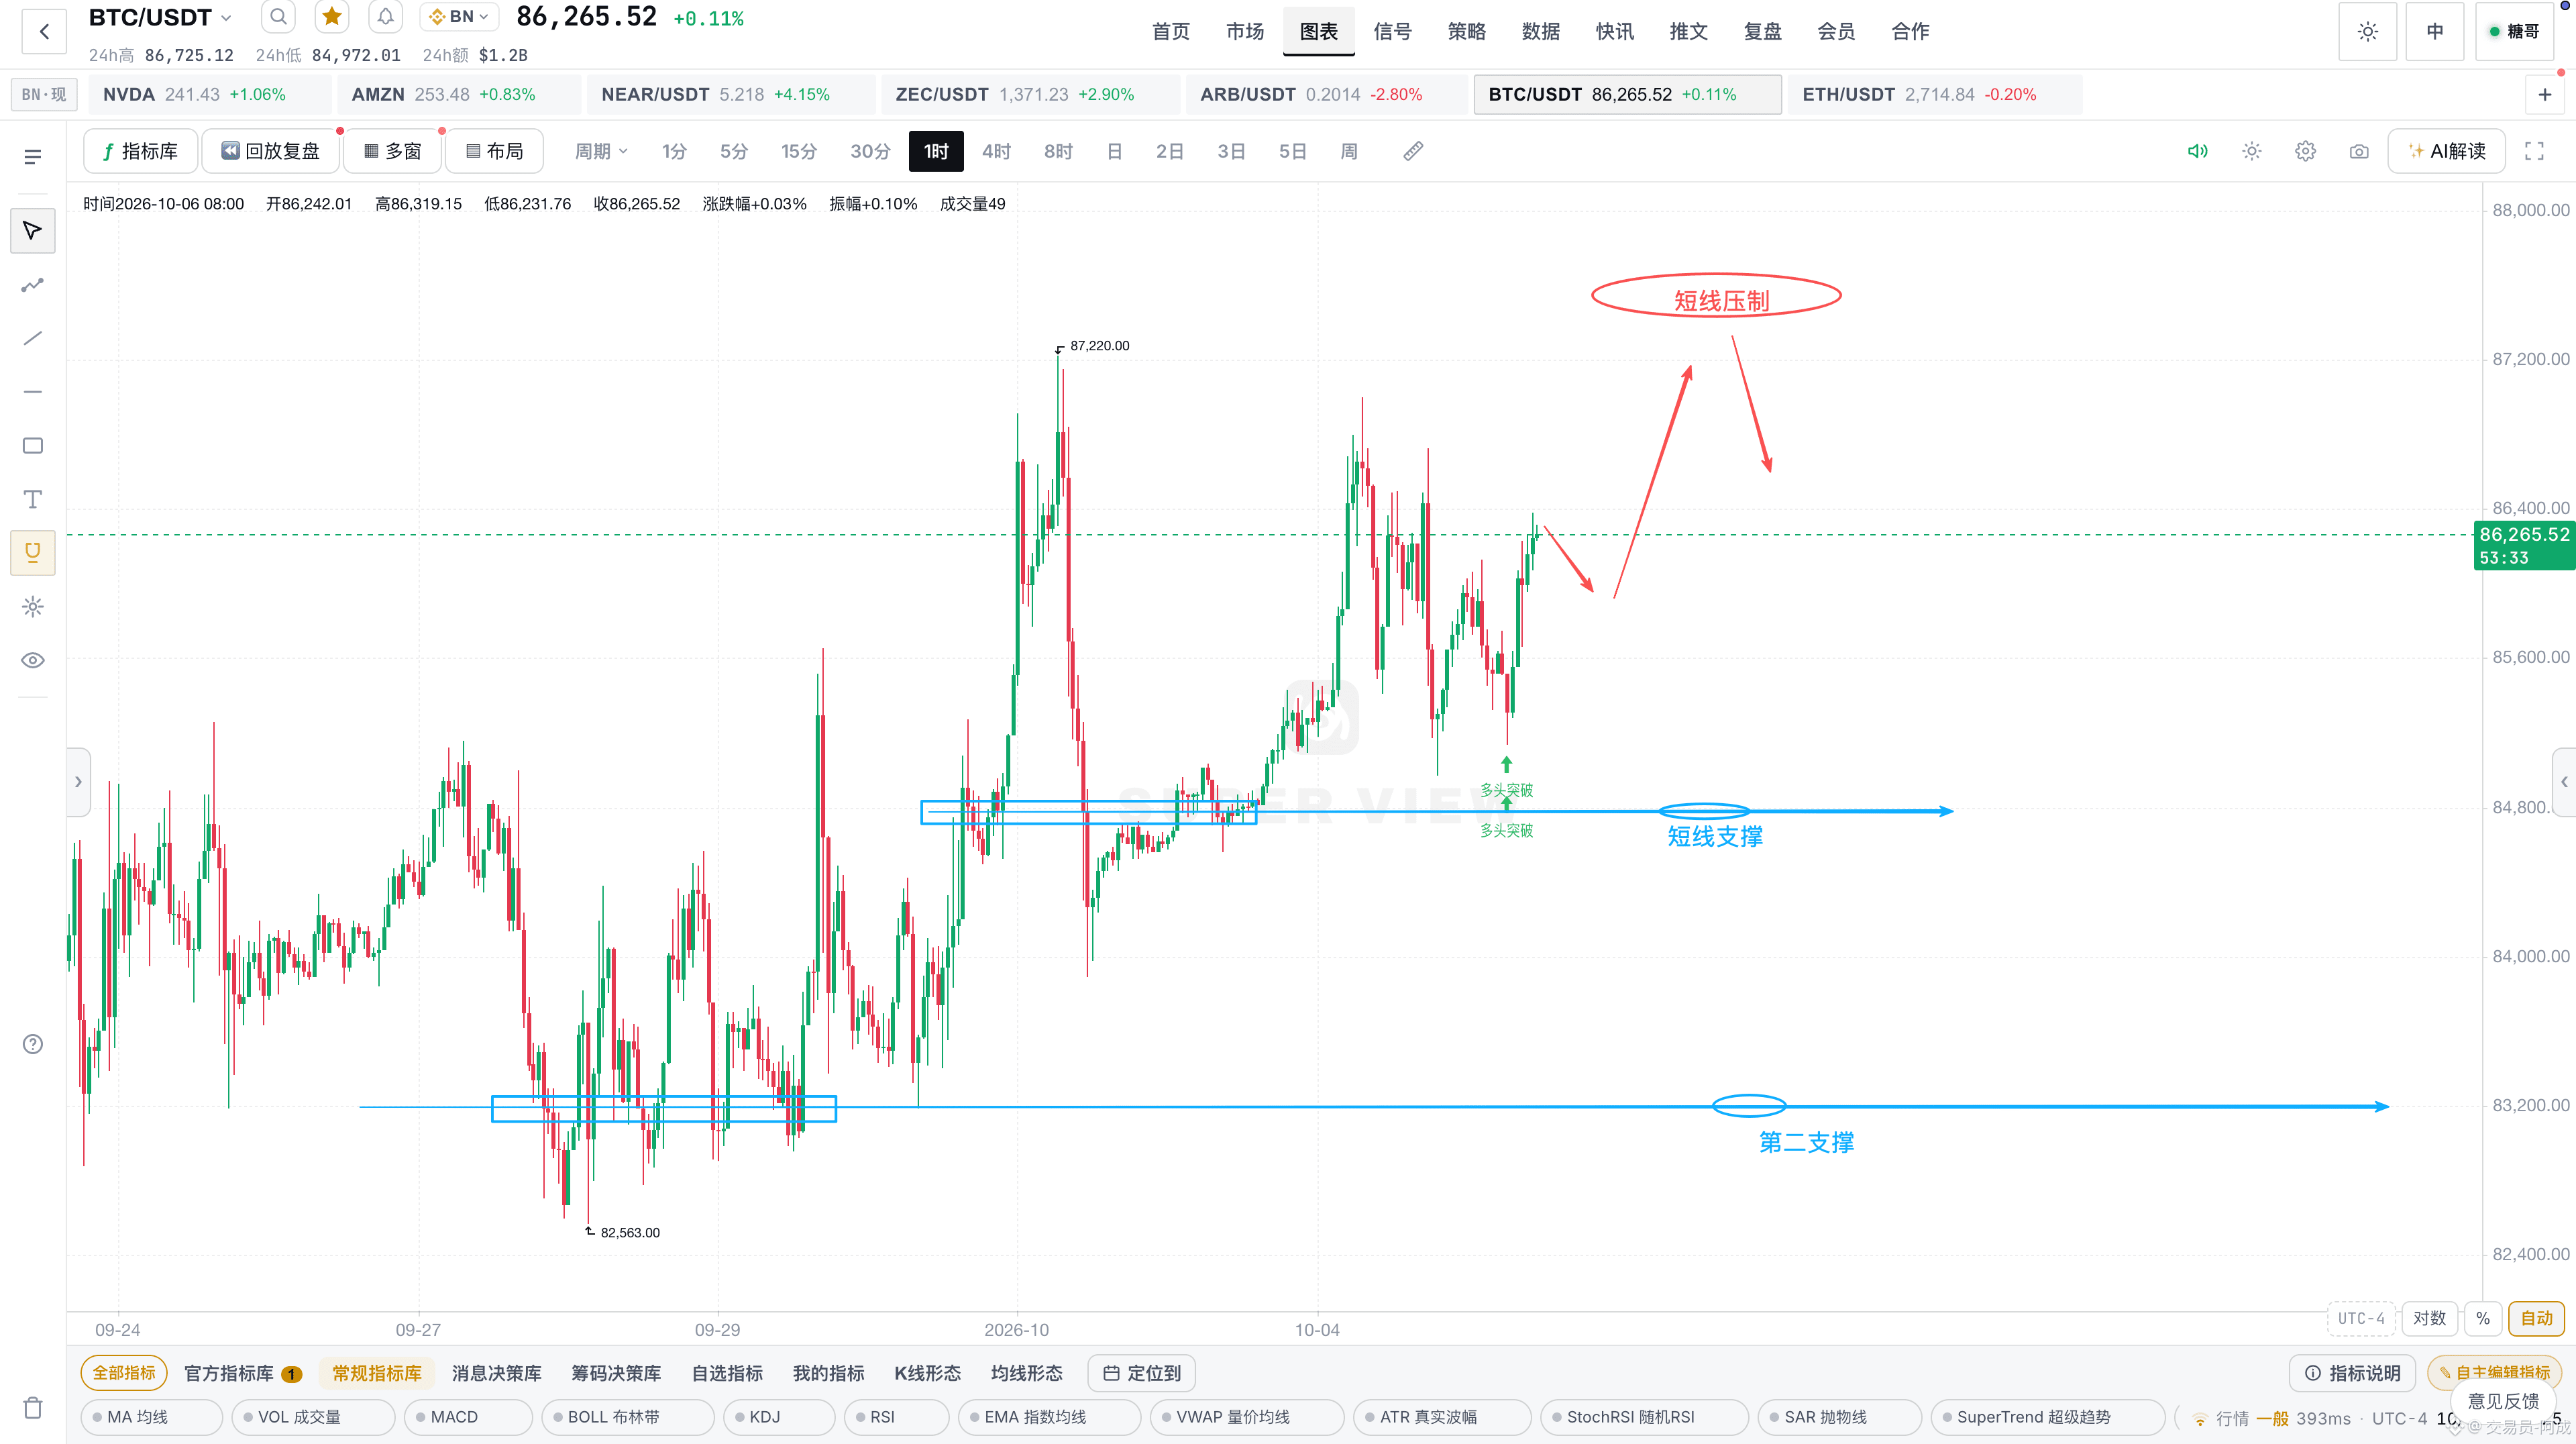
Short-term support: 84810–84530 (watch closely; enter and exit quickly. If an aggressive trade gets wicked down into this area, exit on the rebound). Second support: 83334–82658 (look for a rebound after a sharp drop on the lower timeframes).
Short-term resistance: 87640–88238
Second resistance: 93021–93990
Note: The levels above are all smaller zones within the lower-timeframe consolidation structure. Watch the charts closely when trading. If volatility increases later on, monitor the lower supports around 816–808 and the 750 level.
If you want to build a deeper understanding of the crypto market but don’t know where to start, or want to get up to speed quickly and learn about information gaps, come chat with me. You’ll get firsthand information and in-depth analysis!
Compared with yesterday’s price action, BTC’s structure across timeframes has changed very little. The higher timeframes are still moving sideways within the right-shoulder range of the “golden pit,” while the lower timeframes are also consolidating within a bullish range structure.
Under current conditions, live traders should watch for a potential shift in direction as the lower timeframes continue to build up during sideways movement. If a shift in structure occurs on the lower timeframes, the initial highs and lows are still likely to be bounded by the upper and lower edges of the higher-timeframe range.
High-risk, aggressive trade (purely speculative; you can skip it): Enter at a 1:2 ratio in the 86285–85220 area at the current price; stop loss at 84910 (1H candle body); take-profit reference: 871–882 (ideally, take profits while you can).
Short-term support: 84810–84530 (watch closely; enter and exit quickly. If an aggressive trade gets wicked down into this area, exit on the rebound). Second support: 83334–82658 (look for a rebound after a sharp drop on the lower timeframes).
Short-term resistance: 87640–88238
Second resistance: 93021–93990
Note: The levels above are all smaller zones within the lower-timeframe consolidation structure. Watch the charts closely when trading. If volatility increases later on, monitor the lower supports around 816–808 and the 750 level.
If you want to build a deeper understanding of the crypto market but don’t know where to start, or want to get up to speed quickly and learn about information gaps, come chat with me. You’ll get firsthand information and in-depth analysis!