$BTC I had things going on over National Day, so I didn’t post for a few days—and I even forgot Monday’s market analysis 😂. But the market’s movement over the holiday still followed my previous analysis and forecast. While celebrating with the country, I’ll also take the chance to congratulate myself: since returning in September, I’ve consistently nailed my market analyses and forecasts.
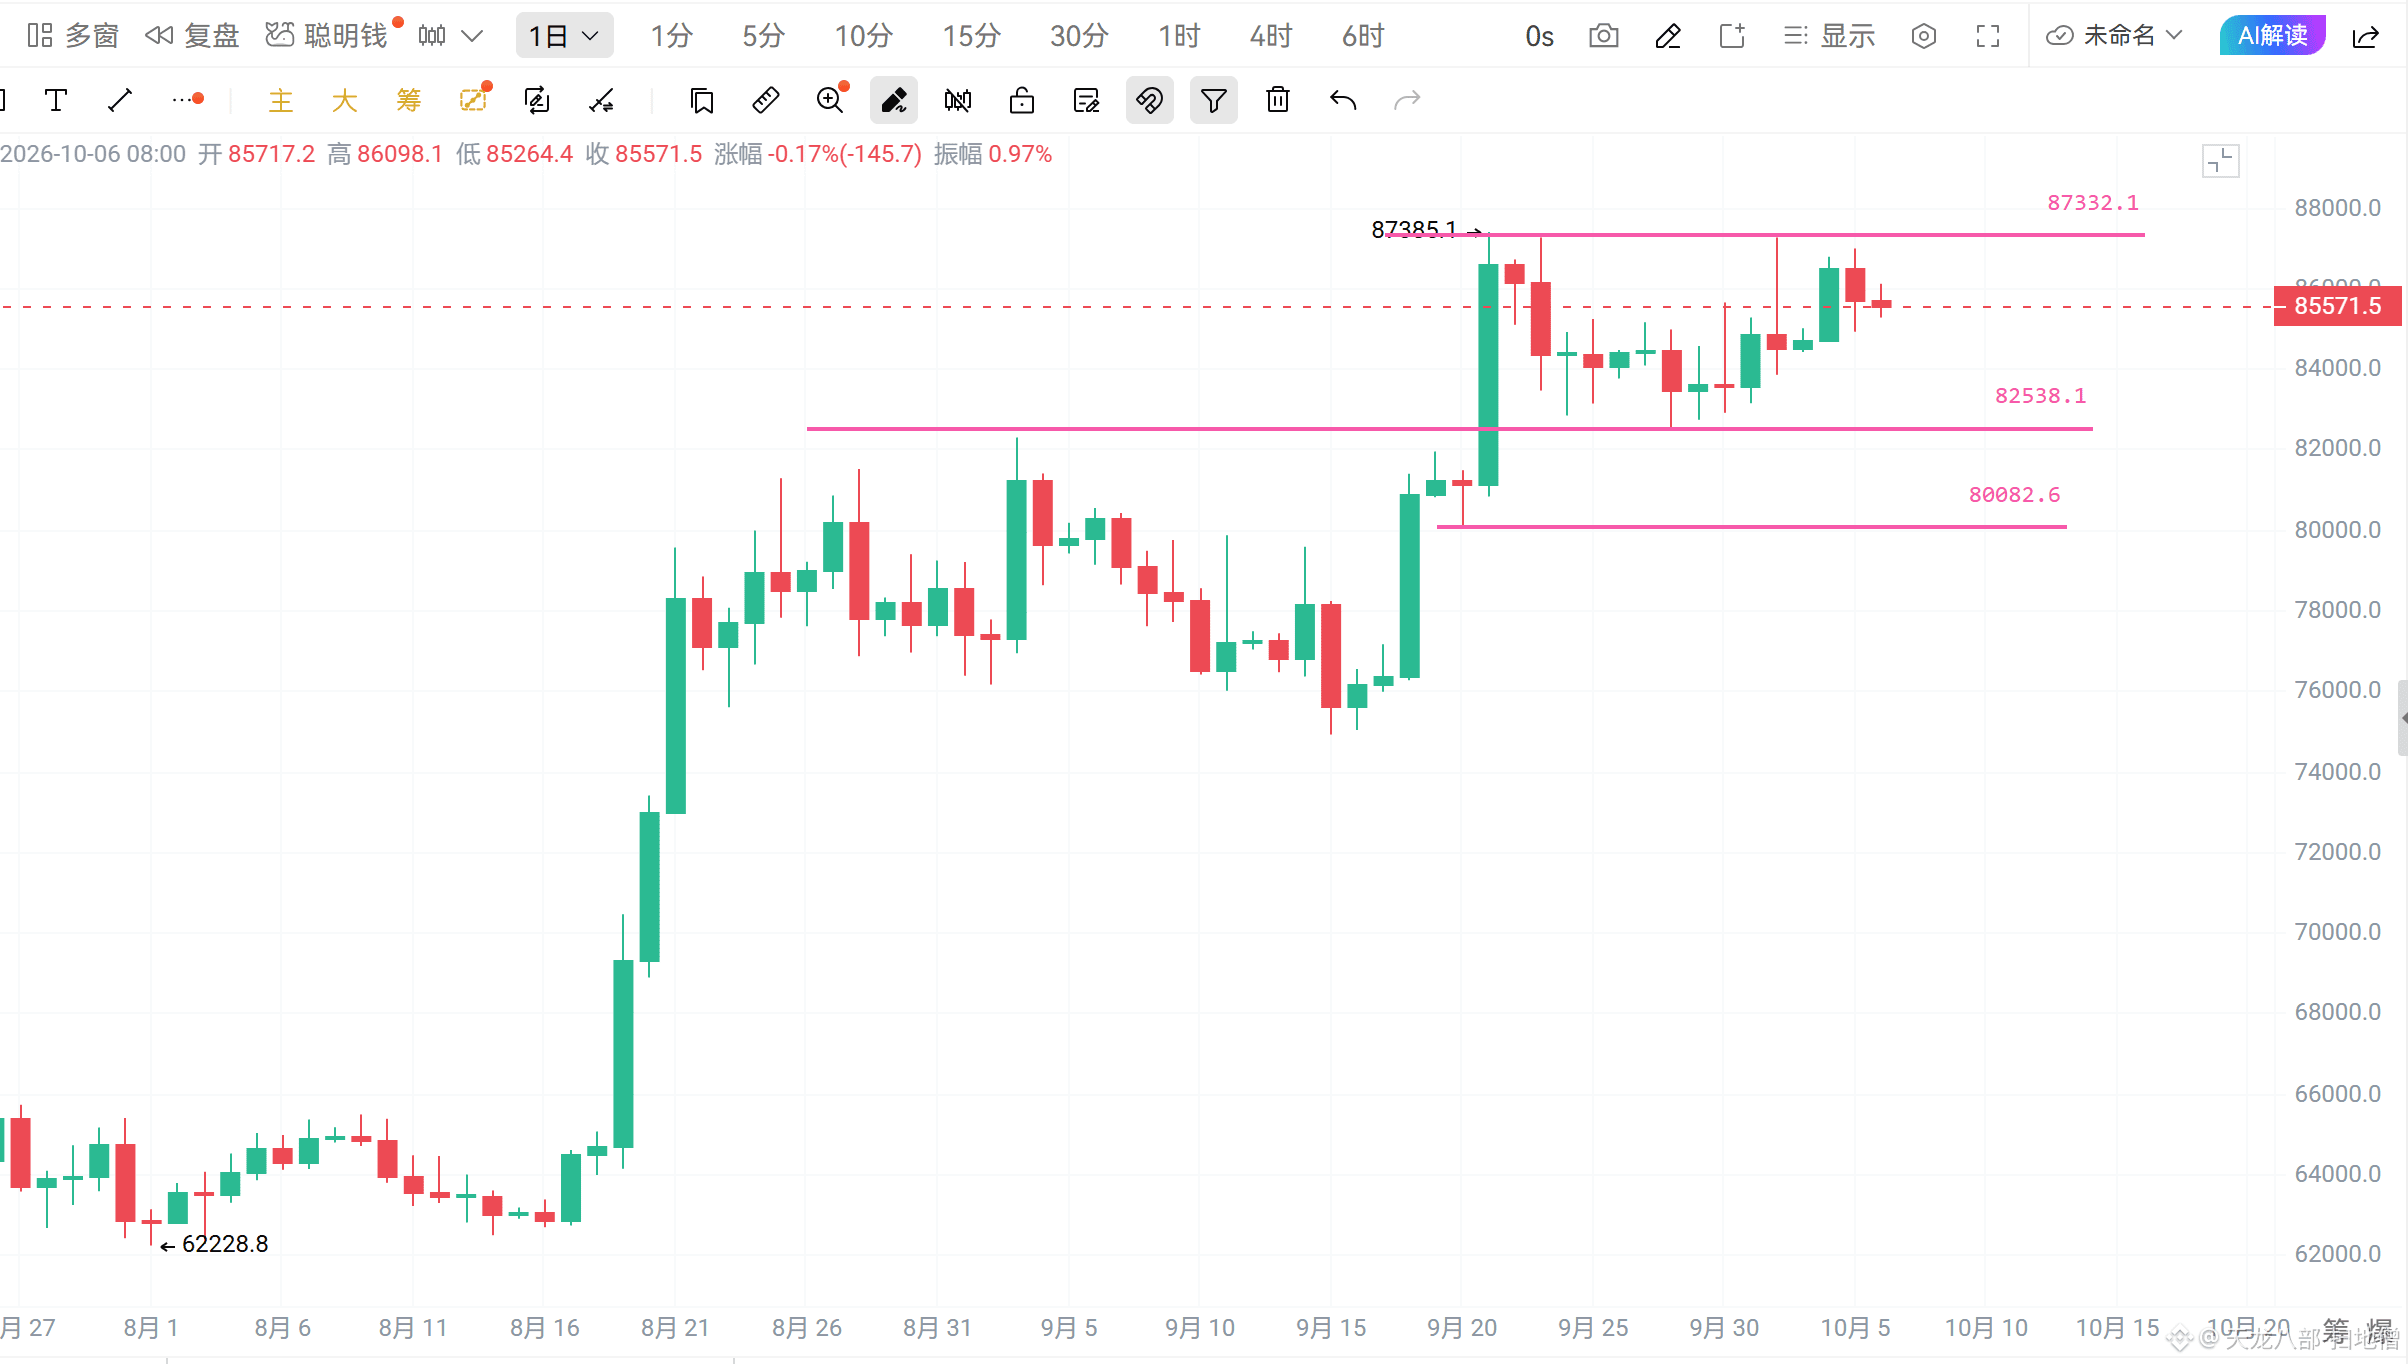
Daily chart: Naked price action. In early September, the market rose to a high of 82,200. More recently, after rising to 87,300, it fell to a low of 82,500. This can be understood as the previous high turning into support. From September 22 to now, the market has been ranging between 82,500 and 78,300. But this narrow range hasn’t made any real progress in repairing the weekly indicators. At this point, we should rely more on the long-term indicators to determine direction, rather than the weekly indicators.
The daily indicators show that the market has mostly been ranging under resistance at 87,300. In the past few days, the bottom of the range has kept moving higher. With such strong resistance, this rising-bottom pattern is forming a converging triangle. Judging by the price action, a major move is not far off: either it breaks through 87,300 and continues upward, or it breaks the pattern of rising lows and falls below support.
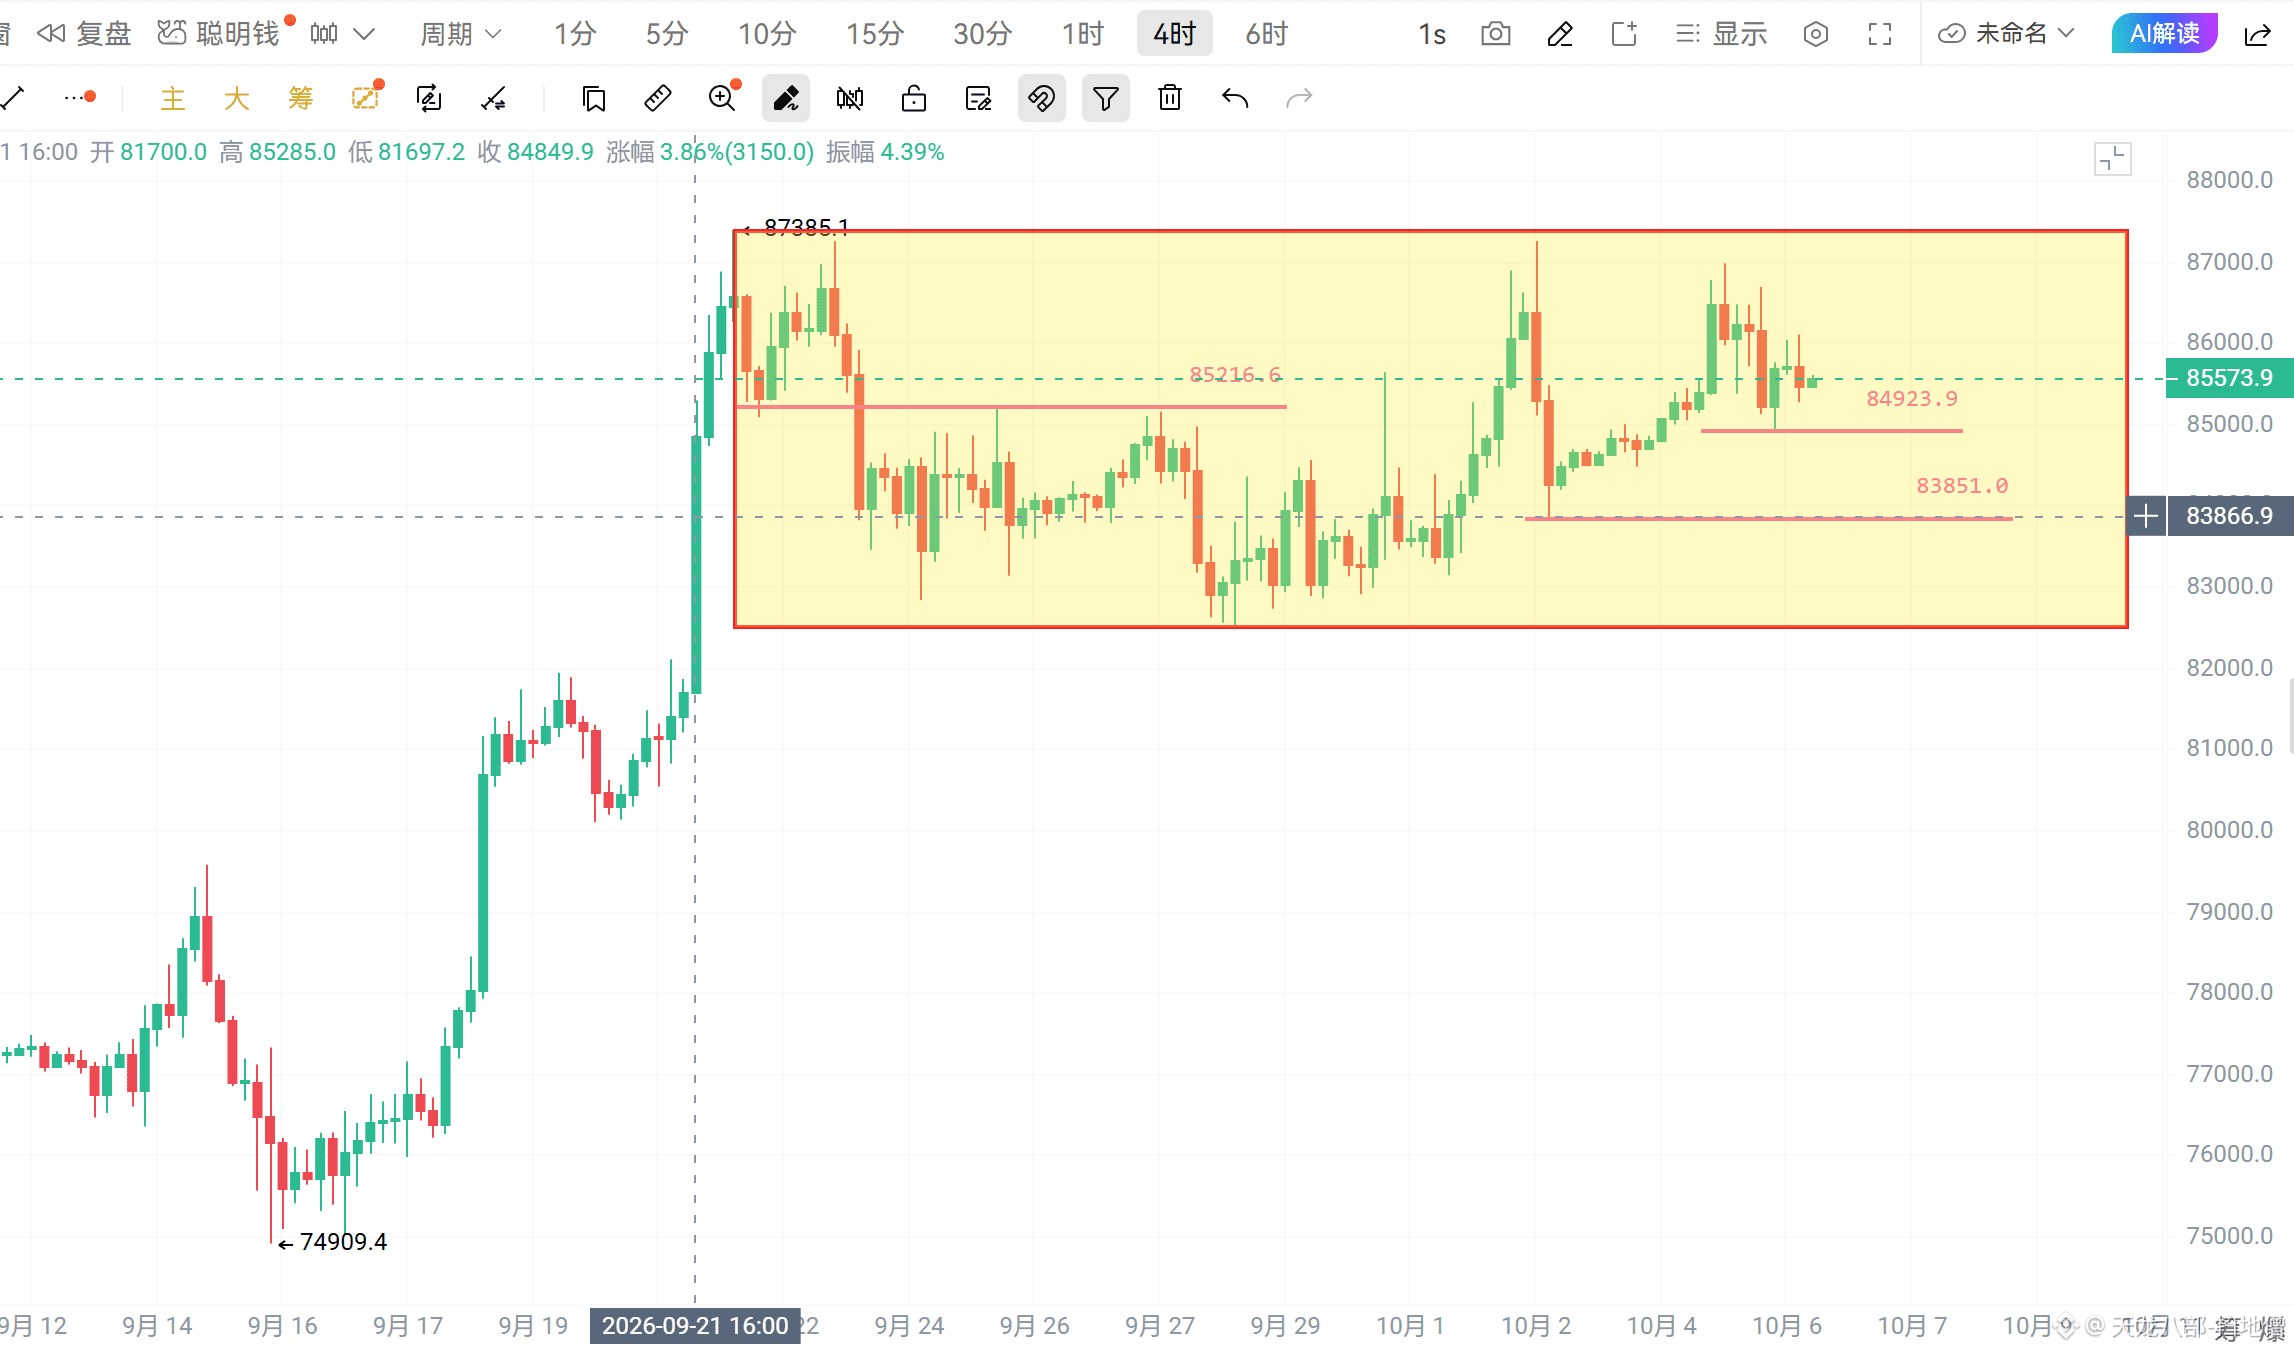
4-hour chart: The indicators and naked price action show that the market’s rising range has shifted from 82,500–85,200 to 83,900–87,300. Overall, though, it is still ranging between 82,500 and 87,300. The candlestick pattern shows that the triangle is nearing its end; the trading range has become too narrow, so a major move could happen at any time.
Overall analysis: From this price action, we can see that institutional players haven’t sold off their holdings in a big way; instead, they’re controlling the market. That’s why the market looks bearish, yet keeps moving sideways before gradually declining. This is why I said above that we should analyze the market based on long-term indicators, not weekly indicators, which can easily lead you into a trap set by the market makers.
Also, both an upward and a downward move are possible. For the market to rise, it would simply need to break decisively above 87,400 and hold there; in that case, 89,000–90,500 shouldn’t be a problem. But I’m more inclined toward a downward move. If the 93,800–84,000 support is successfully broken, that would invalidate the pattern of rising lows above 82,500. The market would most likely then head toward 80,000, 79,500, and 78,000, with 75,000 still in play.
As I’ve said before, the current market is suited to swing trading. Don’t make a snap judgment that the trend is set—there’s no need, really no need. In the age of big data, market makers are incredibly crafty. #行情分析📈
Daily chart: Naked price action. In early September, the market rose to a high of 82,200. More recently, after rising to 87,300, it fell to a low of 82,500. This can be understood as the previous high turning into support. From September 22 to now, the market has been ranging between 82,500 and 78,300. But this narrow range hasn’t made any real progress in repairing the weekly indicators. At this point, we should rely more on the long-term indicators to determine direction, rather than the weekly indicators.
The daily indicators show that the market has mostly been ranging under resistance at 87,300. In the past few days, the bottom of the range has kept moving higher. With such strong resistance, this rising-bottom pattern is forming a converging triangle. Judging by the price action, a major move is not far off: either it breaks through 87,300 and continues upward, or it breaks the pattern of rising lows and falls below support.
4-hour chart: The indicators and naked price action show that the market’s rising range has shifted from 82,500–85,200 to 83,900–87,300. Overall, though, it is still ranging between 82,500 and 87,300. The candlestick pattern shows that the triangle is nearing its end; the trading range has become too narrow, so a major move could happen at any time.
Overall analysis: From this price action, we can see that institutional players haven’t sold off their holdings in a big way; instead, they’re controlling the market. That’s why the market looks bearish, yet keeps moving sideways before gradually declining. This is why I said above that we should analyze the market based on long-term indicators, not weekly indicators, which can easily lead you into a trap set by the market makers.
Also, both an upward and a downward move are possible. For the market to rise, it would simply need to break decisively above 87,400 and hold there; in that case, 89,000–90,500 shouldn’t be a problem. But I’m more inclined toward a downward move. If the 93,800–84,000 support is successfully broken, that would invalidate the pattern of rising lows above 82,500. The market would most likely then head toward 80,000, 79,500, and 78,000, with 75,000 still in play.
As I’ve said before, the current market is suited to swing trading. Don’t make a snap judgment that the trend is set—there’s no need, really no need. In the age of big data, market makers are incredibly crafty. #行情分析📈