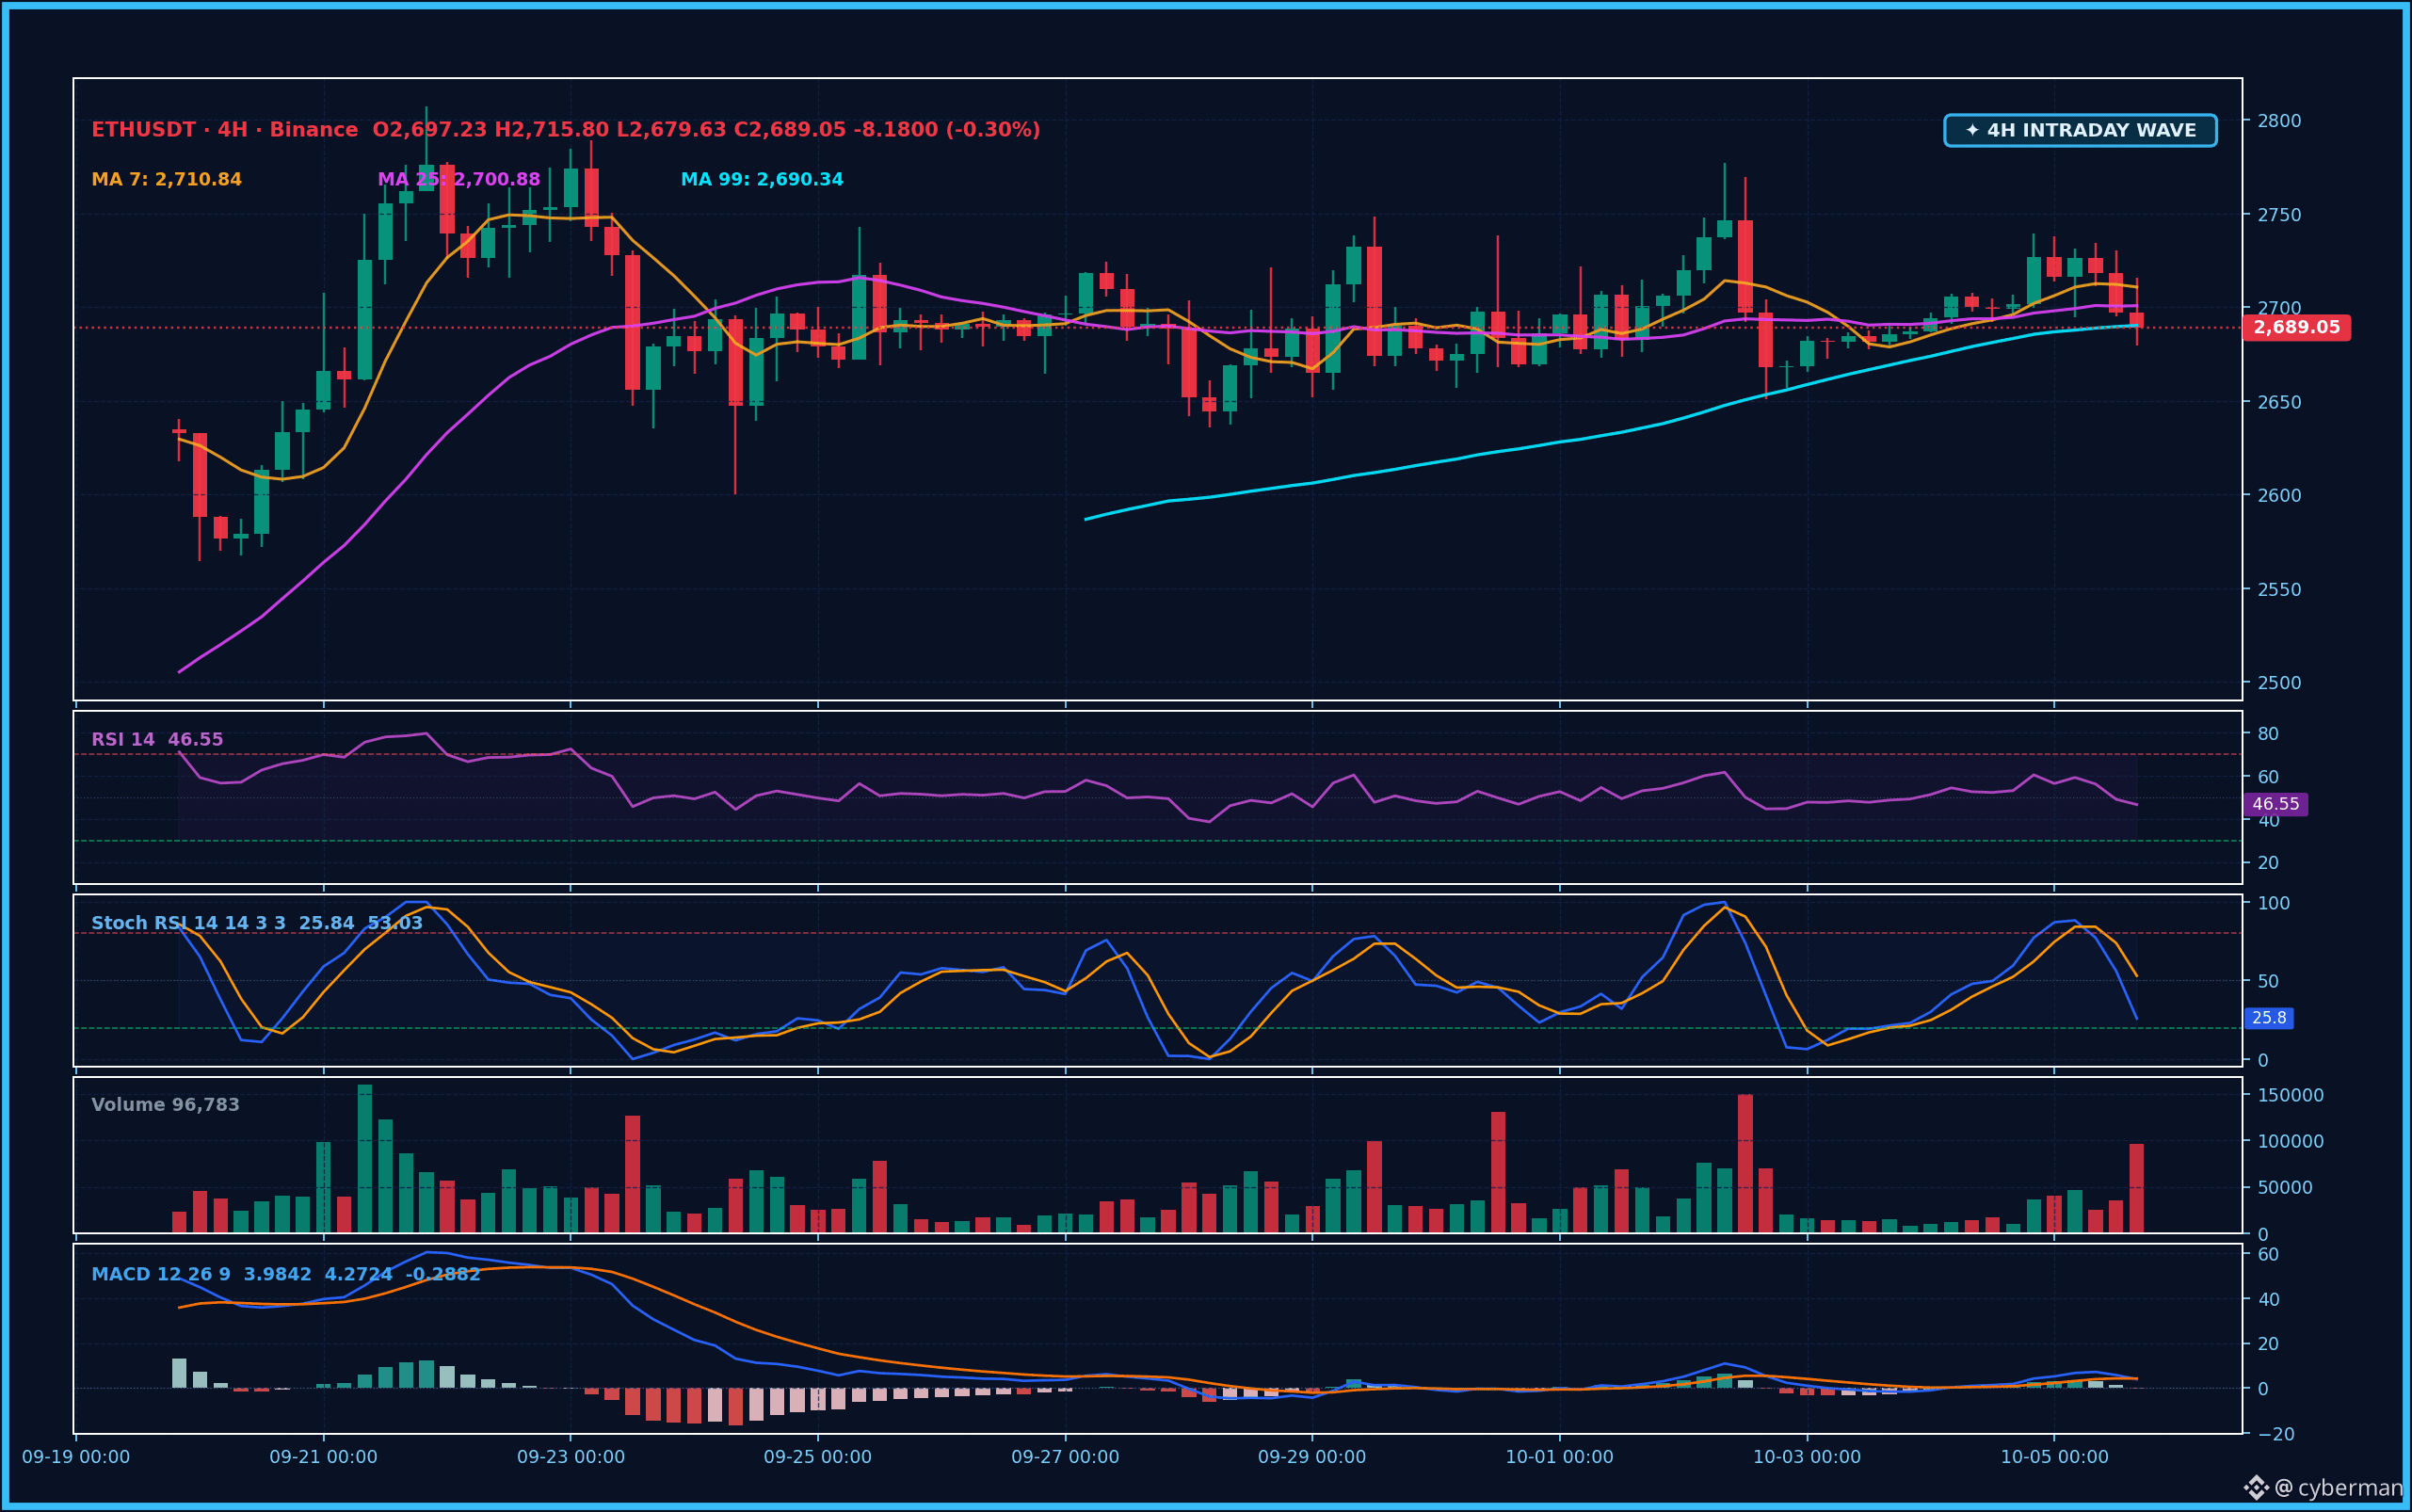
Those of you who are new to the market probably get pretty impatient when you see the chart $ETH just drifting sideways—it’s so boring you don’t even feel like trading, right? 💡 Actually, this is when the market is quietly giving us a heads-up about a big move coming soon.
Picture it like this: we have a rubber band. When you stretch it as far as it can go and then let go, it snaps back with a lot of force. And when it contracts and gets tightly compressed, it’s also storing energy for a big “pop.” 💥 In trading, that “rubber band” is the Bollinger Bands. When the distance between the two bands (called the Bandwidth) gets extremely tight—as on the chart $ETH , where the Bandwidth is just 2.51%—it signals that the price is undergoing intense consolidation. It’s just like a spring compressed to its limit, ready to release.
Take a look at the current chart $ETH 🧑🏫. The price is hovering around $2,689.05, and can you see how the MA lines (MA7 at $2,710.84, MA25 at $2,700.88, and MA99 at $2,690.34) are all clustering very close together?
Picture it like this: we have a rubber band. When you stretch it as far as it can go and then let go, it snaps back with a lot of force. And when it contracts and gets tightly compressed, it’s also storing energy for a big “pop.” 💥 In trading, that “rubber band” is the Bollinger Bands. When the distance between the two bands (called the Bandwidth) gets extremely tight—as on the chart $ETH , where the Bandwidth is just 2.51%—it signals that the price is undergoing intense consolidation. It’s just like a spring compressed to its limit, ready to release.
Take a look at the current chart $ETH 🧑🏫. The price is hovering around $2,689.05, and can you see how the MA lines (MA7 at $2,710.84, MA25 at $2,700.88, and MA99 at $2,690.34) are all clustering very close together?