Google and AVGO—the sleeping dragon and young phoenix of my portfolio.
They just keep grinding sideways. I’ve held them so long they’ve practically developed a patina. I bought them for the AI story; while holding them, I’ve been working on my mindset.
That said, Google’s 4-hour chart is starting to look worth watching.
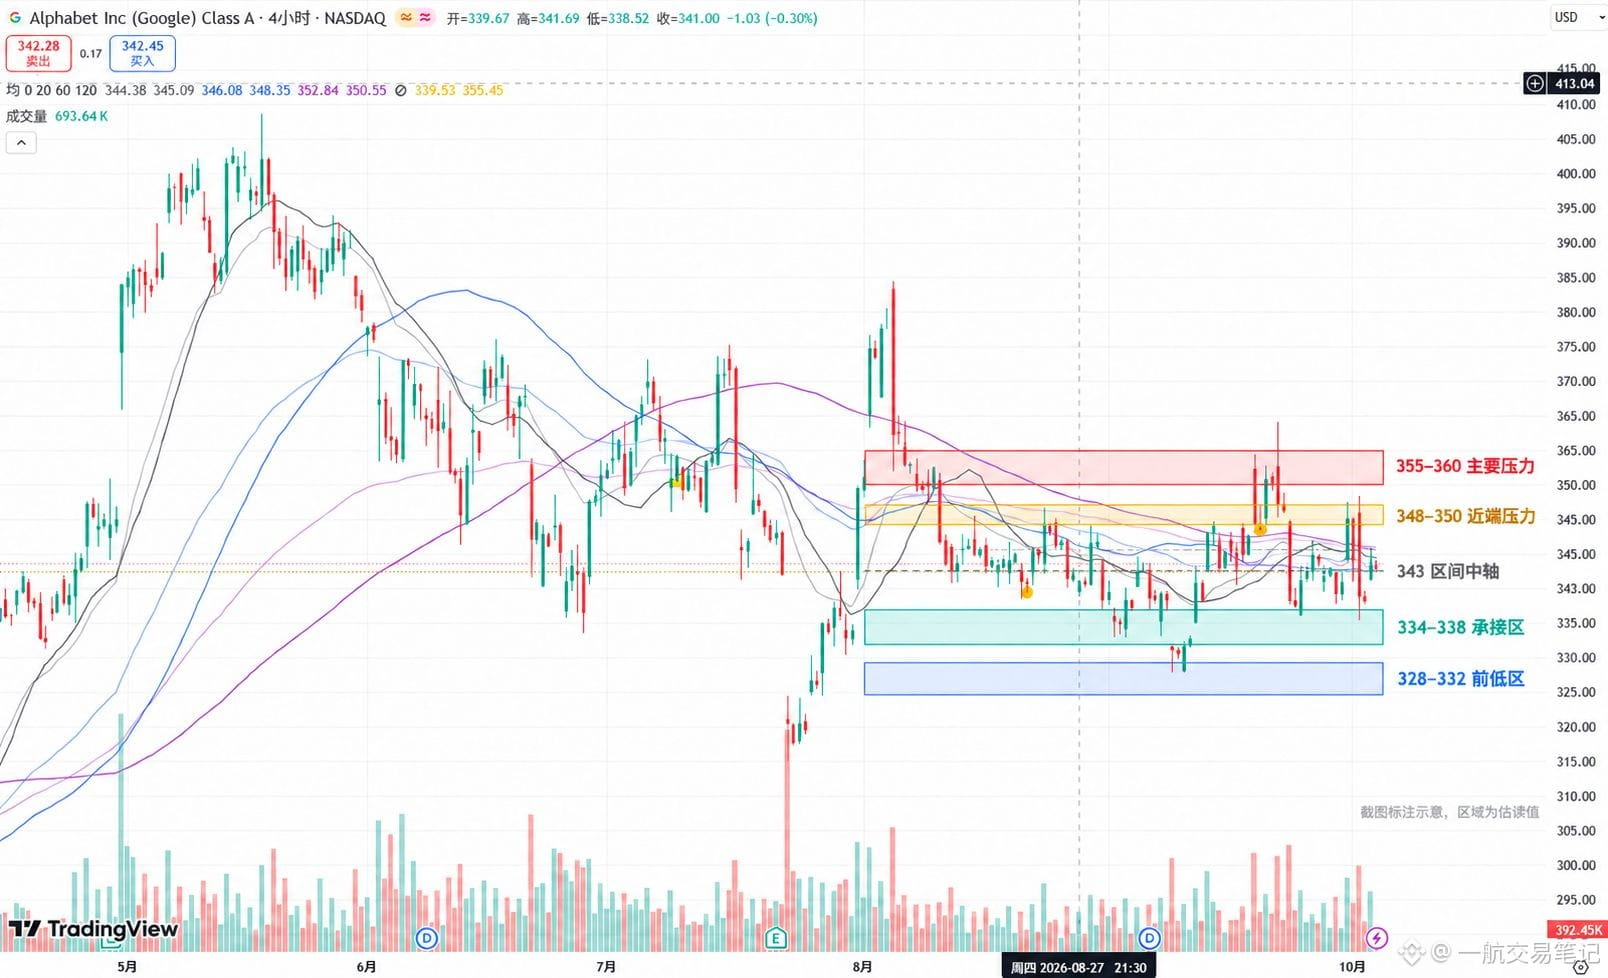
In the screenshot from October 5, several moving averages are clustered around $343, with the price repeatedly crossing above and below them. The direction hasn’t emerged yet, but the next move out of this zone could be more interesting than these little ups and downs.
The first level I’m watching is $348–350.
On a few previous pushes higher, volume picked up, but the price then fell back into the range. So even if we get another pop, I won’t be quick to call it a breakout. The key is whether a 4-hour candle can close above $350, and whether buyers step in on a pullback.
If it holds above that level, there’s another hurdle at $355–360. Getting through that would lend more support to the idea that this consolidation is starting to improve.
To the downside, I’m watching $334–338. If it breaks below that and can’t reclaim the range, we should be wary of another test of the previous lows at $328–332.
A long grind could mean selling pressure is being absorbed; lower rebound highs could also mean buyers still aren’t strong enough. If you see the moving averages tangled together and decide in advance that an upside breakout is coming, it’s easy to draw your hopes for your holdings onto the chart.
What Google needs most right now is a move higher that actually holds.
One of these two prodigies has to emerge from hiding first. Google, try getting through that $350 door.
#GOOGLB #AVGOB #美股
They just keep grinding sideways. I’ve held them so long they’ve practically developed a patina. I bought them for the AI story; while holding them, I’ve been working on my mindset.
That said, Google’s 4-hour chart is starting to look worth watching.
In the screenshot from October 5, several moving averages are clustered around $343, with the price repeatedly crossing above and below them. The direction hasn’t emerged yet, but the next move out of this zone could be more interesting than these little ups and downs.
The first level I’m watching is $348–350.
On a few previous pushes higher, volume picked up, but the price then fell back into the range. So even if we get another pop, I won’t be quick to call it a breakout. The key is whether a 4-hour candle can close above $350, and whether buyers step in on a pullback.
If it holds above that level, there’s another hurdle at $355–360. Getting through that would lend more support to the idea that this consolidation is starting to improve.
To the downside, I’m watching $334–338. If it breaks below that and can’t reclaim the range, we should be wary of another test of the previous lows at $328–332.
A long grind could mean selling pressure is being absorbed; lower rebound highs could also mean buyers still aren’t strong enough. If you see the moving averages tangled together and decide in advance that an upside breakout is coming, it’s easy to draw your hopes for your holdings onto the chart.
What Google needs most right now is a move higher that actually holds.
One of these two prodigies has to emerge from hiding first. Google, try getting through that $350 door.
#GOOGLB #AVGOB #美股