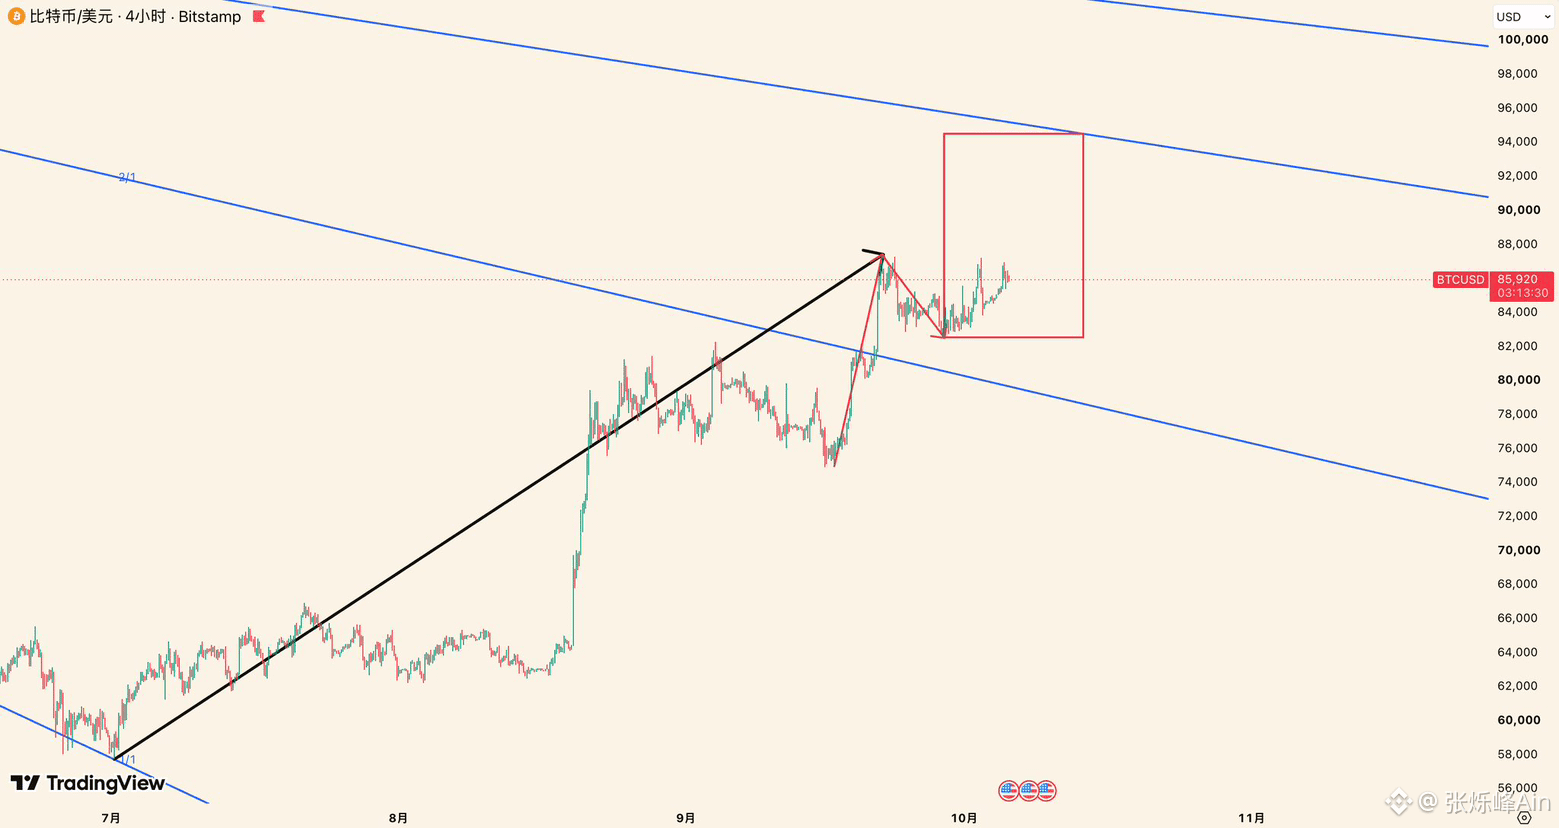
Since we said that the 82300–74968 move was a correction of the 57800–82300 rally and had already ended, BTC has risen steadily from 74968 to 87396.
This is a standard daily-timeframe rally.
BTC is likely to end its more than ten days of sideways trading this week, so we should pay close attention to the following:
If BTC does not fall below 82563 again this week, or if a daily candle closes above 86360, we can assume that the 87396–82563 move was a daily-timeframe correction of the 74968–87396 rally and has ended. If the 87396–82563 move is confirmed as the entire correction, it would be a strong correction.
Under this scenario, the rally from 82563 is on the same timeframe as the 74968–87396 rally; both are daily-timeframe moves.
If BTC falls below 82563 again this week, but stays above the blue 2/1 Gann angle line—around 79780–80100—we will continue, for now, to view the decline from 87396 as a correction of the 74968–87396 rally. A further break below 82563 would make this a complex correction. Once its endpoint is found, the subsequent rally would also be on the daily timeframe.
If this is only a daily-timeframe correction, it will most likely end this week, as its duration is already close to the limit for a daily-timeframe correction. If it does not end this week, consider the possibility that the correction is expanding to a higher timeframe.
In mid-June, I noted that the interim low was likely to occur from late June to early July. BTC then fell to 57800 and staged a V-shaped rebound ✅
On August 21, I clearly stated that 79500 was not the end of the rally. BTC then continued higher, reaching 82500 ✅
On September 18, I pointed out that 82300–74968 was the entire correction. BTC continued higher afterward, reaching a high of 87396 ✅
We have been tracking BTC's market structure consistently since 2025, and we have flagged most key turning points in advance. If you're interested in BTC, don't forget to like and follow. Your support also motivates me to keep posting 💗#BTC走势分析 $BTC
This is a standard daily-timeframe rally.
BTC is likely to end its more than ten days of sideways trading this week, so we should pay close attention to the following:
If BTC does not fall below 82563 again this week, or if a daily candle closes above 86360, we can assume that the 87396–82563 move was a daily-timeframe correction of the 74968–87396 rally and has ended. If the 87396–82563 move is confirmed as the entire correction, it would be a strong correction.
Under this scenario, the rally from 82563 is on the same timeframe as the 74968–87396 rally; both are daily-timeframe moves.
If BTC falls below 82563 again this week, but stays above the blue 2/1 Gann angle line—around 79780–80100—we will continue, for now, to view the decline from 87396 as a correction of the 74968–87396 rally. A further break below 82563 would make this a complex correction. Once its endpoint is found, the subsequent rally would also be on the daily timeframe.
If this is only a daily-timeframe correction, it will most likely end this week, as its duration is already close to the limit for a daily-timeframe correction. If it does not end this week, consider the possibility that the correction is expanding to a higher timeframe.
In mid-June, I noted that the interim low was likely to occur from late June to early July. BTC then fell to 57800 and staged a V-shaped rebound ✅
On August 21, I clearly stated that 79500 was not the end of the rally. BTC then continued higher, reaching 82500 ✅
On September 18, I pointed out that 82300–74968 was the entire correction. BTC continued higher afterward, reaching a high of 87396 ✅
We have been tracking BTC's market structure consistently since 2025, and we have flagged most key turning points in advance. If you're interested in BTC, don't forget to like and follow. Your support also motivates me to keep posting 💗#BTC走势分析 $BTC