

我真的可以
104 Posts

我真的可以
Report
Block User
22 Following
7 Followers
21 Liked
Posts
All
Quotes
·
--
$RLC After this sharp, consecutive rally, the price has pulled back from its highs. The 24-hour high reached 0.9710, setting a high for this market cycle. A long upper wick formed after the surge—a typical sign of resistance at the highs and bulls taking profits.
Earlier, the price climbed steadily from around 0.38 with a series of large bullish candles, driven by aggressive short-term speculation.
The long upper wick at 0.9710 indicates heavy selling pressure above, with bullish funds exiting at higher prices.
MA7 (yellow line, 0.8525): The current price of 0.8992 is still above the short-term moving average, so the short-term trend has not fully turned bearish.
MA25 (pink line, 0.6800) and MA99 (purple line, 0.4473): The moving averages remain steeply upward-sloping, and the strong medium- to long-term structure is intact.
This is a high-level consolidation and pullback after a sharp rally, not a trend reversal. It is a period of shakeout near the highs. As long as the price does not decisively break below MA7, the bullish trend remains intact for now.
During the rally: Trading volume expanded steadily as major players entered the market and pushed prices higher.
The candle at the 0.9710 high: It recorded the largest trading volume of this cycle, a volume signal that major players were distributing their holdings.
Current pullback: Volume has contracted from its peak, indicating that panic selling has not yet emerged.
Order-book liquidity:
Above: 0.9710 is strong resistance, with a large number of holders stuck at higher prices.
Below: Around 0.85 (MA7) is the first support; further down, 0.68 (MA25) is the next strong support level.
Two scenarios
Strong shakeout (bullish bias)
The price holds the 0.8525 (MA7) support, stabilizes, and then makes another attempt to reach the previous high of 0.9710.
Conditions: A retest near 0.85 does not make a new low, followed by a renewed increase in volume and a large bullish candle.
Target: After breaking above 0.97, watch for a move above 1.0.
Bullish trend tops out; reversal from the highs (risk scenario)
A high-volume break below MA7 (0.8525), followed by a 1-hour candle closing and holding below it, would signal that this cycle's short-term rally has ended.
First target: MA25 support near 0.68.
Rationale: After a sharp rally, the long upper wick and huge volume near the highs signal selling pressure. If the price then breaks below the short-term moving average, many late-entry bulls may stop out, accelerating the decline.
Key levels to watch
🔴Resistance: 0.9710 (cycle high, strong resistance), 1.0017
🟢Support: 0.8525, 0.68 (MA25)
Summary
The long upper wick and huge volume indicate heavy selling pressure overhead. The key battleground between bulls and bears is the short-term moving average at 0.85.
If 0.85 holds: The market can maintain a strong consolidation, with a chance to retest the previous high.
If 0.85 breaks: The short-term rally will be over, and a deeper correction is likely.
$RLC After this sharp, consecutive rally, the price has pulled back from its highs. The 24-hour high reached 0.9710, setting a high for this market cycle. A long upper wick formed after the surge—a typical sign of resistance at the highs and bulls taking profits.
Earlier, the price climbed steadily from around 0.38 with a series of large bullish candles, driven by aggressive short-term speculation.
The long upper wick at 0.9710 indicates heavy selling pressure above, with bullish funds exiting at higher prices.
MA7 (yellow line, 0.8525): The current price of 0.8992 is still above the short-term moving average, so the short-term trend has not fully turned bearish.
MA25 (pink line, 0.6800) and MA99 (purple line, 0.4473): The moving averages remain steeply upward-sloping, and the strong medium- to long-term structure is intact.
This is a high-level consolidation and pullback after a sharp rally, not a trend reversal. It is a period of shakeout near the highs. As long as the price does not decisively break below MA7, the bullish trend remains intact for now.
During the rally: Trading volume expanded steadily as major players entered the market and pushed prices higher.
The candle at the 0.9710 high: It recorded the largest trading volume of this cycle, a volume signal that major players were distributing their holdings.
Current pullback: Volume has contracted from its peak, indicating that panic selling has not yet emerged.
Order-book liquidity:
Above: 0.9710 is strong resistance, with a large number of holders stuck at higher prices.
Below: Around 0.85 (MA7) is the first support; further down, 0.68 (MA25) is the next strong support level.
Two scenarios
Strong shakeout (bullish bias)
The price holds the 0.8525 (MA7) support, stabilizes, and then makes another attempt to reach the previous high of 0.9710.
Conditions: A retest near 0.85 does not make a new low, followed by a renewed increase in volume and a large bullish candle.
Target: After breaking above 0.97, watch for a move above 1.0.
Bullish trend tops out; reversal from the highs (risk scenario)
A high-volume break below MA7 (0.8525), followed by a 1-hour candle closing and holding below it, would signal that this cycle's short-term rally has ended.
First target: MA25 support near 0.68.
Rationale: After a sharp rally, the long upper wick and huge volume near the highs signal selling pressure. If the price then breaks below the short-term moving average, many late-entry bulls may stop out, accelerating the decline.
Key levels to watch
🔴Resistance: 0.9710 (cycle high, strong resistance), 1.0017
🟢Support: 0.8525, 0.68 (MA25)
Summary
The long upper wick and huge volume indicate heavy selling pressure overhead. The key battleground between bulls and bears is the short-term moving average at 0.85.
If 0.85 holds: The market can maintain a strong consolidation, with a chance to retest the previous high.
If 0.85 breaks: The short-term rally will be over, and a deeper correction is likely.
Earlier, the price climbed steadily from around 0.38 with a series of large bullish candles, driven by aggressive short-term speculation.
The long upper wick at 0.9710 indicates heavy selling pressure above, with bullish funds exiting at higher prices.
MA7 (yellow line, 0.8525): The current price of 0.8992 is still above the short-term moving average, so the short-term trend has not fully turned bearish.
MA25 (pink line, 0.6800) and MA99 (purple line, 0.4473): The moving averages remain steeply upward-sloping, and the strong medium- to long-term structure is intact.
This is a high-level consolidation and pullback after a sharp rally, not a trend reversal. It is a period of shakeout near the highs. As long as the price does not decisively break below MA7, the bullish trend remains intact for now.
During the rally: Trading volume expanded steadily as major players entered the market and pushed prices higher.
The candle at the 0.9710 high: It recorded the largest trading volume of this cycle, a volume signal that major players were distributing their holdings.
Current pullback: Volume has contracted from its peak, indicating that panic selling has not yet emerged.
Order-book liquidity:
Above: 0.9710 is strong resistance, with a large number of holders stuck at higher prices.
Below: Around 0.85 (MA7) is the first support; further down, 0.68 (MA25) is the next strong support level.
Two scenarios
Strong shakeout (bullish bias)
The price holds the 0.8525 (MA7) support, stabilizes, and then makes another attempt to reach the previous high of 0.9710.
Conditions: A retest near 0.85 does not make a new low, followed by a renewed increase in volume and a large bullish candle.
Target: After breaking above 0.97, watch for a move above 1.0.
Bullish trend tops out; reversal from the highs (risk scenario)
A high-volume break below MA7 (0.8525), followed by a 1-hour candle closing and holding below it, would signal that this cycle's short-term rally has ended.
First target: MA25 support near 0.68.
Rationale: After a sharp rally, the long upper wick and huge volume near the highs signal selling pressure. If the price then breaks below the short-term moving average, many late-entry bulls may stop out, accelerating the decline.
Key levels to watch
🔴Resistance: 0.9710 (cycle high, strong resistance), 1.0017
🟢Support: 0.8525, 0.68 (MA25)
Summary
The long upper wick and huge volume indicate heavy selling pressure overhead. The key battleground between bulls and bears is the short-term moving average at 0.85.
If 0.85 holds: The market can maintain a strong consolidation, with a chance to retest the previous high.
If 0.85 breaks: The short-term rally will be over, and a deeper correction is likely.
140
·
--
$RLC v came back and immediately went AFK at 1.1,
$RLC v came back and immediately went AFK at 1.1,
2
139
·
--
$RLC No matter how much leverage you use, managing your position size is crucial. It would have been dangerous if I’d been fully invested just now. Always keep half aside for day trading.
$RLC No matter how much leverage you use, managing your position size is crucial. It would have been dangerous if I’d been fully invested just now. Always keep half aside for day trading.
345
·
--
Is $RLC about to break 1? Short into the rally with a tiny position, then make a T-trade.
Is $RLC about to break 1? Short into the rally with a tiny position, then make a T-trade.
184
·
--
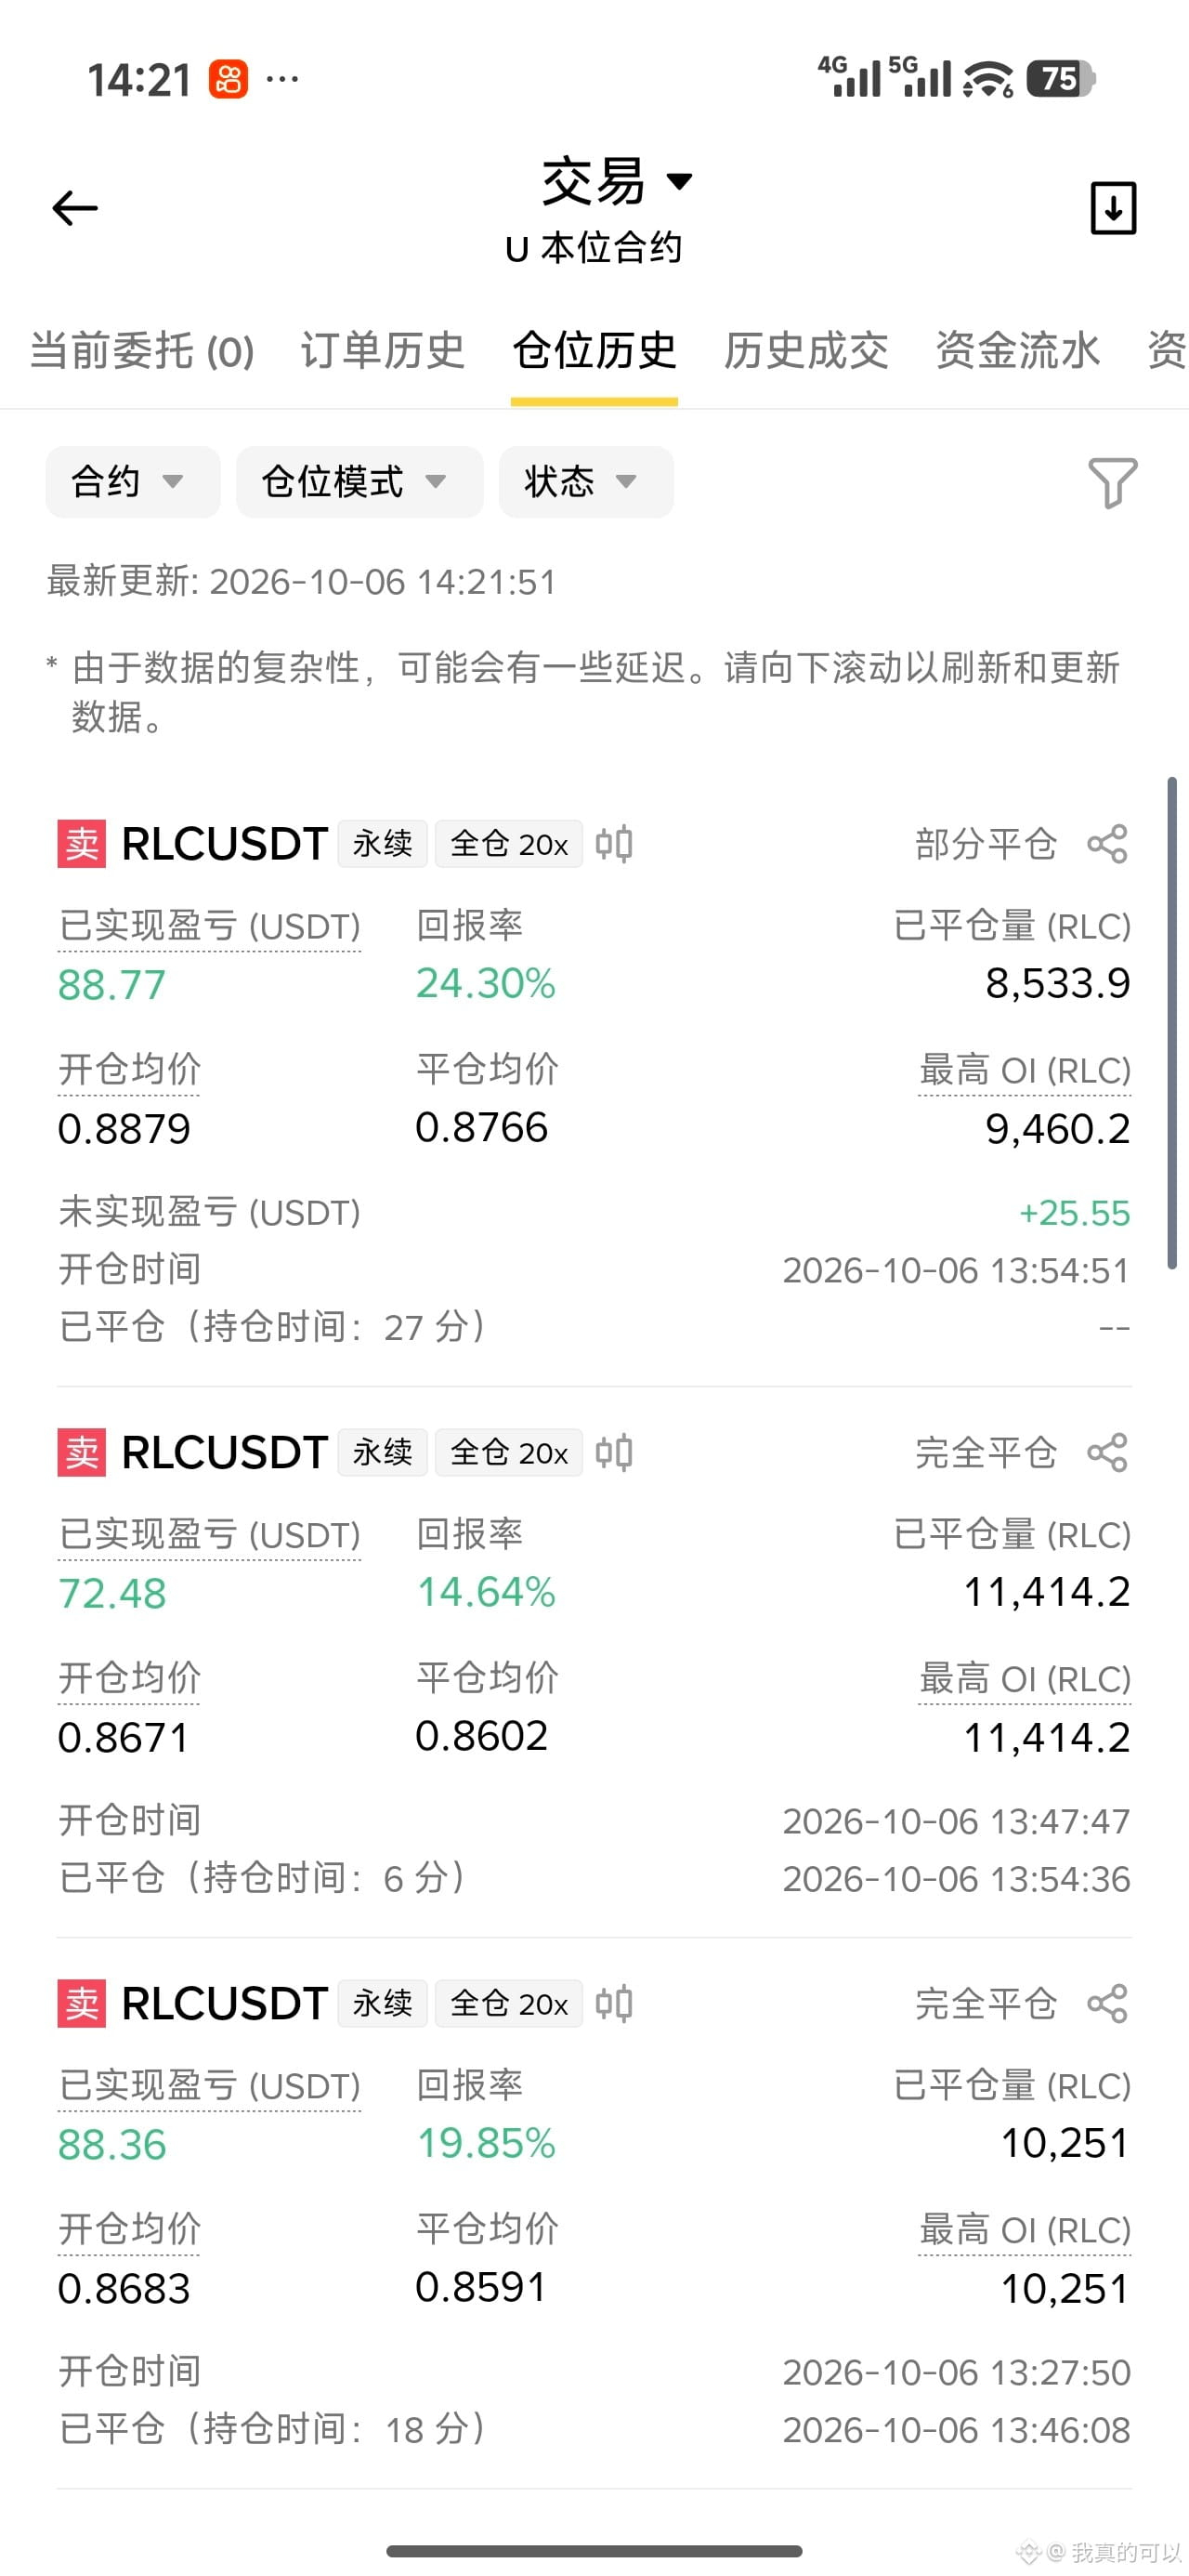
$RLC Come on, ammo's ready. Forced liquidation at $2. If you pump, I'll scalp it—unless you're a market maker's dog, don't look back.
$RLC Come on, ammo's ready. Forced liquidation at $2. If you pump, I'll scalp it—unless you're a market maker's dog, don't look back.
2
582
·
--
$RLC has been dumping shares nonstop. Can the market manipulators show a little more vision?
$RLC has been dumping shares nonstop. Can the market manipulators show a little more vision?
42
·
--
$RLC , chasing longs now is just... hard to put into words. I didn't sell during that spike just now.
$RLC , chasing longs now is just... hard to put into words. I didn't sell during that spike just now.
334
·
--
$GTC If it springs back, it's empty; if it springs back, it's empty—t feels amazing.
$GTC If it springs back, it's empty; if it springs back, it's empty—t feels amazing.
187
·
--
#GTC/USDT I can't hold this coin at all. Personally, I think it's more of a shakeout. I closed my shorts and went long.
#GTC/USDT I can't hold this coin at all. Personally, I think it's more of a shakeout. I closed my shorts and went long.
155
·
--
$GTC - First peak: 0.24880 (the peak of this rally)
Second peak: After the rebound, the price failed to break above the previous high, forming a lower peak. The price then pulled back, creating an M-shaped double top.
Neckline: 0.194–0.200 range
The current price is 0.218, within the upper range of the double top. It has already pulled back from the high but has not yet broken below the neckline.
The standard logic of a double top:
After two attempts to move higher, bullish momentum fades and the price is unable to make a new high. Once the neckline breaks, the pattern is confirmed. The theoretical downside target = peak − the distance to the neckline.
The peak is 0.2488 and the neckline is 0.194, a difference of approximately 0.0548. If the neckline breaks decisively, the downside target is around 0.14.
First peak (0.2488): a surge in volume
Trading volume increased sharply, indicating that a large amount of capital entered the market to drive prices up, as bulls concentrated their strength in the short term.
The second rebound forms the second peak: volume shrinks noticeably
This is the key signal in a double top: the rebound is not supported by sufficient volume.
The price rebounded close to the previous high, but buying pressure was far weaker than during the first rally. Bulls lacked follow-through, signaling a potential top.
Current situation: Trading volume remains fairly high during the pullback, indicating that some investors are taking profits and selling at higher levels.
New highs require rising volume; the rebound lacks volume; bullish momentum is fading
$GTC - First peak: 0.24880 (the peak of this rally)
Second peak: After the rebound, the price failed to break above the previous high, forming a lower peak. The price then pulled back, creating an M-shaped double top.
Neckline: 0.194–0.200 range
The current price is 0.218, within the upper range of the double top. It has already pulled back from the high but has not yet broken below the neckline.
The standard logic of a double top:
After two attempts to move higher, bullish momentum fades and the price is unable to make a new high. Once the neckline breaks, the pattern is confirmed. The theoretical downside target = peak − the distance to the neckline.
The peak is 0.2488 and the neckline is 0.194, a difference of approximately 0.0548. If the neckline breaks decisively, the downside target is around 0.14.
First peak (0.2488): a surge in volume
Trading volume increased sharply, indicating that a large amount of capital entered the market to drive prices up, as bulls concentrated their strength in the short term.
The second rebound forms the second peak: volume shrinks noticeably
This is the key signal in a double top: the rebound is not supported by sufficient volume.
The price rebounded close to the previous high, but buying pressure was far weaker than during the first rally. Bulls lacked follow-through, signaling a potential top.
Current situation: Trading volume remains fairly high during the pullback, indicating that some investors are taking profits and selling at higher levels.
New highs require rising volume; the rebound lacks volume; bullish momentum is fading
Second peak: After the rebound, the price failed to break above the previous high, forming a lower peak. The price then pulled back, creating an M-shaped double top.
Neckline: 0.194–0.200 range
The current price is 0.218, within the upper range of the double top. It has already pulled back from the high but has not yet broken below the neckline.
The standard logic of a double top:
After two attempts to move higher, bullish momentum fades and the price is unable to make a new high. Once the neckline breaks, the pattern is confirmed. The theoretical downside target = peak − the distance to the neckline.
The peak is 0.2488 and the neckline is 0.194, a difference of approximately 0.0548. If the neckline breaks decisively, the downside target is around 0.14.
First peak (0.2488): a surge in volume
Trading volume increased sharply, indicating that a large amount of capital entered the market to drive prices up, as bulls concentrated their strength in the short term.
The second rebound forms the second peak: volume shrinks noticeably
This is the key signal in a double top: the rebound is not supported by sufficient volume.
The price rebounded close to the previous high, but buying pressure was far weaker than during the first rally. Bulls lacked follow-through, signaling a potential top.
Current situation: Trading volume remains fairly high during the pullback, indicating that some investors are taking profits and selling at higher levels.
New highs require rising volume; the rebound lacks volume; bullish momentum is fading
110
·
--
$GTC , you can’t hold this coin with conviction—it wipes out both longs and shorts, especially gamblers with large leveraged positions.
$GTC , you can’t hold this coin with conviction—it wipes out both longs and shorts, especially gamblers with large leveraged positions.
1
188
·
--
$GTC Who are you trying to liquidate? That’s my liquidation price. I went in at $1, so I’ll take the loss.
$GTC Who are you trying to liquidate? That’s my liquidation price. I went in at $1, so I’ll take the loss.
2
1
500
·
--
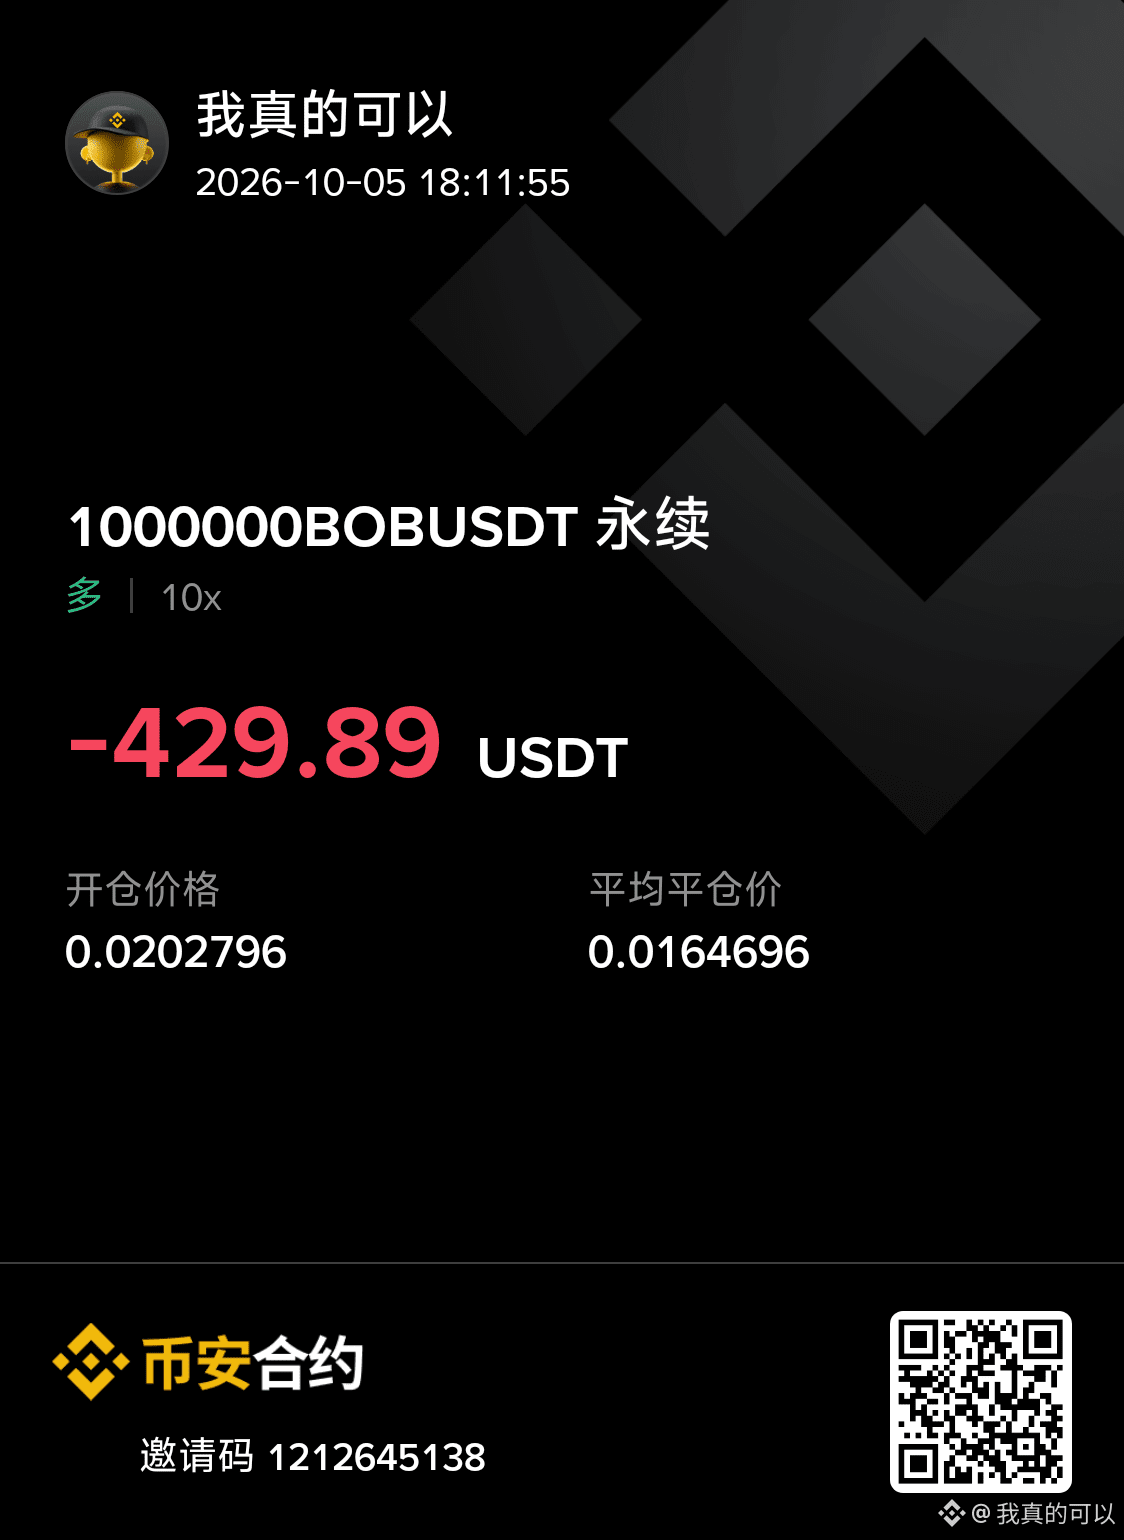
$GTC couldn't hold back, what should I do? Help, this afternoon it just blew up 600u and let me recover some losses
$GTC couldn't hold back, what should I do? Help, this afternoon it just blew up 600u and let me recover some losses
104
·
--
[https://www.binance.com/cn/futures/ref/1212645138](https://www.binance.com/cn/futures/ref/1212645138) Good night!
https://www.binance.com/cn/futures/ref/1212645138 Good night!
·
--
$AIN had sex sent a post back I really had sex damn it I won’t post again
$AIN had sex sent a post back I really had sex damn it I won’t post again
5
328
Log in to explore more content
Join global crypto users on Binance Square
⚡️ Get latest and useful information about crypto.
💬 Trusted by the world’s largest crypto exchange.
👍 Discover real insights from verified creators.
Email / Phone number
Trending Topics
BinanceLaunchesBinanceIntelligence
97,556 views
1,063 Discussing
🚨 BINANCE JUST PUT AI DIRECTLY INSIDE THE EXCHANGE — AND THIS COULD CHANGE HOW RETAIL TRADES.
Binance has officially launched Binance Intelligence, a new AI layer built into the Binance ecosystem. It combines three products:
Binance AI for everyday users,
Binance AI Pro for automated trading workflows,
and Agent OS for developers building financial agents.
The part traders should care about?
Binance AI can surface market briefs, smart alerts, PnL recaps and personalized information, while AI Pro is designed to turn a plain-English trading idea into a visual strategy workflow.
That means the next phase of exchange competition may not be:
lowest fees vs deepest liquidity.
It could be:
who gives traders the best AI execution layer.
If Binance Intelligence actually drives heavier user activity, automated strategies and higher trading frequency, watch $BNB first.
AI adoption ↑
→ Binance engagement ↑
→ trading activity ↑
→ ecosystem narrative strengthens.
The catalyst I’d watch now:
global rollout + AI Pro launch + measurable user adoption.
Because once AI stops just telling you what the market is doing…
…and starts helping build the trade itself?
That’s when this gets much bigger than another chatbot. 👀
#binancelaunchesbinanceintelligence #EvernorthXRPTreasuryCompletesSPACMerger #ADAGains10%Above$0.27 #ETHUp70%InQ3ButLiquidityFalls #EthStakingExitQueueHits2026High
KimHotbae
·30 Likes
·36.4k views
StriveBuys2000BTCFor$169M
2,677 views
48 Discussing
EvernorthXRPTreasuryCompletesSPACMerger
67,310 views
715 Discussing