

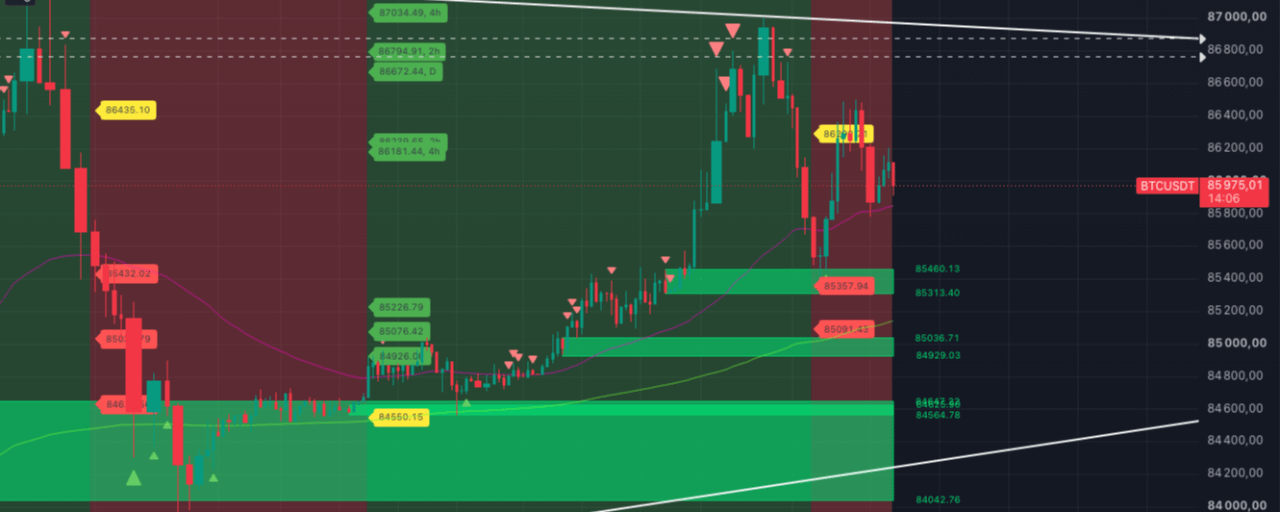


BTC started the new week with a correction, following through on the Strong signal for a potential high on the 30-minute and hourly timeframes. There was also such a signal on the 45-minute timeframe, by the way. We show it in the screenshots.
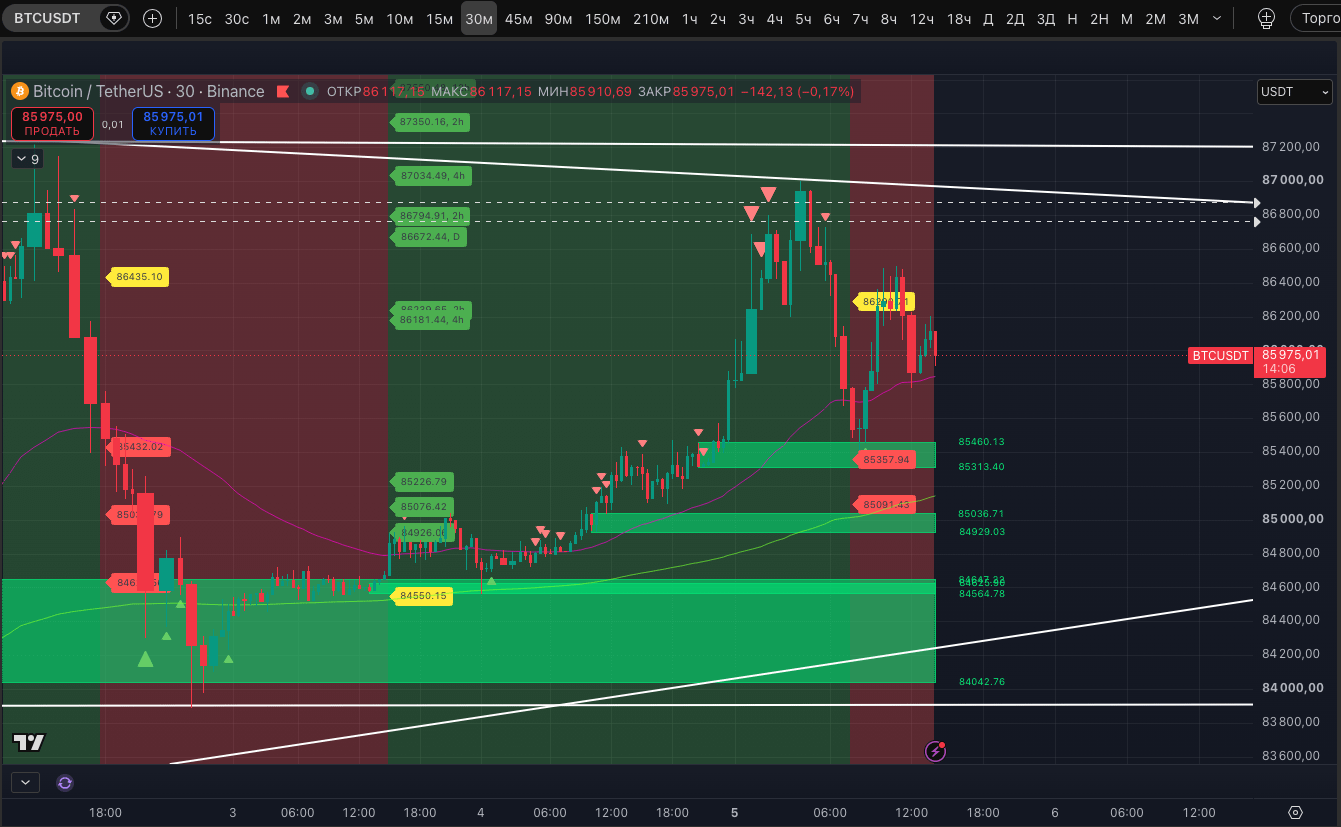
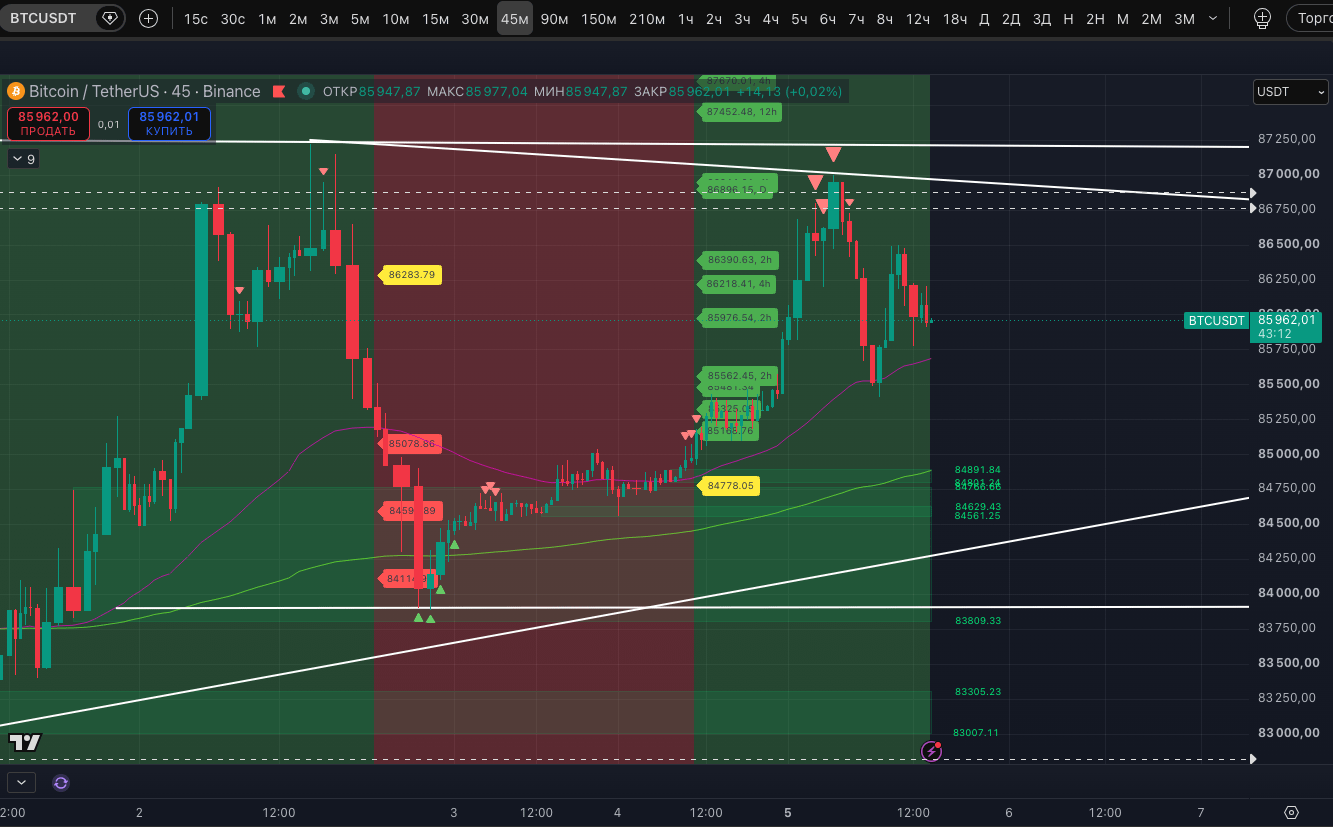
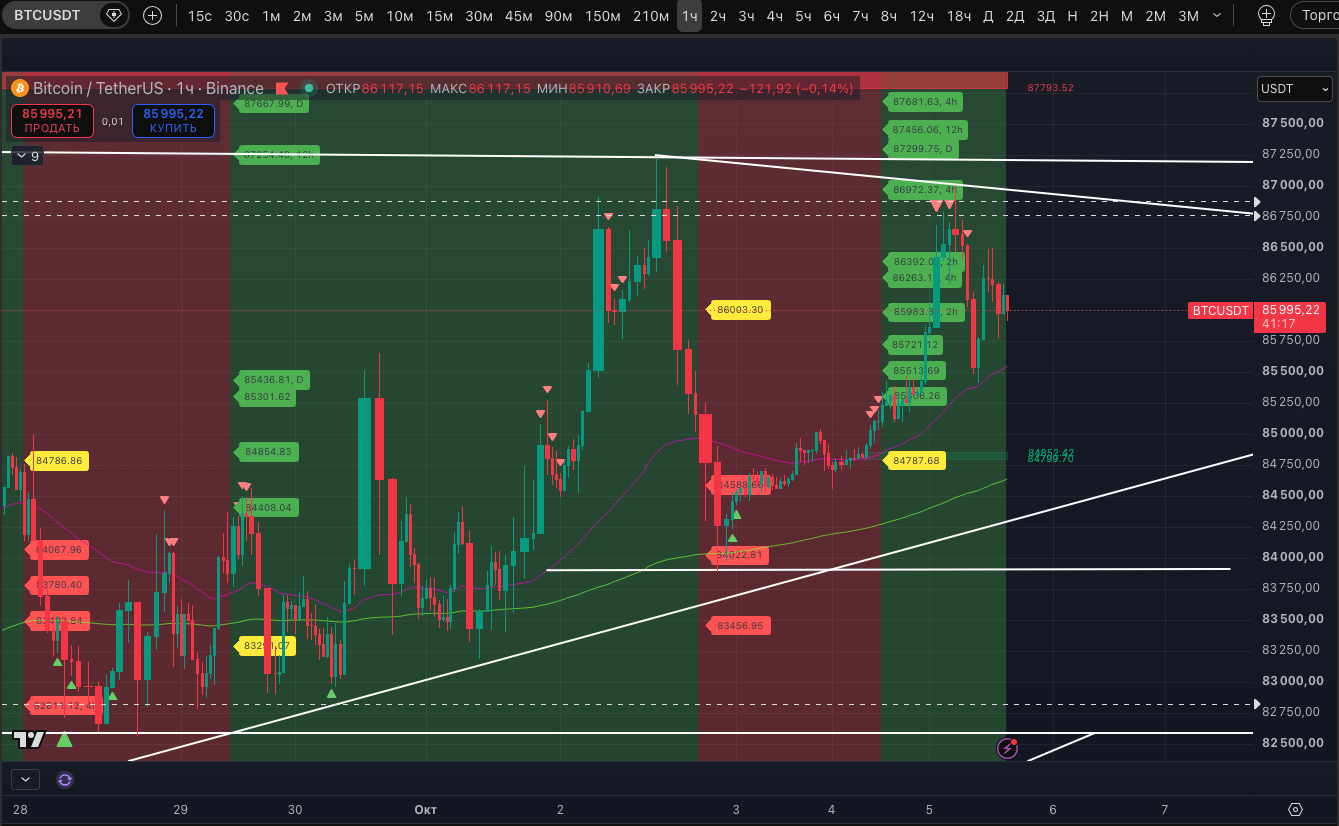
Before that, however, the asset broke through several such markers on lower, minute-based timeframes, which we showed in yesterday’s review.
Moreover, the asset made a significant higher high relative to the usual potential-high markers on the more significant 4-hour TF. This immediately suggested two opposing possibilities: EITHER a strong breakout to the upside was in the making, with sellers finding it increasingly difficult to hold back the coming impulse, OR there were important liquidity zones above that needed to be swept before the price moved down. For now, we don’t have a preferred scenario, but the trends are still on the bulls’ side. At the same time, the potential-high markers on the 5-hour TF have not been invalidated. Two potential-high markers have also appeared on each of the 6- and 7-hour TFs.
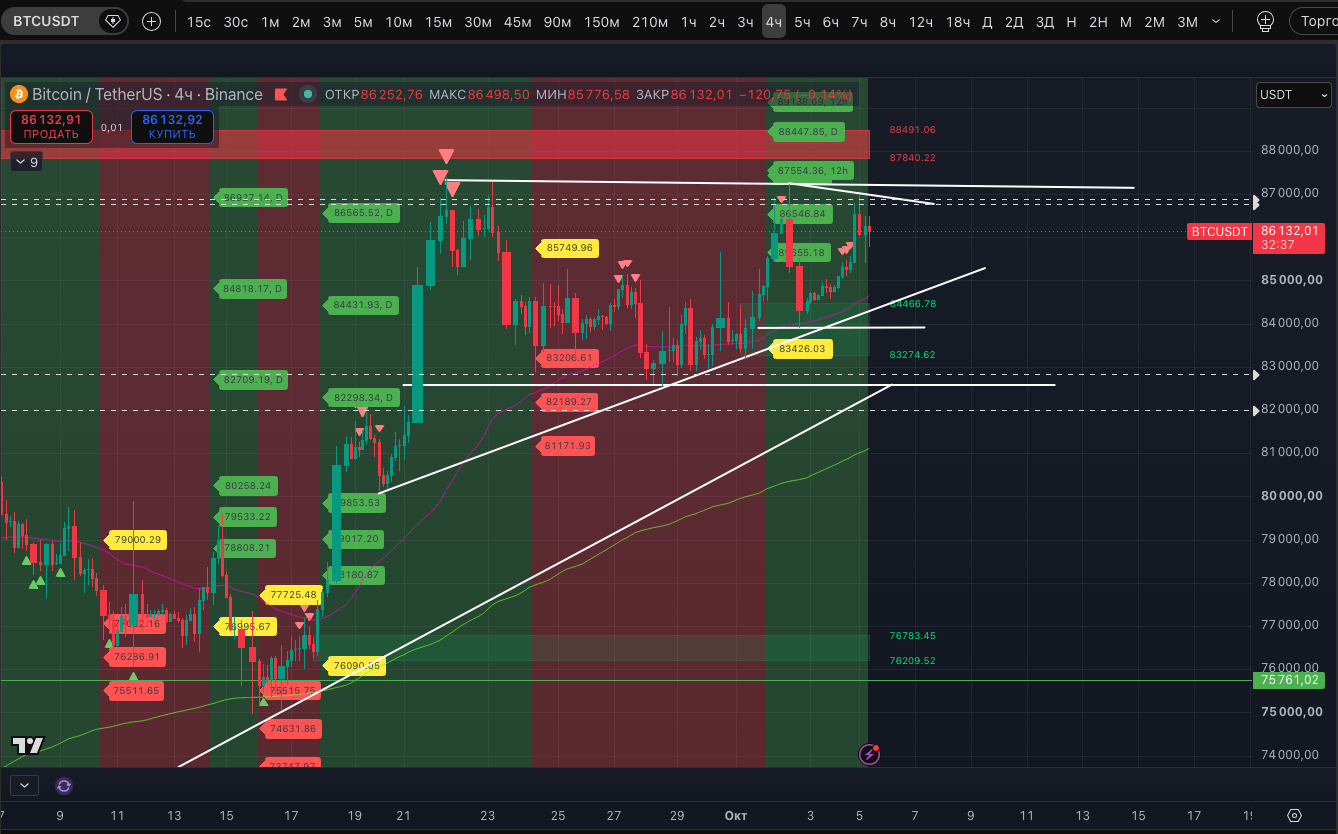
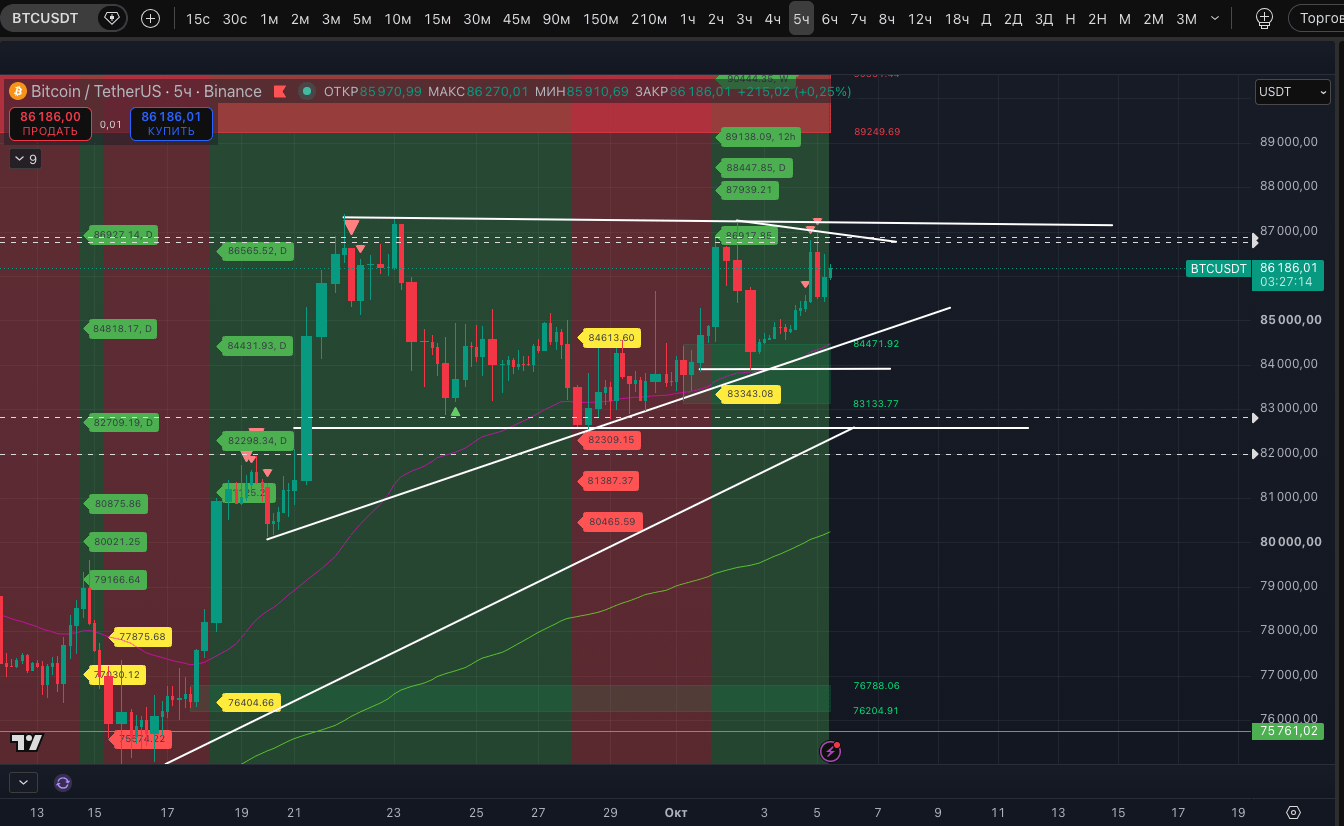
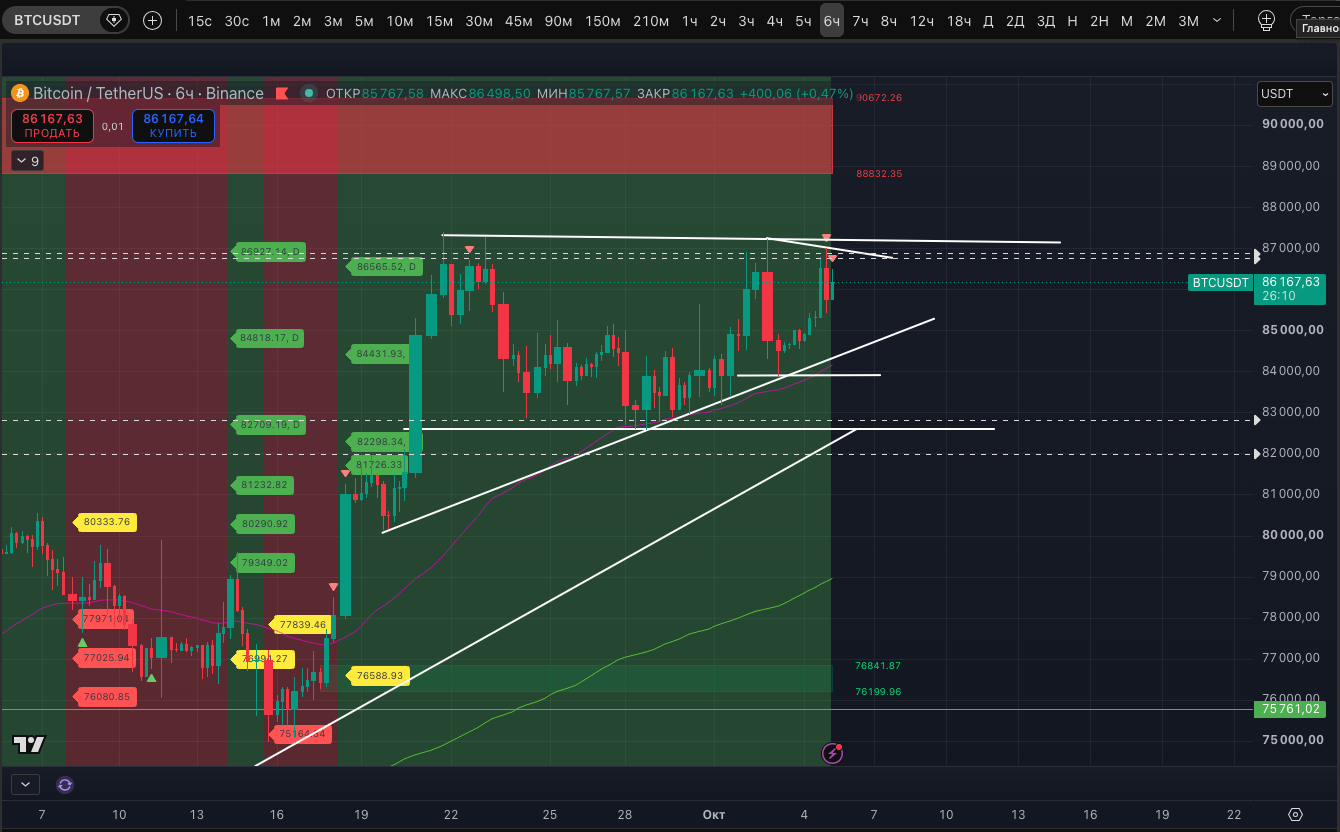
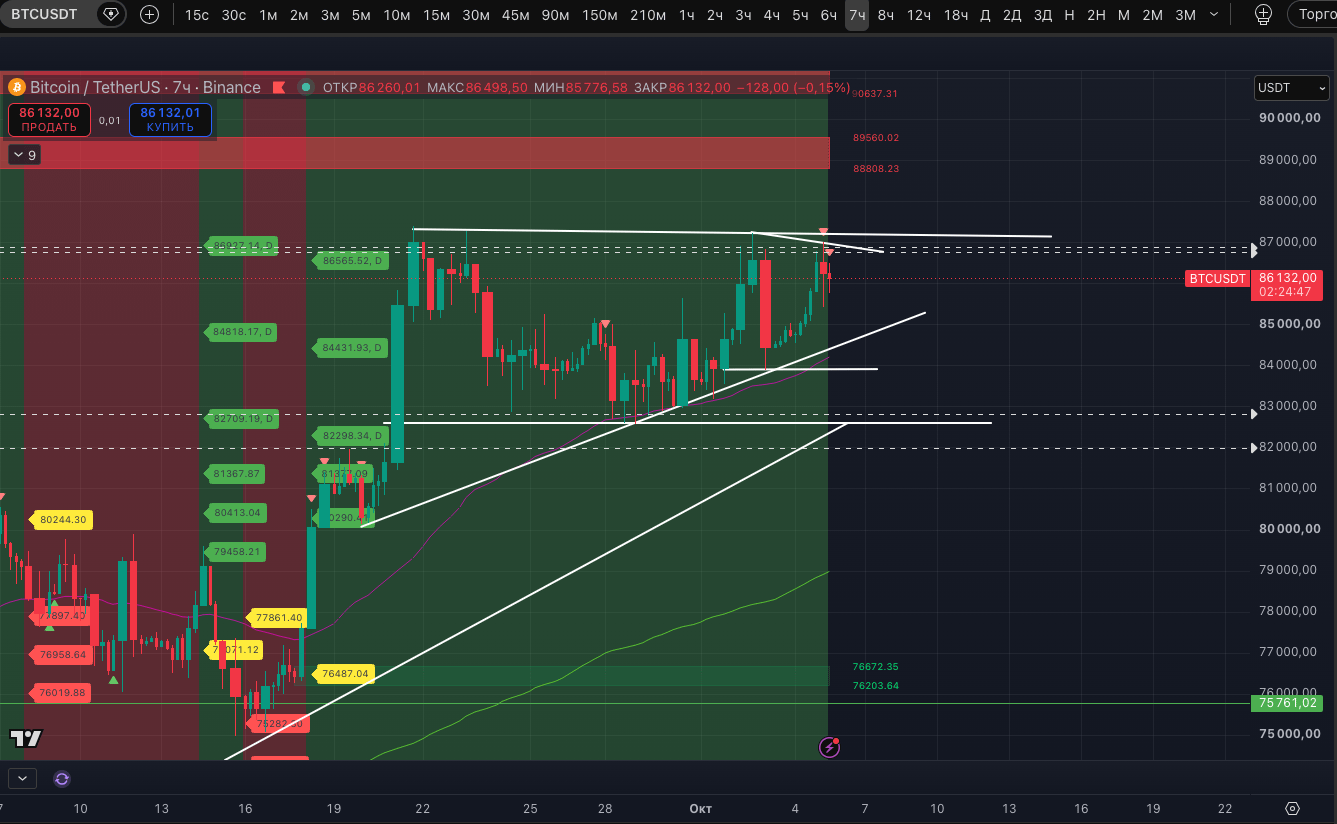
The Strong signal for a potential high on the 30-minute and 1-hour TFs made us “itch” to add to the short position, so that if the markers played out, we could move this portion of the position to breakeven. But the size of this trade is already shamelessly bloated, and it’s difficult to hold. So as long as the 3-hour TF is against the bears, we definitely won’t add to the short. But if the price enters a steady downtrend on this TF, the situation for adding to the short will become more interesting, given the significant correction signals the market is showing on the 3-day and weekly TFs.
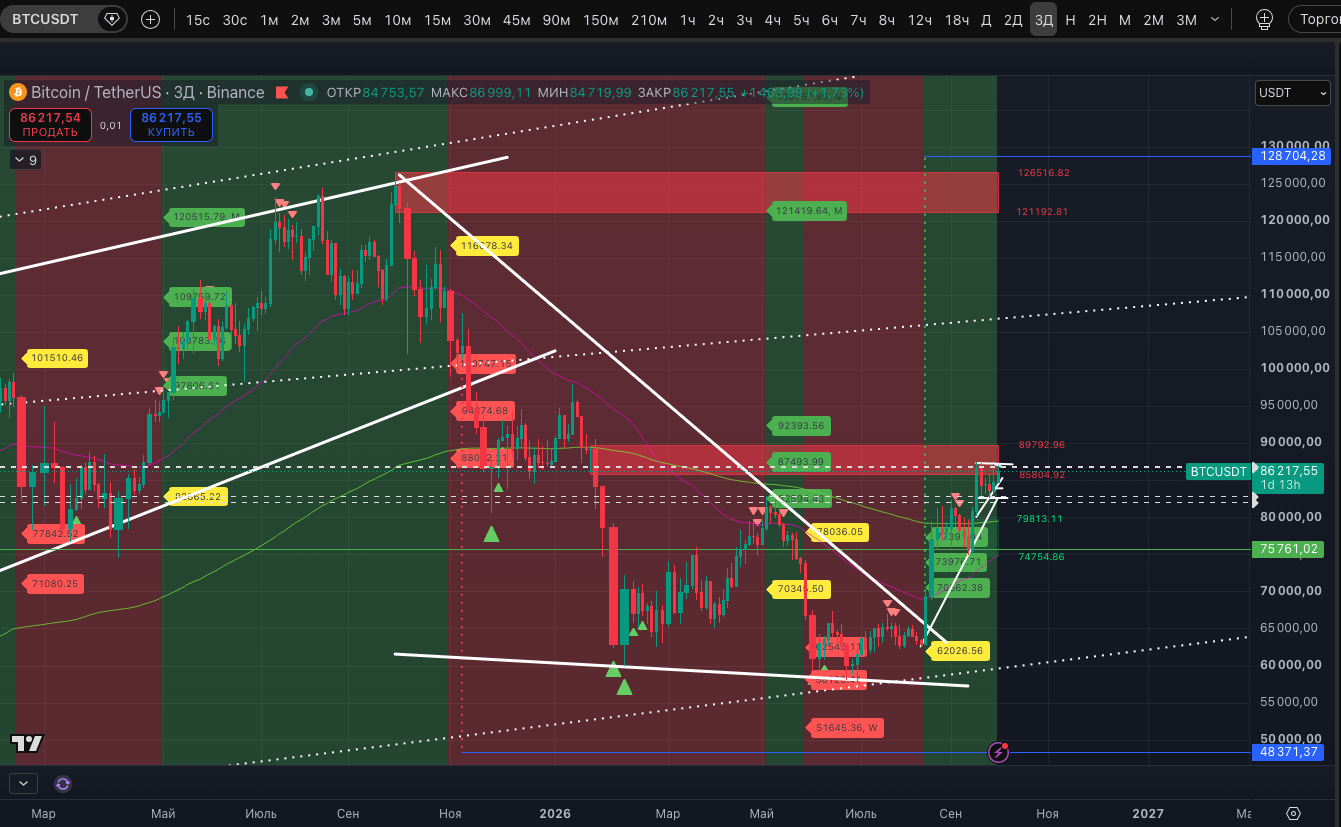
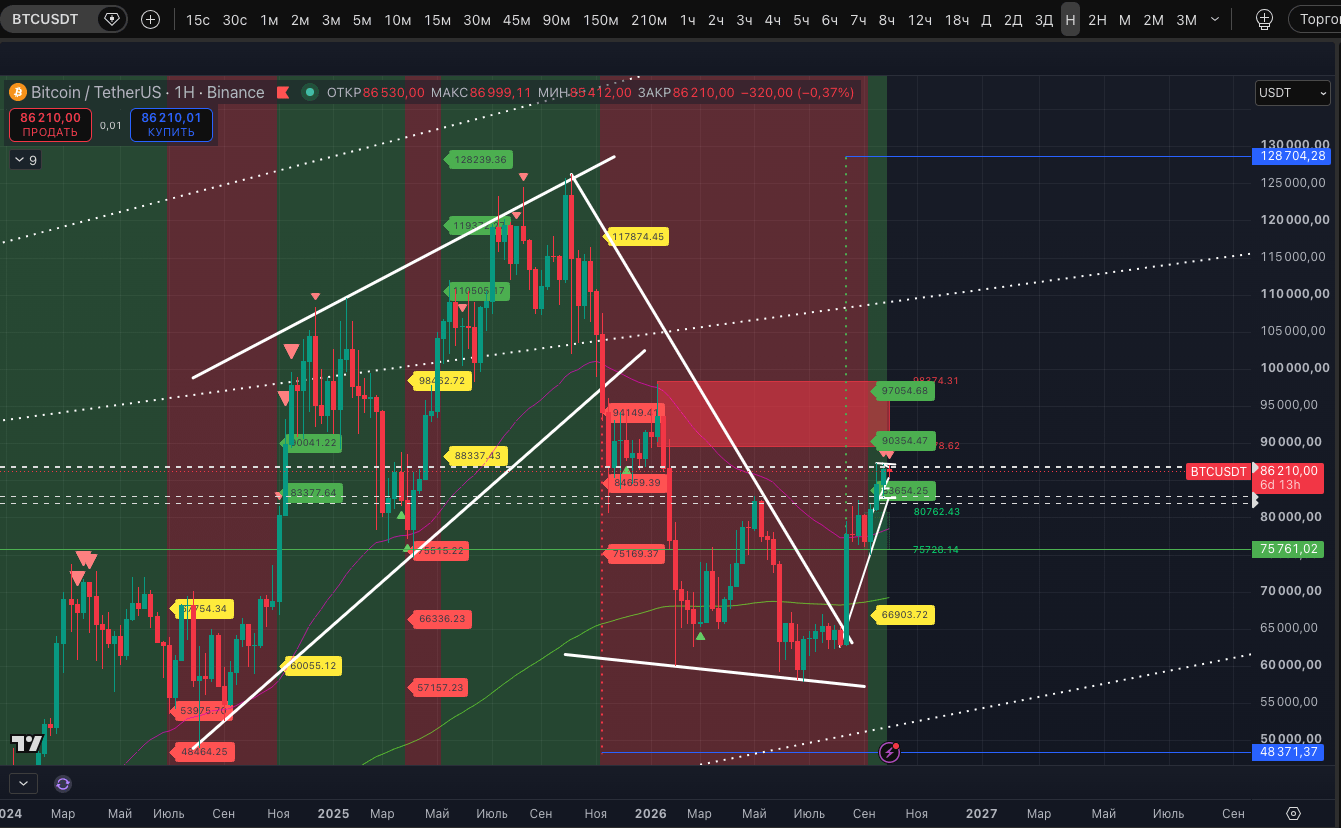
For now, we’re simply watching the situation. Although the overnight impulse momentarily absorbed Sunday’s pump, the price is currently bouncing. The entire Sunday bounce could potentially form a local “double top” on the chart during October. But we can’t count on this pattern until the price breaks the “neckline” at $83,888. If the pattern forms and plays out, it would open the way for another, larger “double top” to form and play out—the one that was taking shape throughout the August–September pump. Its possible “neckline” is at $82,563.
An important disclaimer to keep in mind during this pump: while the price remains in a steady uptrend on the 3-hour TF, expectations of a correction due to overbought conditions can be disrupted by a range and subsequent new upward impulses. Drawing arrows up in a rising market doesn’t take much skill. Our indicator always shows where the price could reach if the rise continues, using its primary and additional targets, as well as liquidity zones that “attract the price” during a trend. All of this can be seen in the screenshots we publish regularly. We believe it’s much more important right now to correctly identify a reversal, or at least attempts at one. Contrarian forecasts always carry a greater risk of being wrong.