



Key Highlights
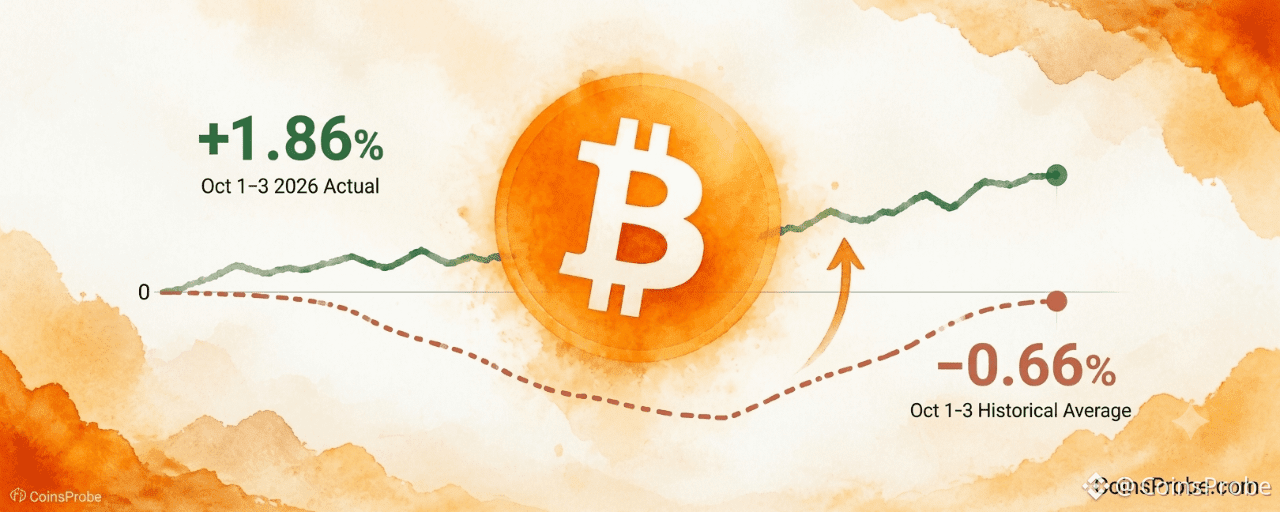
Bitcoin averaged a −0.66% return in the first three days of October, the weakest three-day stretch shown for the month.
Through October 4, the 2026 path stood at +1.86% ($85,132), outperforming the historical equivalent of about $83,023 by 252 basis points.
Historically, October averages a +13.37% return by month-end, equivalent to roughly $95,274, though this is an average—not a forecast.
Bitcoin’s first three days of October have historically been its weakest three-day stretch of the month, averaging a 0.66% decline. 2026 has already held up better. That is the sentence CryptoQuant posted on 5 October from @coinjuicehq, with the full note linked underneath.
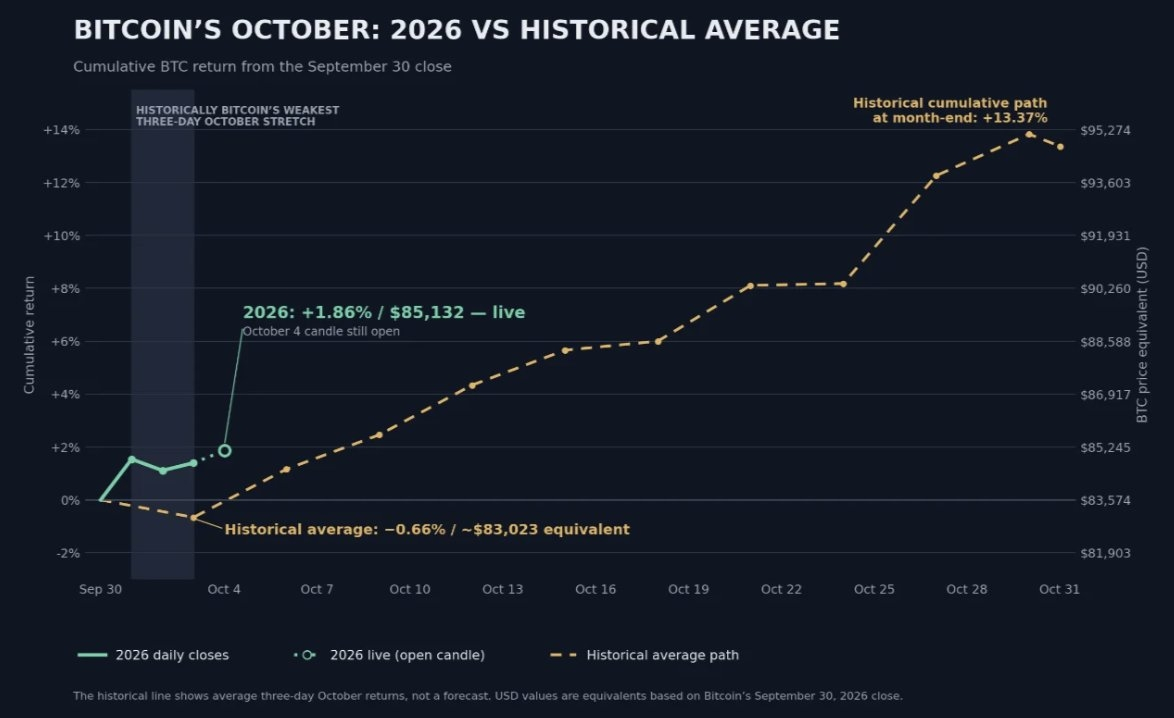
The chart attached to the post is titled “Bitcoin’s October: 2026 vs historical average.” It plots cumulative return from the 30 September close. A shaded band marks the first three days as historically the weakest three-day October stretch. The 2026 line is annotated “+1.86% / $85,132 — live,” with the note that the 4 October candle was still open. The historical average at that point is labeled “−0.66% / ~$83,023 equivalent.” By 31 October the historical path is labeled +13.37%, with the right axis printing about $95,274 at the high of that path and $93,603 just under it.
Those dollar figures are not later spot prints. The chart footer says the historical line shows average October returns, not a forecast, and that the USD values are equivalents based on Bitcoin’s 30 September 2026 close. A later trade at $85,868 or $86,016 is a different number from the +1.86% / $85,132 annotation and should not be used as the seasonal result.
Bitcoin Holds October’s Weakest Three Days | Source: @cryptoquant_com (X)
What the chart measures
The vertical axis is the cumulative percent return from the 30 September close. The right axis converts that percent path into a price using the same 30 September base. The green line is 2026 daily closes. An open circle marks the live 4 October candle. The dashed gold line is the historical average path from 30 September through 31 October.
On that scale, 2026 starts flat, rises, and is still positive at +1.86% while the historical average is still negative at −0.66%. The difference is 2.52 percentage points. From there the dashed line turns up and keeps rising into the last week of the month. The 2026 line stops at the open 4 October candle. It does not yet have a month-end reading.
The claim is narrower than “weakest stretch in Bitcoin’s calendar.” The tweet says weakest three-day stretch of the month. The chart says weakest three-day October stretch. Neither source ranks this window against January, March, or any other month.
What the outperformance confirms
It confirms that, on this chart and through an open 4 October candle, 2026 was above the historical average for October’s weakest three-day window. The 2026 path had not taken the average −0.66% decline. Relative to the 30 September close used on the chart, it was up 1.86%.
It does not confirm a directional trade, a month-end target, or that the seasonal drag has been removed for the rest of October. The +13.37% month-end figure is the average of past Octobers on this chart. The footer says it is not a forecast. Years inside an average can finish far above or below it, and the note does not publish the sample size, the median, or the worst October.
How the price labels work
The $85,132 mark is the chart’s translation of +1.86% from the 30 September close, not a claim that Bitcoin was trading at $85,132 at publication. The ~$83,023 mark is the same translation of −0.66%. The gap between those two equivalents is about $2,109 on the chart’s scale. Describing Bitcoin as “$2,845 above where seasonality said it would be” mixes a later spot price with the historical equivalent and is not the comparison the chart makes.
The right axis runs from about $81,903 to $95,274. Those are equivalents of the percent scale, not support and resistance levels identified by @coinjuicehq.
What the path after 4 October does not say
After the shaded window, the dashed line rises through mid-month and is labeled +13.37% at month-end. That is the historical average path. Surviving the first three days above zero does not, on this chart, mean 2026 will follow the dashed line to $93,603–$95,274.
If someone applies +13.37% to the 30 September base used on the chart, the right axis already prints the result: near $95,274 at the high of the historical path. That arithmetic is a description of the chart, not a 31 October target. Applying +13.37% to a different opening price, such as $83,600, produces a different number and is not what the chart does.
The level that would erase the observation is a 2026 close back through the historical equivalent of about $83,023, meaning the cumulative return from 30 September would no longer be ahead of the −0.66% average. The source does not call that level a trade signal.
A separate note, not this chart
Axel Adler Jr.’s 4 October Power Law Quicktake is a different publication. It said the oscillator was +34.5 on 3 October with Bitcoin at $84,700, and that the +100 threshold mapped to $157,800 under those parameters, about 86% above that print. He called $157,800 a reference level that rises with the Power Law line if the parameters stay fixed. It is not the fair value of this seasonal chart, and it is not an input to the −0.66% or +1.86% figures. The two notes should not be merged into one target.
What the model says, and what it does not
It says the first three days of October have averaged a 0.66% decline, that this is the weakest three-day stretch of the month on this chart, and that 2026 was at +1.86% / $85,132 while that average was still at −0.66% / ~$83,023. It also says the historical path averages +13.37% by 31 October.
It does not say this is the weakest three-day stretch of any month. It does not say October will finish at +13.37%, or at $94,800, or at $95,274. It does not give a sample size. The 4 October candle was still open when the chart was labeled.
Frequently asked questions
What does the −0.66% figure mean?
It is the historical average cumulative return for the first three days of October, measured from the 30 September close on the @coinjuicehq chart. The tweet calls that window the weakest three-day stretch of the month.
What is the 2026 reading?
+1.86%, labeled $85,132, with the 4 October candle still open. That is 252 basis points above the −0.66% average. The matching historical equivalent on the chart is about $83,023.
Does +13.37% mean October ends near $95,000?
No. +13.37% is the historical average path at month-end. The chart’s right axis puts that path near $95,274. The footer says the line is not a forecast, and the dollar values are equivalents of the 30 September 2026 close.
What would remove the “held up better” claim?
A 2026 cumulative return from 30 September that is no longer above the −0.66% average. On the chart’s scale that average is about $83,023. The source does not define that price as a buy or sell level.
Disclaimer: The views and analysis presented in this article are for informational purposes only and reflect the author’s perspective, not financial advice. Technical patterns and indicators discussed are subject to market volatility and may or may not yield anticipated results. Investors are advised to exercise caution, conduct independent research, and make decisions aligned with their individual risk tolerance.