

瑾怡Joy
55 Posts

瑾怡Joy
区块链,加密货币爱好者,一级投研,专注于社区共识 共建 共享 共赢…(四两拨千斤)
Occasional Trader
3.1 Years
100 Following
9.9K+ Followers
2.5K+ Liked
Posts
All
Quotes
PINNED


黑猫SabTheTrader
·
--
🐱 Live time of Sab the Black Cat 🧡
I’ve recently started streaming on the Binance Square. Going forward, unless something special comes up, I’ll be streaming at:
🗓️ Monday to Friday
🕘 21:00–23:00 (evening)
The stream mainly covers what I normally do every day:
📈 Watching the Nasdaq 100 (NQ) spot market
📝 Pre-market plans, key levels, and waiting for setups
🎯 Entry/exit ideas and Price Action
If the NQ session ends early, we’ll also take a look at BTC, ETH, and the more active cryptocurrencies that evening.
My livestream might be a bit different from the lively chatrooms (welcome to the introvert’s livestream, haha).
Most of the time, I’ll just play some light music while I normally monitor the market. If there’s something worth talking about, I’ll share it. If there isn’t a suitable setup, we’ll wait together—I won’t force trades just for the sake of streaming (●'◡'●) (Trading is actually something that requires a lot of patience and emotional control.)
The stream is mainly in Chinese—English is also welcome.
If I ever have to cancel a stream last minute, or if the timing changes, I’ll let everyone know in advance on the Square.
Monday to Friday, at 9 PM.
If you want to see how I trade in my everyday life, come to the livestream.🐱
I’ve recently started streaming on the Binance Square. Going forward, unless something special comes up, I’ll be streaming at:
🗓️ Monday to Friday
🕘 21:00–23:00 (evening)
The stream mainly covers what I normally do every day:
📈 Watching the Nasdaq 100 (NQ) spot market
📝 Pre-market plans, key levels, and waiting for setups
🎯 Entry/exit ideas and Price Action
If the NQ session ends early, we’ll also take a look at BTC, ETH, and the more active cryptocurrencies that evening.
My livestream might be a bit different from the lively chatrooms (welcome to the introvert’s livestream, haha).
Most of the time, I’ll just play some light music while I normally monitor the market. If there’s something worth talking about, I’ll share it. If there isn’t a suitable setup, we’ll wait together—I won’t force trades just for the sake of streaming (●'◡'●) (Trading is actually something that requires a lot of patience and emotional control.)
The stream is mainly in Chinese—English is also welcome.
If I ever have to cancel a stream last minute, or if the timing changes, I’ll let everyone know in advance on the Square.
Monday to Friday, at 9 PM.
If you want to see how I trade in my everyday life, come to the livestream.🐱

黑猫SabTheTrader
·
--
Greed Index 68, $BTC — should you chase or run? I went through the data from the past four years 👀
When people see “the market is greedy,” some want to chase the rally, while others prepare to short. But the same 68 can lead to completely different outcomes.
💡 I looked at the dates from October 4, 2022 to October 3, 2026 when Alternative.me was exactly 68, and there were 19 of them. Using the BTC daily close on those dates as the reference:
▸ 7 days later, 10 rises and 9 falls;
▸ 30 days later, also 10 rises and 9 falls.
Note that these 19 dates include consecutive or adjacent samples, and the follow-up observation windows also overlap. They cannot be treated as 19 independent trades, and 10/19 should not be packaged as a long-only win rate. The sample is small, and fees are not deducted.
Looking at a few examples makes the difference clearer:
1️⃣ On April 14, 2023, the index was 68.
BTC closed at about $30,500 that day, fell about 10.5% 7 days later, and about 11.7% 30 days later. Sentiment was hot, but price still pulled back.
2️⃣ On November 7, 2023, the index was also 68.
BTC closed at about $35,400, rose about 0.3% 7 days later, and about 22.2% 30 days later. If you assume a top just because greed appears, you might get out too early.
3️⃣ On July 26, 2024, it was 68 again.
BTC closed at about $67,900, fell about 9.6% 7 days later, and about 5.3% 30 days later. The same reading did not replicate the previous rally.
4️⃣ On June 17, 2025, the index was 68.
BTC closed at about $104,600, rose about 1.4% 7 days later, and about 14.0% 30 days later. Greed can also accompany trend continuation.
These comparisons remind me: one number cannot capture the trend, buying pressure, and market environment at that moment.
And Alternative.me’s calculation itself already includes price movement, momentum, and volume. When price rises, it can push the index higher; then using the index to prove “price will keep rising” can easily circle back to the starting point.
I’d look one step further: did this 68 rise gradually from fear, or did it retreat from an even greedier level? Is price holding after a breakout, or repeatedly spiking and fading?
Tonight, on Sunday, I’ll also keep an eye on the tape. If it breaks out and then retests and holds, I’ll keep watching for continuation; if it spikes and falls back into the range, I’ll lower my expectations of chasing. Especially in leveraged trading, don’t use an emotion gauge as a reason to add size. 🙈
Price action has the final say.
* NFA, DYOR
#比特币冲击8.7万美元遇阻回落
When people see “the market is greedy,” some want to chase the rally, while others prepare to short. But the same 68 can lead to completely different outcomes.
💡 I looked at the dates from October 4, 2022 to October 3, 2026 when Alternative.me was exactly 68, and there were 19 of them. Using the BTC daily close on those dates as the reference:
▸ 7 days later, 10 rises and 9 falls;
▸ 30 days later, also 10 rises and 9 falls.
Note that these 19 dates include consecutive or adjacent samples, and the follow-up observation windows also overlap. They cannot be treated as 19 independent trades, and 10/19 should not be packaged as a long-only win rate. The sample is small, and fees are not deducted.
Looking at a few examples makes the difference clearer:
1️⃣ On April 14, 2023, the index was 68.
BTC closed at about $30,500 that day, fell about 10.5% 7 days later, and about 11.7% 30 days later. Sentiment was hot, but price still pulled back.
2️⃣ On November 7, 2023, the index was also 68.
BTC closed at about $35,400, rose about 0.3% 7 days later, and about 22.2% 30 days later. If you assume a top just because greed appears, you might get out too early.
3️⃣ On July 26, 2024, it was 68 again.
BTC closed at about $67,900, fell about 9.6% 7 days later, and about 5.3% 30 days later. The same reading did not replicate the previous rally.
4️⃣ On June 17, 2025, the index was 68.
BTC closed at about $104,600, rose about 1.4% 7 days later, and about 14.0% 30 days later. Greed can also accompany trend continuation.
These comparisons remind me: one number cannot capture the trend, buying pressure, and market environment at that moment.
And Alternative.me’s calculation itself already includes price movement, momentum, and volume. When price rises, it can push the index higher; then using the index to prove “price will keep rising” can easily circle back to the starting point.
I’d look one step further: did this 68 rise gradually from fear, or did it retreat from an even greedier level? Is price holding after a breakout, or repeatedly spiking and fading?
Tonight, on Sunday, I’ll also keep an eye on the tape. If it breaks out and then retests and holds, I’ll keep watching for continuation; if it spikes and falls back into the range, I’ll lower my expectations of chasing. Especially in leveraged trading, don’t use an emotion gauge as a reason to add size. 🙈
Price action has the final say.
* NFA, DYOR
#比特币冲击8.7万美元遇阻回落


慢就是快Mike8
·
--
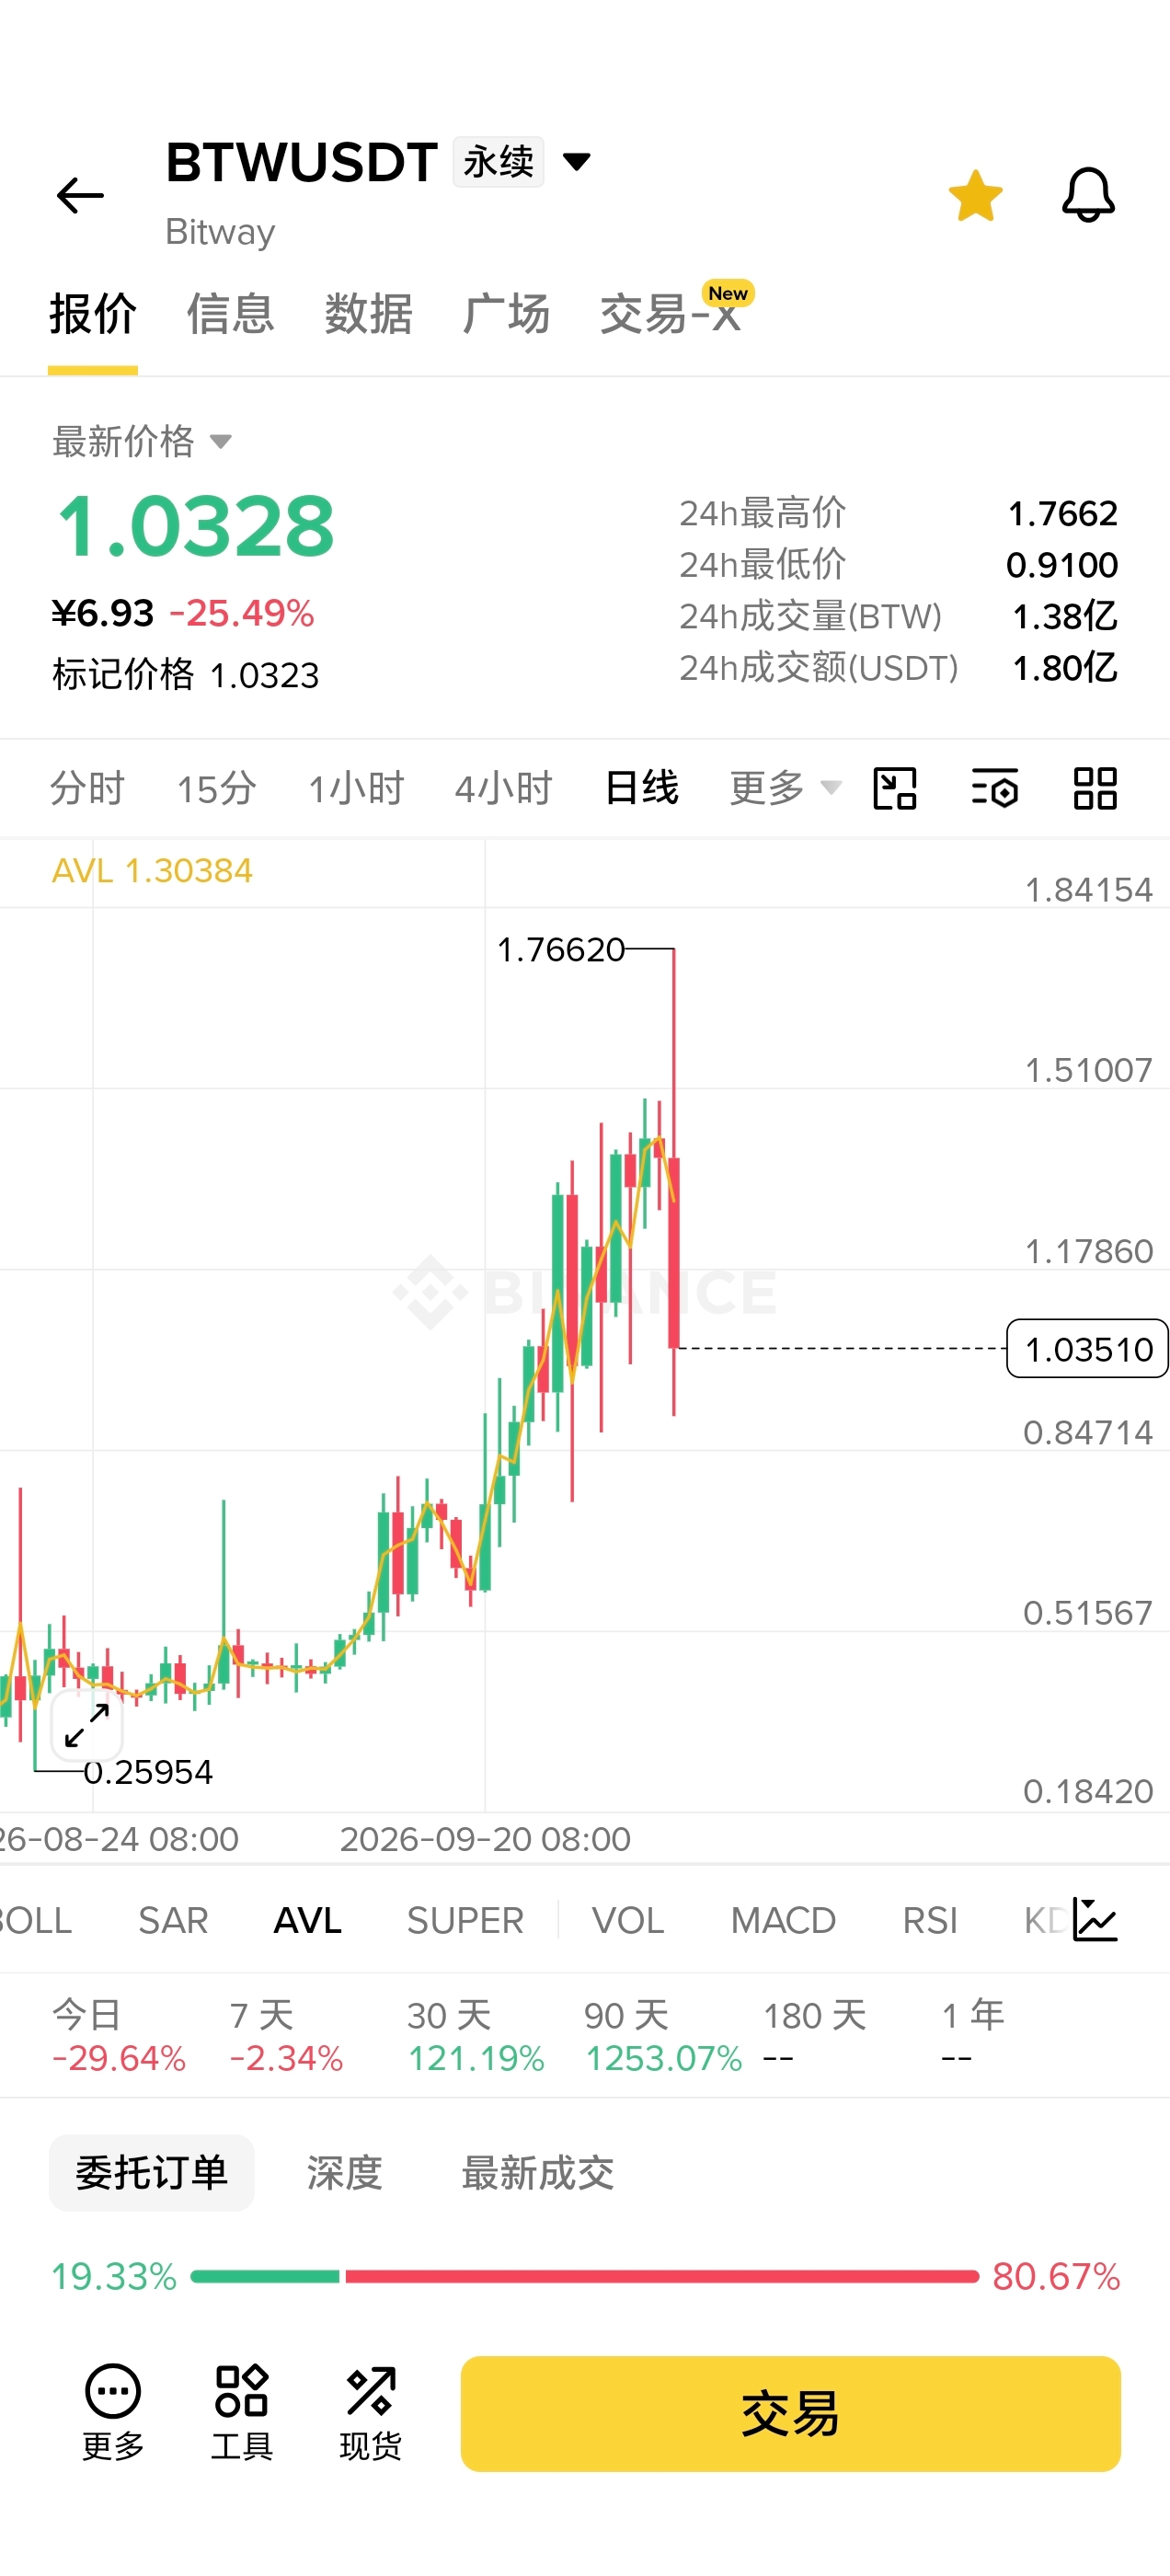
$BTW is too serious in controlling the market; both long and short sides are being strangled!


三生半仙
·
--
Follow the half-immortal for updates on strategies 🧧🧧 (regular updates guaranteed)
三生半仙
·
--
Come claim your red envelope 🧧🧧🧧—the bottom is in!
慢就是快Mike8
·
--
$BTW is too serious in controlling the market; both long and short sides are being strangled!

Mira小白桃
·
--
10.03 - 10.04|What should the broader market watch next?
The weekend is here—actually it’s a better time to slow down the pace a bit.
After BTC’s earlier rapid sweep of the market, it has now returned to trading in a tight range around 84,600. The momentum on the short term (1H–4H) isn’t particularly strong, but the daily structure has not shown clear signs of being broken. So for now, I won’t decide that the trend has reversed just because of a few candlesticks.
Next, I’ll focus on two key areas:
Around 84,000 is the first short-term support/consolidation point. If the weekend pullback can dip here and hold firm, there’s still room for the price to probe higher.
Up above, first watch 85,000–85,500. Whether price can break through and hold there will directly affect the next step in the trading rhythm.
If 84K is lost, don’t try to catch it. Then focus below on the 82,000–83,000 zone. This area is also a key support that some analysts have been repeatedly paying attention to recently.
As for ETH, it’s currently around 2,670, and overall it’s still ranging around 2,700.
Here I’ll treat 2,700 as the short-term boundary. What truly needs to be broken is the 2,750–2,800 region. Recently the market has been paying a lot of attention to this level—multiple tests have happened, but an effective breakout hasn’t formed yet.
Down below, the focus is 2,620–2,650. If there’s a clear show of support after a pullback, there should still be an opportunity to do a swing trade over the weekend.
So my weekend plan is very simple:
For BTC: look for support around 84K, and a breakout around 85.5K.
For ETH: look for support around 2.65K, and a breakout around 2.8K.
Until it’s confirmed, don’t chase and don’t rush to guess the top.
Weekend liquidity tends to change easily. I’d rather do a little less than disrupt the rhythm for the sake of a few candlesticks.
Wait for the levels, wait for confirmation—then leave the rest to the market.
The weekend is here—actually it’s a better time to slow down the pace a bit.
After BTC’s earlier rapid sweep of the market, it has now returned to trading in a tight range around 84,600. The momentum on the short term (1H–4H) isn’t particularly strong, but the daily structure has not shown clear signs of being broken. So for now, I won’t decide that the trend has reversed just because of a few candlesticks.
Next, I’ll focus on two key areas:
Around 84,000 is the first short-term support/consolidation point. If the weekend pullback can dip here and hold firm, there’s still room for the price to probe higher.
Up above, first watch 85,000–85,500. Whether price can break through and hold there will directly affect the next step in the trading rhythm.
If 84K is lost, don’t try to catch it. Then focus below on the 82,000–83,000 zone. This area is also a key support that some analysts have been repeatedly paying attention to recently.
As for ETH, it’s currently around 2,670, and overall it’s still ranging around 2,700.
Here I’ll treat 2,700 as the short-term boundary. What truly needs to be broken is the 2,750–2,800 region. Recently the market has been paying a lot of attention to this level—multiple tests have happened, but an effective breakout hasn’t formed yet.
Down below, the focus is 2,620–2,650. If there’s a clear show of support after a pullback, there should still be an opportunity to do a swing trade over the weekend.
So my weekend plan is very simple:
For BTC: look for support around 84K, and a breakout around 85.5K.
For ETH: look for support around 2.65K, and a breakout around 2.8K.
Until it’s confirmed, don’t chase and don’t rush to guess the top.
Weekend liquidity tends to change easily. I’d rather do a little less than disrupt the rhythm for the sake of a few candlesticks.
Wait for the levels, wait for confirmation—then leave the rest to the market.


慢就是快Mike
·
--
[Ended] 🎙️ When will the market start? Enter to get the latest wealth secrets!
7.9k listens
钞机八蛋
·
--
Good morning, family and friends! We will not broadcast for now since we are going out. Thank you!



Hawk自由哥
·
--
#Hawk Community insists on long-term development 🧧🧧🧧
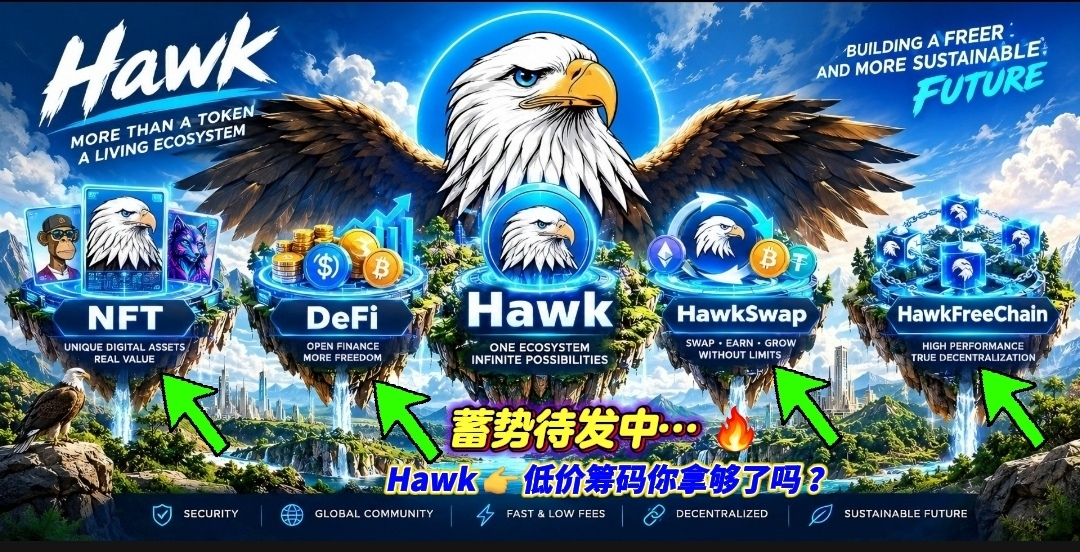
In the future, we will steadily build our own ecosystem, including HawkSwap, the Hawk Freedom Protocol public chain, and HawkNFT digital collectibles, creating a multidimensional “decentralized” digital home. #Hawk upholds the concepts of maintaining ecological balance 🍃 and freedom of communication—this is a long-lasting and great endeavor. We sincerely invite every partner who recognizes “decentralization,” yearns for freedom, and agrees with the idea of free speech as advocated by Musk to join the Hawk family and walk alongside us. Together, let’s help protect the natural ecosystem, pass on the value of freedom, and contribute our part to the advancement of human civilization! #股票财报季 #美国8月核心PCE降至3%
In the future, we will steadily build our own ecosystem, including HawkSwap, the Hawk Freedom Protocol public chain, and HawkNFT digital collectibles, creating a multidimensional “decentralized” digital home. #Hawk upholds the concepts of maintaining ecological balance 🍃 and freedom of communication—this is a long-lasting and great endeavor. We sincerely invite every partner who recognizes “decentralization,” yearns for freedom, and agrees with the idea of free speech as advocated by Musk to join the Hawk family and walk alongside us. Together, let’s help protect the natural ecosystem, pass on the value of freedom, and contribute our part to the advancement of human civilization! #股票财报季 #美国8月核心PCE降至3%

520龙行天下
·
--
🌏【Main Title】
Iterative Radar’s Underlying Ecosystem Mechanism Rebuilds the Enduring On-Chain Value
🌏【Subtitle】
Break through the industry’s outdated drawbacks—forge a long-lasting track with fair deflation
📅 【Time】October 4, 2026 21:00 (UTC+8)
🎬 【Live Location】
Binance Square 520 Dragon Riding in the World @520龙行天下 Live Room
🌕【Intro】
As the chain-sea iterates and sails through changing tides, the track’s true strength reveals itself in what endures. Looking back at the rise and fall of radar ecosystems over the years, countless projects have been trapped by five major industry ailments: centralized control, runaway inflation, big-cap capital monopoly, rigid class hierarchies, and a market with no support. For a time, short-term hype may roar loudly—but it ultimately cannot escape the destiny of consensus collapse, short cycles, and zero-at-crash.
The industry’s real bottleneck is not a lack of traffic, but underlying mechanisms that have remained unchanged for centuries. What the market is truly scarce in, is revolutionary-level ecosystem change that dares to overthrow old rules, rebuild fairness, strictly control inflation, provide funding backstops, and achieve self-governed sustainability.
The SGY chain’s point of origin emerges in the right moment. Built on the BSC decentralized public-chain foundation, it is fully open-source, abandons permissioning, has no backdoors, and is purely community self-governance. With six major disruptive underlying innovations, it completely cures all stubborn issues of traditional radars.
Today’s blockbuster: a peak AMA—gathering seasoned KOLs across the web, top-notch research and investment experts, and top-tier hosts. We’ll break down the SGY innovation logic step by step, deeply decode the on-chain stable wealth model, help you see through the essence of cycles, seize the opportunities of the singularity, and set out together on a new journey toward long-term, effective mutual benefit on-chain!
🎤 Special Host (Host)
🎙Gold-medal host in the Web3 field 👉🏻 Li Qian Grace @梨浅Grace
🎙Co-host 👉🏻 Xu Hao Media @旭好传媒
👥【Featured Heavyweight Guests】(Speakers)
🔹MAX @台湾Max |Industry veteran blockchain expert
🔹MAGGIE @Maggie 965841|Industry veteran blockchain expert
🔹Dragon Riding in the World @520龙行天下 |74K Binance Square gold badge host
🔹Money Machine Baa Dan @钞机八蛋 |80K Binance Square gold badge host
🔹Dehui @DeHui德惠VC |37K Binance Square gold badge host
🔹Xiao Jiu @win小酒 |56K Binance Square gold badge host
Iterative Radar’s Underlying Ecosystem Mechanism Rebuilds the Enduring On-Chain Value
🌏【Subtitle】
Break through the industry’s outdated drawbacks—forge a long-lasting track with fair deflation
📅 【Time】October 4, 2026 21:00 (UTC+8)
🎬 【Live Location】
Binance Square 520 Dragon Riding in the World @520龙行天下 Live Room
🌕【Intro】
As the chain-sea iterates and sails through changing tides, the track’s true strength reveals itself in what endures. Looking back at the rise and fall of radar ecosystems over the years, countless projects have been trapped by five major industry ailments: centralized control, runaway inflation, big-cap capital monopoly, rigid class hierarchies, and a market with no support. For a time, short-term hype may roar loudly—but it ultimately cannot escape the destiny of consensus collapse, short cycles, and zero-at-crash.
The industry’s real bottleneck is not a lack of traffic, but underlying mechanisms that have remained unchanged for centuries. What the market is truly scarce in, is revolutionary-level ecosystem change that dares to overthrow old rules, rebuild fairness, strictly control inflation, provide funding backstops, and achieve self-governed sustainability.
The SGY chain’s point of origin emerges in the right moment. Built on the BSC decentralized public-chain foundation, it is fully open-source, abandons permissioning, has no backdoors, and is purely community self-governance. With six major disruptive underlying innovations, it completely cures all stubborn issues of traditional radars.
Today’s blockbuster: a peak AMA—gathering seasoned KOLs across the web, top-notch research and investment experts, and top-tier hosts. We’ll break down the SGY innovation logic step by step, deeply decode the on-chain stable wealth model, help you see through the essence of cycles, seize the opportunities of the singularity, and set out together on a new journey toward long-term, effective mutual benefit on-chain!
🎤 Special Host (Host)
🎙Gold-medal host in the Web3 field 👉🏻 Li Qian Grace @梨浅Grace
🎙Co-host 👉🏻 Xu Hao Media @旭好传媒
👥【Featured Heavyweight Guests】(Speakers)
🔹MAX @台湾Max |Industry veteran blockchain expert
🔹MAGGIE @Maggie 965841|Industry veteran blockchain expert
🔹Dragon Riding in the World @520龙行天下 |74K Binance Square gold badge host
🔹Money Machine Baa Dan @钞机八蛋 |80K Binance Square gold badge host
🔹Dehui @DeHui德惠VC |37K Binance Square gold badge host
🔹Xiao Jiu @win小酒 |56K Binance Square gold badge host

慢就是快Mike
·
--
[Ended] 🎙️ When will the market start? Enter to get the latest wealth secrets!
7.9k listens

武媚娘吖Hawk
·
--
🧧Protect ecological balance, spread the free-thinking idea#Hawk


黑猫SabTheTrader
·
--
Greed Index 68, $BTC — should you chase or run? I went through the data from the past four years 👀
When people see “the market is greedy,” some want to chase the rally, while others prepare to short. But the same 68 can lead to completely different outcomes.
💡 I looked at the dates from October 4, 2022 to October 3, 2026 when Alternative.me was exactly 68, and there were 19 of them. Using the BTC daily close on those dates as the reference:
▸ 7 days later, 10 rises and 9 falls;
▸ 30 days later, also 10 rises and 9 falls.
Note that these 19 dates include consecutive or adjacent samples, and the follow-up observation windows also overlap. They cannot be treated as 19 independent trades, and 10/19 should not be packaged as a long-only win rate. The sample is small, and fees are not deducted.
Looking at a few examples makes the difference clearer:
1️⃣ On April 14, 2023, the index was 68.
BTC closed at about $30,500 that day, fell about 10.5% 7 days later, and about 11.7% 30 days later. Sentiment was hot, but price still pulled back.
2️⃣ On November 7, 2023, the index was also 68.
BTC closed at about $35,400, rose about 0.3% 7 days later, and about 22.2% 30 days later. If you assume a top just because greed appears, you might get out too early.
3️⃣ On July 26, 2024, it was 68 again.
BTC closed at about $67,900, fell about 9.6% 7 days later, and about 5.3% 30 days later. The same reading did not replicate the previous rally.
4️⃣ On June 17, 2025, the index was 68.
BTC closed at about $104,600, rose about 1.4% 7 days later, and about 14.0% 30 days later. Greed can also accompany trend continuation.
These comparisons remind me: one number cannot capture the trend, buying pressure, and market environment at that moment.
And Alternative.me’s calculation itself already includes price movement, momentum, and volume. When price rises, it can push the index higher; then using the index to prove “price will keep rising” can easily circle back to the starting point.
I’d look one step further: did this 68 rise gradually from fear, or did it retreat from an even greedier level? Is price holding after a breakout, or repeatedly spiking and fading?
Tonight, on Sunday, I’ll also keep an eye on the tape. If it breaks out and then retests and holds, I’ll keep watching for continuation; if it spikes and falls back into the range, I’ll lower my expectations of chasing. Especially in leveraged trading, don’t use an emotion gauge as a reason to add size. 🙈
Price action has the final say.
* NFA, DYOR
#比特币冲击8.7万美元遇阻回落
When people see “the market is greedy,” some want to chase the rally, while others prepare to short. But the same 68 can lead to completely different outcomes.
💡 I looked at the dates from October 4, 2022 to October 3, 2026 when Alternative.me was exactly 68, and there were 19 of them. Using the BTC daily close on those dates as the reference:
▸ 7 days later, 10 rises and 9 falls;
▸ 30 days later, also 10 rises and 9 falls.
Note that these 19 dates include consecutive or adjacent samples, and the follow-up observation windows also overlap. They cannot be treated as 19 independent trades, and 10/19 should not be packaged as a long-only win rate. The sample is small, and fees are not deducted.
Looking at a few examples makes the difference clearer:
1️⃣ On April 14, 2023, the index was 68.
BTC closed at about $30,500 that day, fell about 10.5% 7 days later, and about 11.7% 30 days later. Sentiment was hot, but price still pulled back.
2️⃣ On November 7, 2023, the index was also 68.
BTC closed at about $35,400, rose about 0.3% 7 days later, and about 22.2% 30 days later. If you assume a top just because greed appears, you might get out too early.
3️⃣ On July 26, 2024, it was 68 again.
BTC closed at about $67,900, fell about 9.6% 7 days later, and about 5.3% 30 days later. The same reading did not replicate the previous rally.
4️⃣ On June 17, 2025, the index was 68.
BTC closed at about $104,600, rose about 1.4% 7 days later, and about 14.0% 30 days later. Greed can also accompany trend continuation.
These comparisons remind me: one number cannot capture the trend, buying pressure, and market environment at that moment.
And Alternative.me’s calculation itself already includes price movement, momentum, and volume. When price rises, it can push the index higher; then using the index to prove “price will keep rising” can easily circle back to the starting point.
I’d look one step further: did this 68 rise gradually from fear, or did it retreat from an even greedier level? Is price holding after a breakout, or repeatedly spiking and fading?
Tonight, on Sunday, I’ll also keep an eye on the tape. If it breaks out and then retests and holds, I’ll keep watching for continuation; if it spikes and falls back into the range, I’ll lower my expectations of chasing. Especially in leveraged trading, don’t use an emotion gauge as a reason to add size. 🙈
Price action has the final say.
* NFA, DYOR
#比特币冲击8.7万美元遇阻回落
黑猫SabTheTrader
·
--
Greed Index 68, $BTC — should you chase or run? I went through the data from the past four years 👀
When people see “the market is greedy,” some want to chase the rally, while others prepare to short. But the same 68 can lead to completely different outcomes.
💡 I looked at the dates from October 4, 2022 to October 3, 2026 when Alternative.me was exactly 68, and there were 19 of them. Using the BTC daily close on those dates as the reference:
▸ 7 days later, 10 rises and 9 falls;
▸ 30 days later, also 10 rises and 9 falls.
Note that these 19 dates include consecutive or adjacent samples, and the follow-up observation windows also overlap. They cannot be treated as 19 independent trades, and 10/19 should not be packaged as a long-only win rate. The sample is small, and fees are not deducted.
Looking at a few examples makes the difference clearer:
1️⃣ On April 14, 2023, the index was 68.
BTC closed at about $30,500 that day, fell about 10.5% 7 days later, and about 11.7% 30 days later. Sentiment was hot, but price still pulled back.
2️⃣ On November 7, 2023, the index was also 68.
BTC closed at about $35,400, rose about 0.3% 7 days later, and about 22.2% 30 days later. If you assume a top just because greed appears, you might get out too early.
3️⃣ On July 26, 2024, it was 68 again.
BTC closed at about $67,900, fell about 9.6% 7 days later, and about 5.3% 30 days later. The same reading did not replicate the previous rally.
4️⃣ On June 17, 2025, the index was 68.
BTC closed at about $104,600, rose about 1.4% 7 days later, and about 14.0% 30 days later. Greed can also accompany trend continuation.
These comparisons remind me: one number cannot capture the trend, buying pressure, and market environment at that moment.
And Alternative.me’s calculation itself already includes price movement, momentum, and volume. When price rises, it can push the index higher; then using the index to prove “price will keep rising” can easily circle back to the starting point.
I’d look one step further: did this 68 rise gradually from fear, or did it retreat from an even greedier level? Is price holding after a breakout, or repeatedly spiking and fading?
Tonight, on Sunday, I’ll also keep an eye on the tape. If it breaks out and then retests and holds, I’ll keep watching for continuation; if it spikes and falls back into the range, I’ll lower my expectations of chasing. Especially in leveraged trading, don’t use an emotion gauge as a reason to add size. 🙈
Price action has the final say.
* NFA, DYOR
#比特币冲击8.7万美元遇阻回落
When people see “the market is greedy,” some want to chase the rally, while others prepare to short. But the same 68 can lead to completely different outcomes.
💡 I looked at the dates from October 4, 2022 to October 3, 2026 when Alternative.me was exactly 68, and there were 19 of them. Using the BTC daily close on those dates as the reference:
▸ 7 days later, 10 rises and 9 falls;
▸ 30 days later, also 10 rises and 9 falls.
Note that these 19 dates include consecutive or adjacent samples, and the follow-up observation windows also overlap. They cannot be treated as 19 independent trades, and 10/19 should not be packaged as a long-only win rate. The sample is small, and fees are not deducted.
Looking at a few examples makes the difference clearer:
1️⃣ On April 14, 2023, the index was 68.
BTC closed at about $30,500 that day, fell about 10.5% 7 days later, and about 11.7% 30 days later. Sentiment was hot, but price still pulled back.
2️⃣ On November 7, 2023, the index was also 68.
BTC closed at about $35,400, rose about 0.3% 7 days later, and about 22.2% 30 days later. If you assume a top just because greed appears, you might get out too early.
3️⃣ On July 26, 2024, it was 68 again.
BTC closed at about $67,900, fell about 9.6% 7 days later, and about 5.3% 30 days later. The same reading did not replicate the previous rally.
4️⃣ On June 17, 2025, the index was 68.
BTC closed at about $104,600, rose about 1.4% 7 days later, and about 14.0% 30 days later. Greed can also accompany trend continuation.
These comparisons remind me: one number cannot capture the trend, buying pressure, and market environment at that moment.
And Alternative.me’s calculation itself already includes price movement, momentum, and volume. When price rises, it can push the index higher; then using the index to prove “price will keep rising” can easily circle back to the starting point.
I’d look one step further: did this 68 rise gradually from fear, or did it retreat from an even greedier level? Is price holding after a breakout, or repeatedly spiking and fading?
Tonight, on Sunday, I’ll also keep an eye on the tape. If it breaks out and then retests and holds, I’ll keep watching for continuation; if it spikes and falls back into the range, I’ll lower my expectations of chasing. Especially in leveraged trading, don’t use an emotion gauge as a reason to add size. 🙈
Price action has the final say.
* NFA, DYOR
#比特币冲击8.7万美元遇阻回落

Sherry长得帅不如跑的快1688
·
--
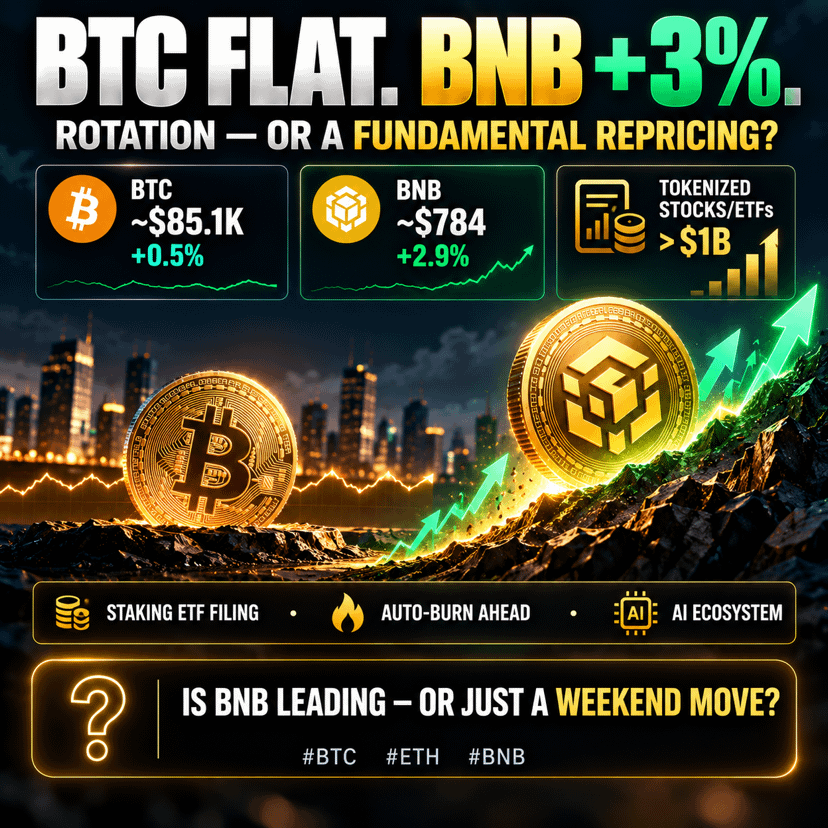
🚨 BITCOIN IS BARELY MOVING.
BNB ISN’T.
Right now:
₿ BTC → ~$85.1K|+0.5%
BNB → ~$784|+2.9%
That’s not a massive move.
But the interesting question is:
WHY BNB?
Several narratives are lining up
at the same time 👇
🏦 Tokenized stocks & ETFs
on BNB Chain have crossed $1B
💰 VanEck’s latest BNB ETF filing
adds a conditional STAKING framework
🔥 The 37th quarterly Auto-Burn
is approaching
🤖 BNB Chain’s AI / Agent ecosystem
continues to expand
So tonight’s real question isn’t:
“Can BNB go higher?”
It’s:
IS THIS JUST CAPITAL ROTATION?
OR A FUNDAMENTAL REPRICING?
When Bitcoin trades sideways near $85K,
capital starts searching for:
RELATIVE STRENGTH.
And tonight,
BNB is showing it.
Now I’m watching:
₿ BTC staying sideways
BNB relative strength vs BTC
🏦 Tokenized asset growth
💰 BNB ETF / staking developments
🔥 Auto-Burn
👇 Your take?
BNB LEADING 🟢
or
JUST A WEEKEND MOVE 🔴?
#BTC #ETH #BNB
BNB ISN’T.
Right now:
₿ BTC → ~$85.1K|+0.5%
BNB → ~$784|+2.9%
That’s not a massive move.
But the interesting question is:
WHY BNB?
Several narratives are lining up
at the same time 👇
🏦 Tokenized stocks & ETFs
on BNB Chain have crossed $1B
💰 VanEck’s latest BNB ETF filing
adds a conditional STAKING framework
🔥 The 37th quarterly Auto-Burn
is approaching
🤖 BNB Chain’s AI / Agent ecosystem
continues to expand
So tonight’s real question isn’t:
“Can BNB go higher?”
It’s:
IS THIS JUST CAPITAL ROTATION?
OR A FUNDAMENTAL REPRICING?
When Bitcoin trades sideways near $85K,
capital starts searching for:
RELATIVE STRENGTH.
And tonight,
BNB is showing it.
Now I’m watching:
₿ BTC staying sideways
BNB relative strength vs BTC
🏦 Tokenized asset growth
💰 BNB ETF / staking developments
🔥 Auto-Burn
👇 Your take?
BNB LEADING 🟢
or
JUST A WEEKEND MOVE 🔴?
#BTC #ETH #BNB

灰s1688
·
--
Is the big one coming?$BNB
🧧🧧
🧧🧧


道之为
·
--
$$ZEC is it going to drop? Today the market is calm, but it’s sliding down smoothly.


Log in to explore more content