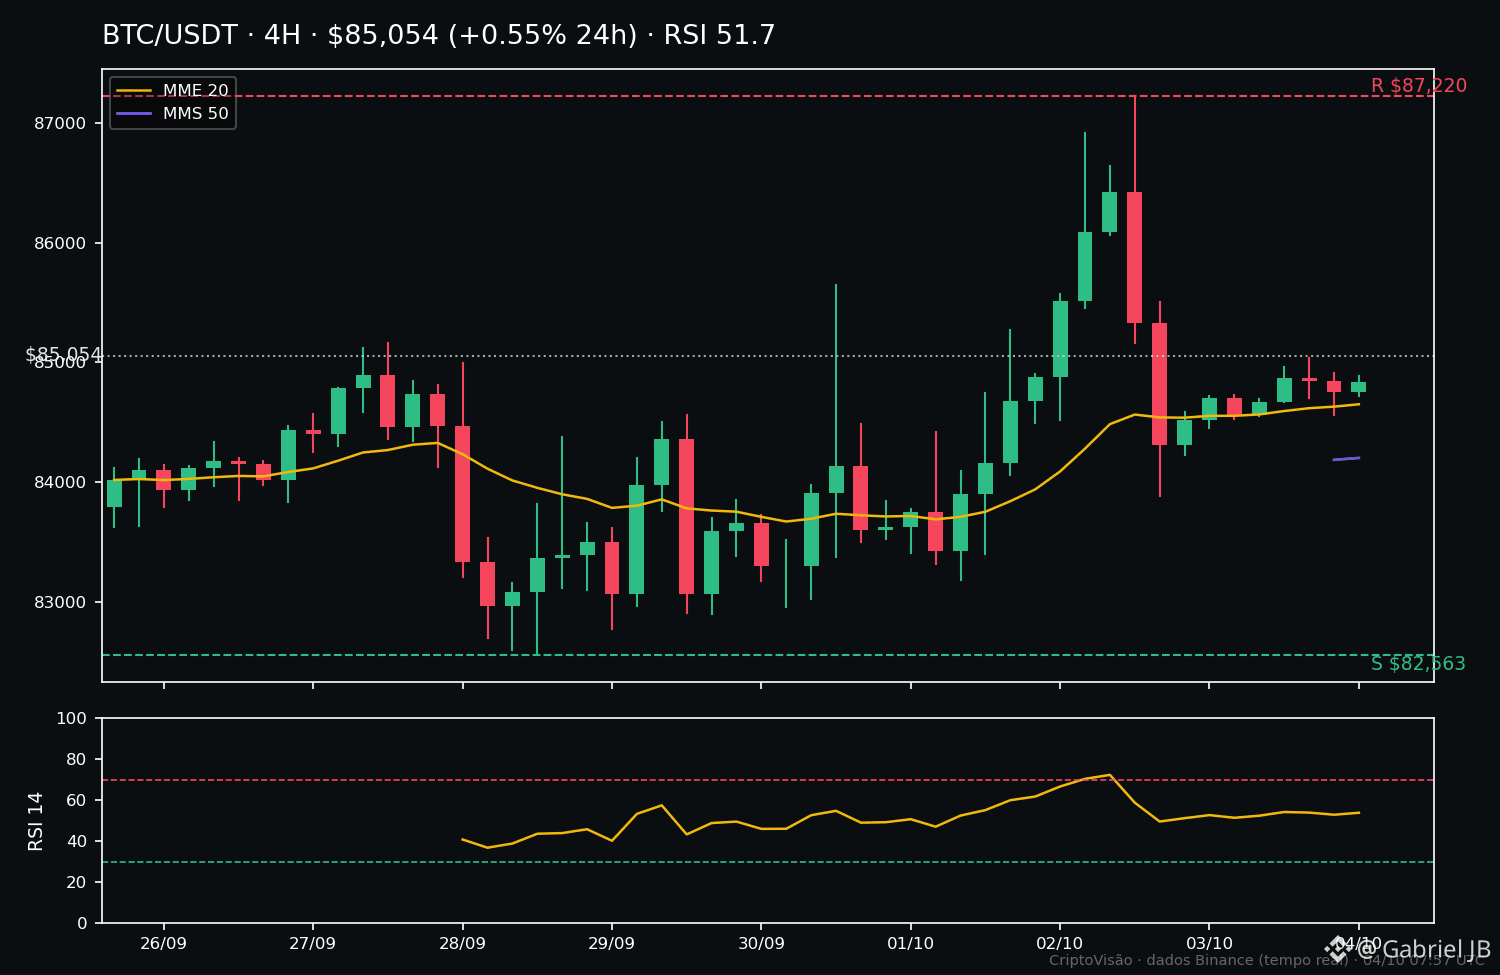
📊 Technical setup $BTC — 10:00
SITUATION
Bitcoin is trading now at $85.067, up 0.56% over 24h, sticking near the day’s high ($85.072). On the 4H chart, price remains above the 20 EMA ($84.693) and the 50 EMA ($84.204), with the RSI-14 at 51.7 — neutral, with no exhaustion or capitulation. Short-term structure is constructive, but there’s no breakout momentum: the high from the last 7 days ($87.220) continues to cap the upside.
LEVELS
• Resistances: $85.072 (24h high) and $87.220 (7-day high)
• Supports: $84.693 / $84.204 (confluence of the 4H moving averages) and $82.563 (7-day low)
SCENARIO A — support holds
If the $84.700–$84.200 zone holds and a buy confirmation appears, the path points back to a test of $87.220. This would be the structure gaining strength to attack the weekly resistance.
SCENARIO B — support breaks
If price loses the moving-average zone with a 4H candle close below $84.200, selling pressure gains room and the 7-day low ($82.563) becomes the natural target.
WHAT WOULD CONFIRM
Only a 4H candle close counts — intraday wicks neither invalidate nor confirm anything. Scenario A: close above the moving averages with a solid body. Scenario B: close below $84.200.
RISK
Trading near the top of the daily range leaves little space: a long entry from here would necessarily have the stop-loss placed just below the moving averages, which limits the risk/reward ratio. Also be careful with the false sense of strength — being above the moving averages is not the same as being above resistance. Nothing here is investment advice.
CONCLUSION
$BTC is solid in the short term, but trapped between the weekly ceiling and the moving-average floor. The objective trade is waiting for confirmation: anyone forcing a position in the middle of the range pays the price of uncertainty.
$BTC #Bitcoin #CriptoVisao
SITUATION
Bitcoin is trading now at $85.067, up 0.56% over 24h, sticking near the day’s high ($85.072). On the 4H chart, price remains above the 20 EMA ($84.693) and the 50 EMA ($84.204), with the RSI-14 at 51.7 — neutral, with no exhaustion or capitulation. Short-term structure is constructive, but there’s no breakout momentum: the high from the last 7 days ($87.220) continues to cap the upside.
LEVELS
• Resistances: $85.072 (24h high) and $87.220 (7-day high)
• Supports: $84.693 / $84.204 (confluence of the 4H moving averages) and $82.563 (7-day low)
SCENARIO A — support holds
If the $84.700–$84.200 zone holds and a buy confirmation appears, the path points back to a test of $87.220. This would be the structure gaining strength to attack the weekly resistance.
SCENARIO B — support breaks
If price loses the moving-average zone with a 4H candle close below $84.200, selling pressure gains room and the 7-day low ($82.563) becomes the natural target.
WHAT WOULD CONFIRM
Only a 4H candle close counts — intraday wicks neither invalidate nor confirm anything. Scenario A: close above the moving averages with a solid body. Scenario B: close below $84.200.
RISK
Trading near the top of the daily range leaves little space: a long entry from here would necessarily have the stop-loss placed just below the moving averages, which limits the risk/reward ratio. Also be careful with the false sense of strength — being above the moving averages is not the same as being above resistance. Nothing here is investment advice.
CONCLUSION
$BTC is solid in the short term, but trapped between the weekly ceiling and the moving-average floor. The objective trade is waiting for confirmation: anyone forcing a position in the middle of the range pays the price of uncertainty.
$BTC #Bitcoin #CriptoVisao