Just look at the chart of $OPEN —it gives me chills, guys 😏. It’s been dropping hard; it’s exactly the kind of move we’ve been waiting for so they can scoop up the over-saturated supply.
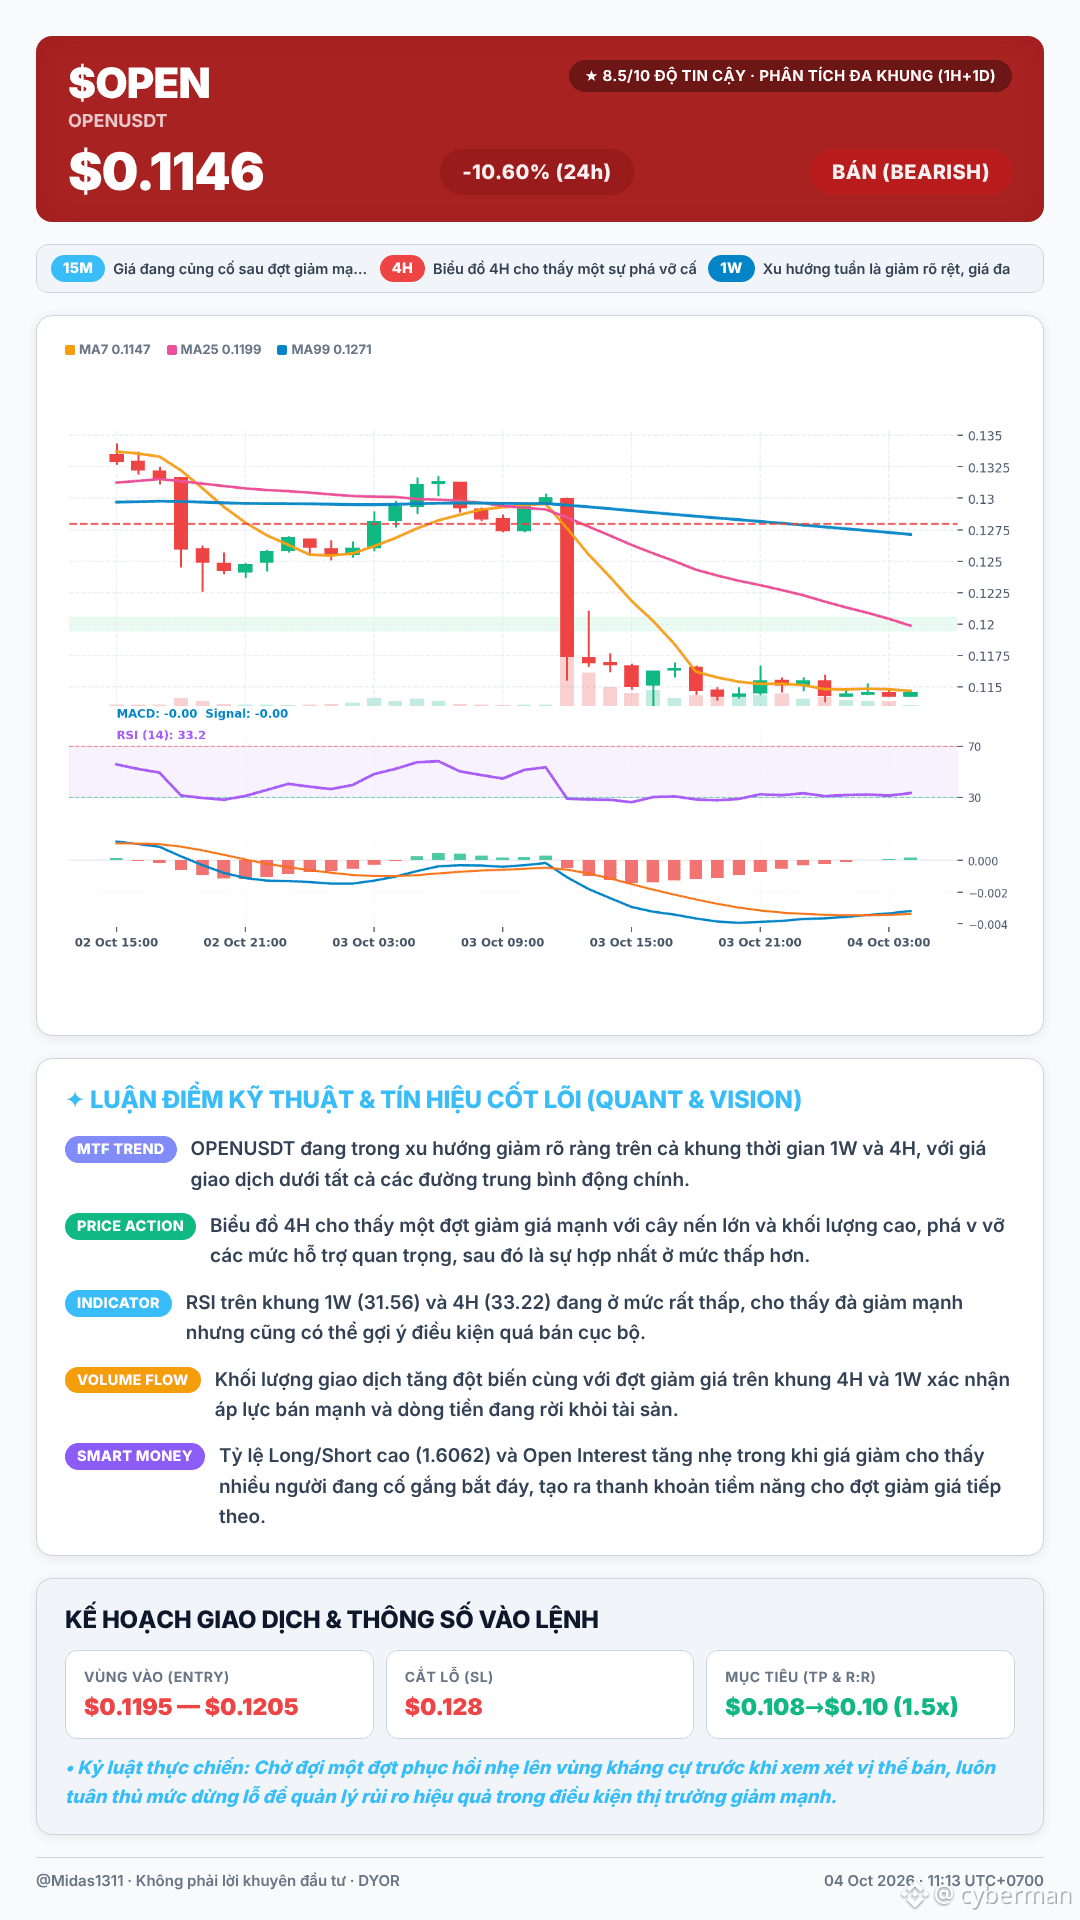
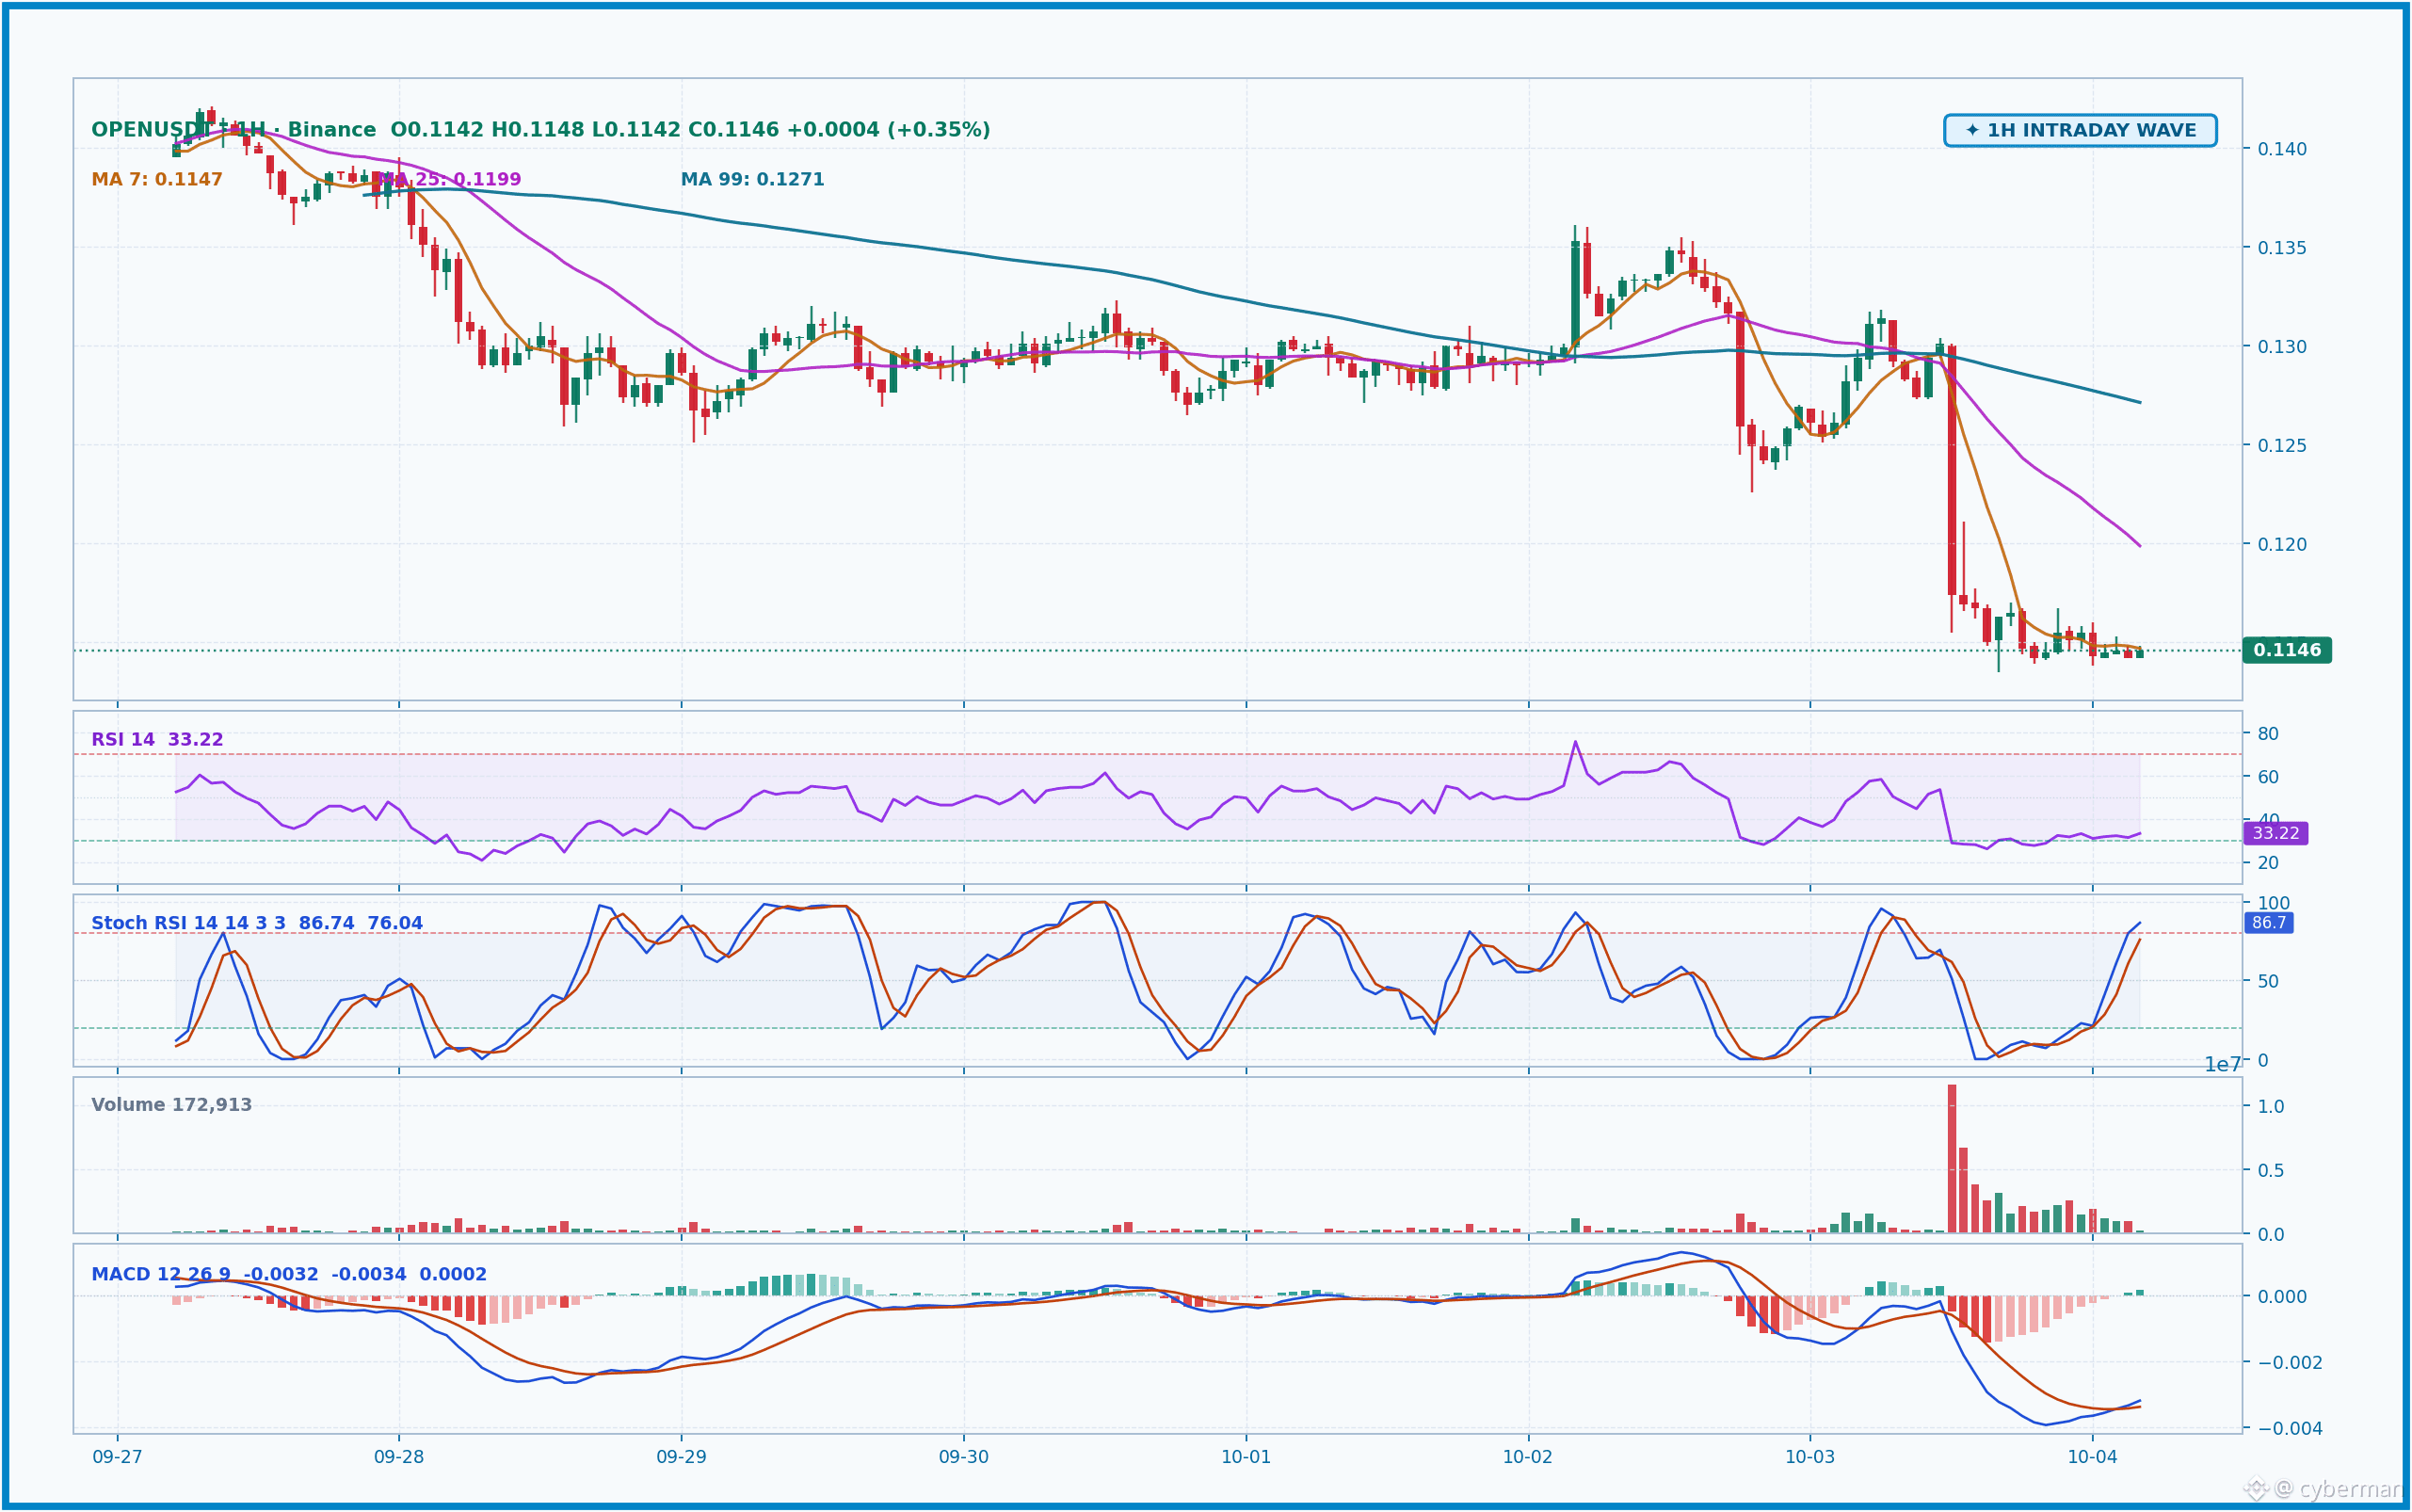
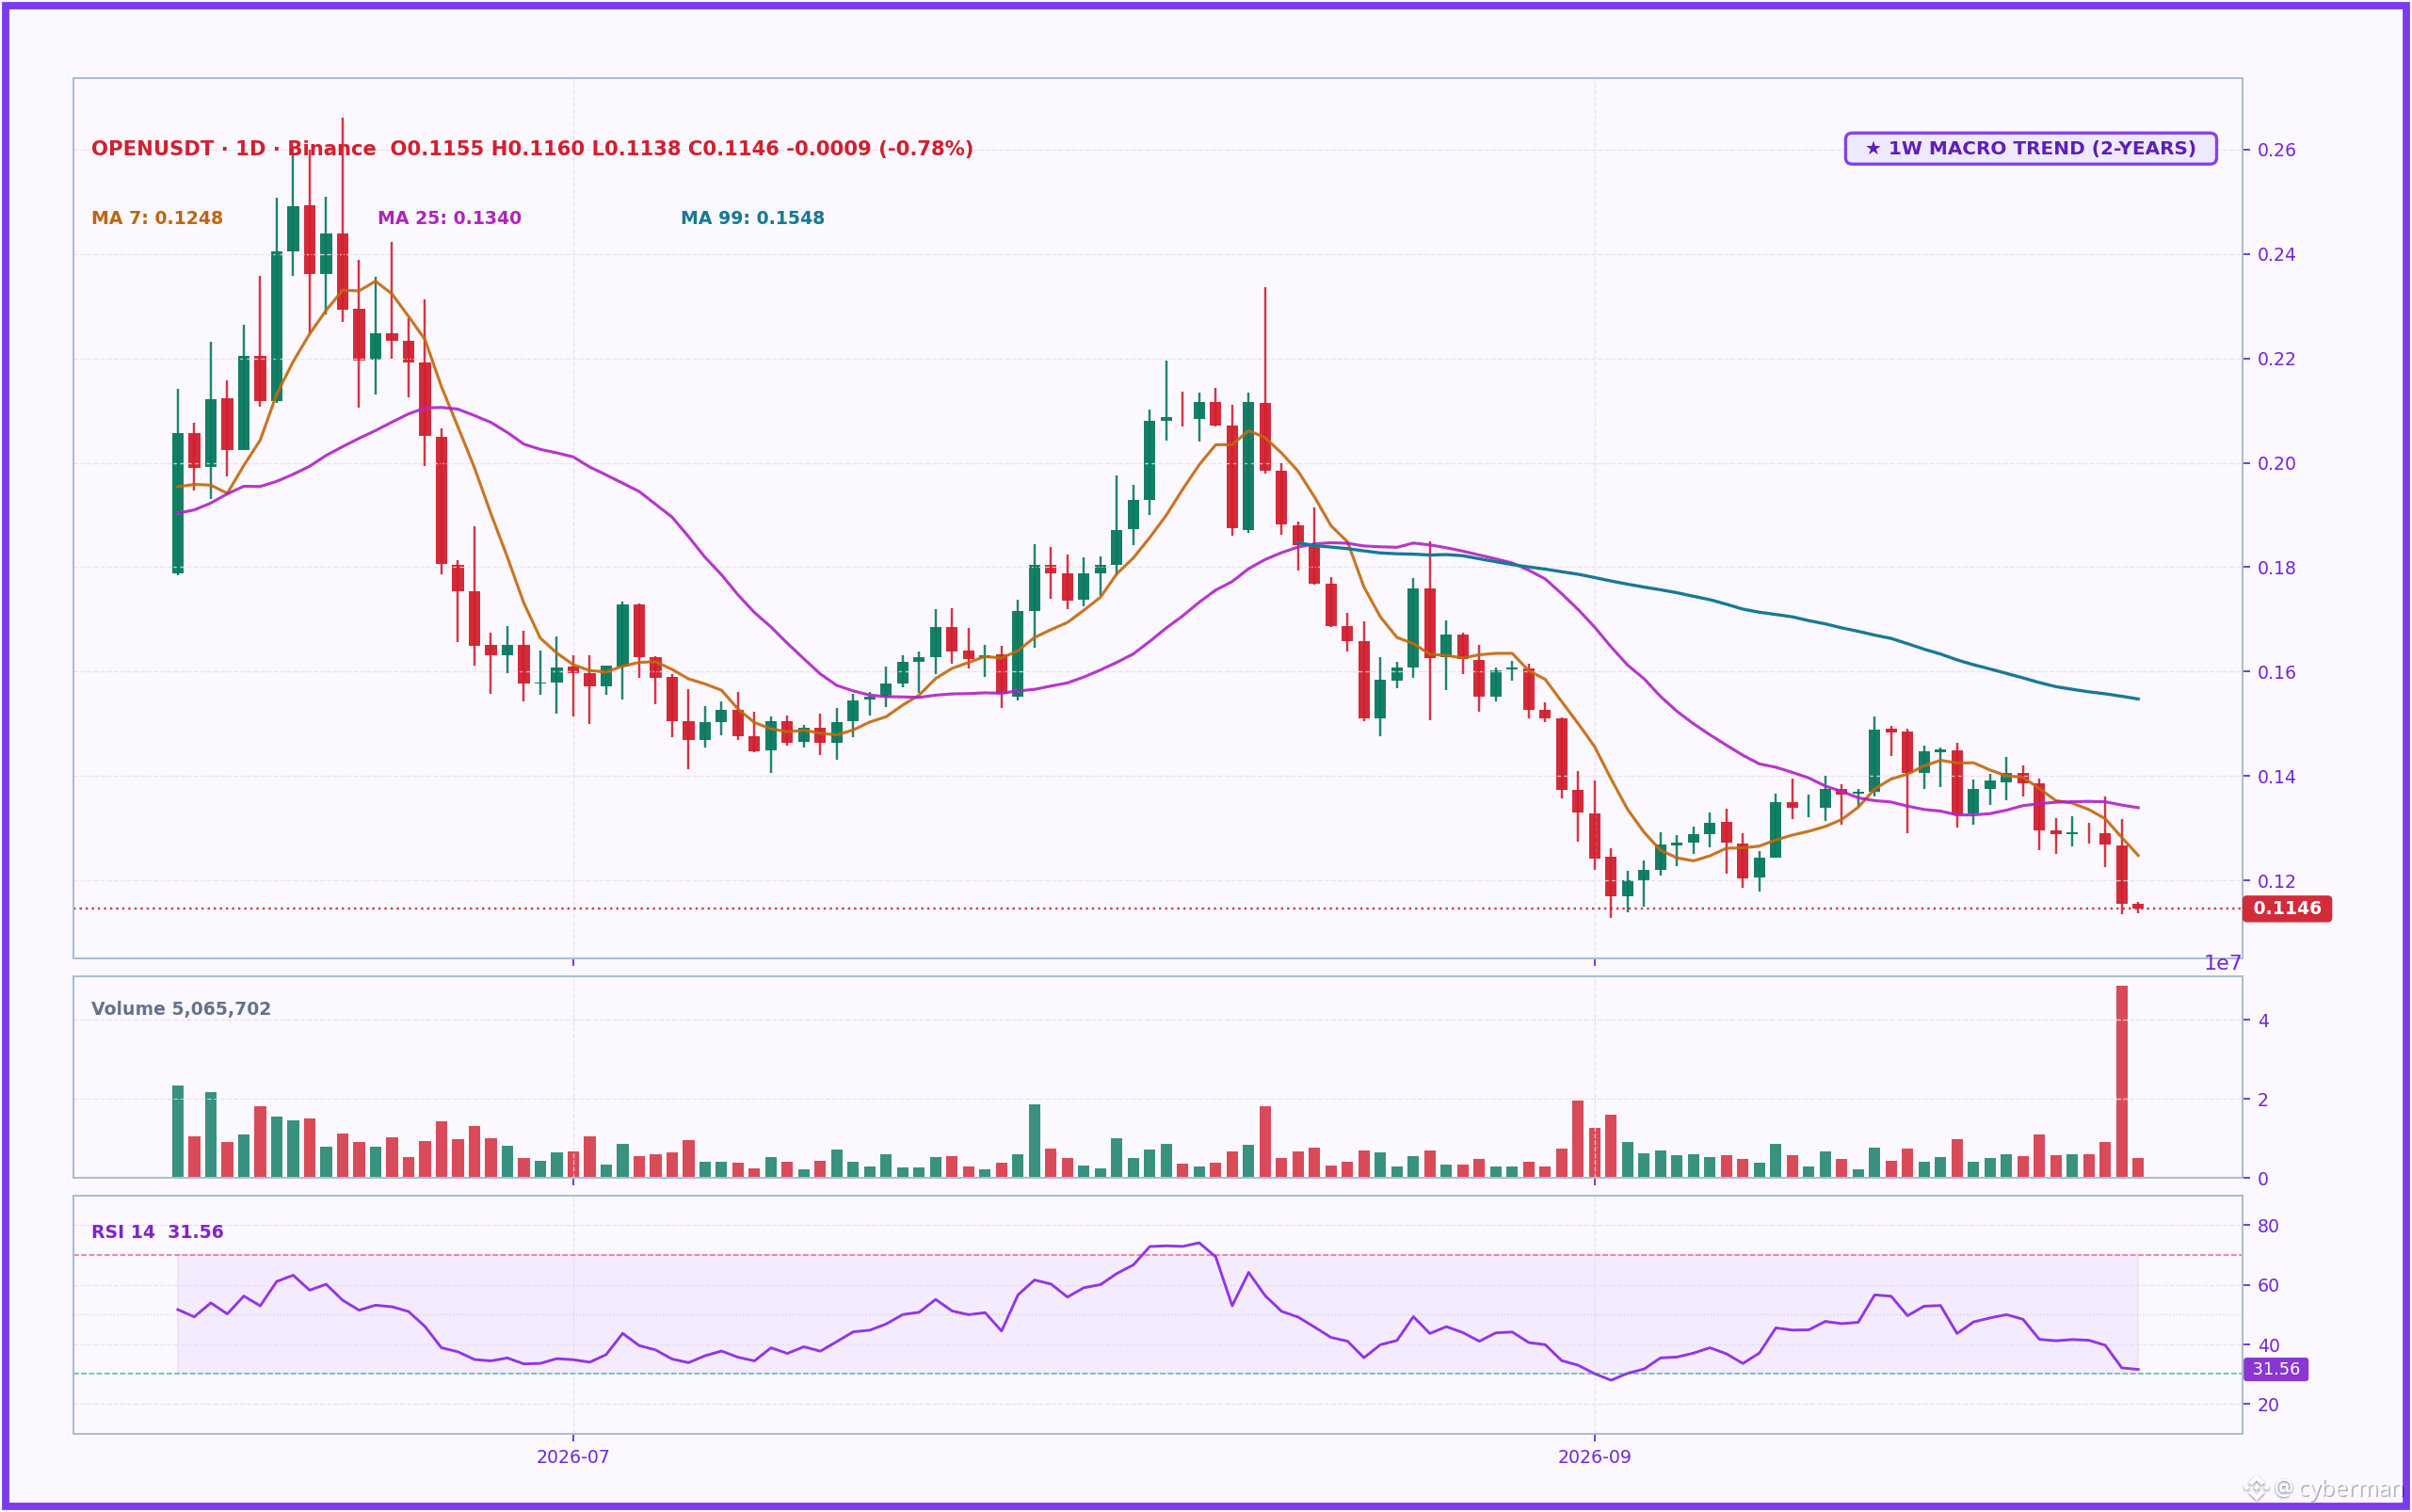
On the 1D chart, the downtrend of $OPEN is crystal clear— the price is below all the major MA lines, suggesting a not-so-bright macro picture. The 1H timeframe doesn’t look much better either. After a strong dump with a big bearish candle and a sudden spike in volume, the price is currently struggling to consolidate in the lower zone at $0.1146. The cause may be the massive token unlock schedule for $OPEN around September/October 2026, when early investors’ token tranches and the team all sell off after a 12-month cliff. This creates extremely heavy supply pressure that the market can hardly absorb.
RSI on both the 1D (31.6) and 1H (33.2) are very low, reflecting a strong bearish momentum—but it could also signal a local oversold condition, meaning there may be a small rebound. However, the surge in trading volume alongside the price drop confirms that money is leaving this asset very quickly.
On the 1D chart, the downtrend of $OPEN is crystal clear— the price is below all the major MA lines, suggesting a not-so-bright macro picture. The 1H timeframe doesn’t look much better either. After a strong dump with a big bearish candle and a sudden spike in volume, the price is currently struggling to consolidate in the lower zone at $0.1146. The cause may be the massive token unlock schedule for $OPEN around September/October 2026, when early investors’ token tranches and the team all sell off after a 12-month cliff. This creates extremely heavy supply pressure that the market can hardly absorb.
RSI on both the 1D (31.6) and 1H (33.2) are very low, reflecting a strong bearish momentum—but it could also signal a local oversold condition, meaning there may be a small rebound. However, the surge in trading volume alongside the price drop confirms that money is leaving this asset very quickly.