📊 WEEKLY BTC LIQUIDITY COUNT: What really happened this week and where is liquidity heading? 🔥
🧠 Weekly Informational Summary of Bitcoin & Liquidity Analysis
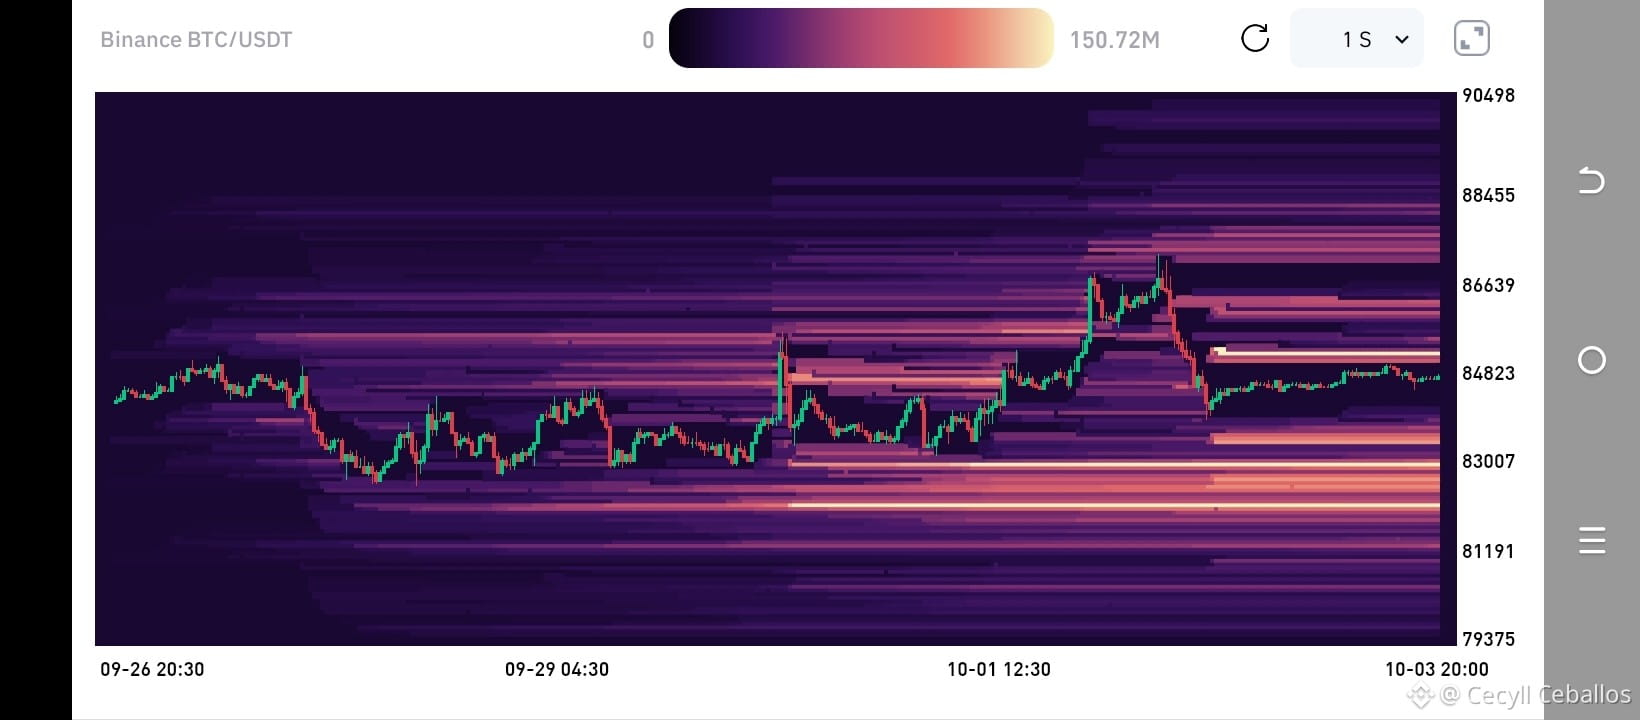
Let’s take a step-by-step look at everything that happened with Bitcoin during this week. Looking at the 7-day Liquidity Heatmap shows us exactly how the market hunted for and swept through the order-heavy zones:
📌 1. Initial drop and consolidation at the bottom:
At the beginning of the week, between September 26 and 28, the price dropped toward the $83,000 area. In those levels, a thick band of liquidity accumulated just below, while the market entered a sideways range of indecision.
📌 2. The big surge and the sweep toward $87,000:
Heading toward October 1, buying volume took off. BTC executed a strong bullish push designed to clear out the shorts that had built up, reaching a peak close to $87,000.
📌 3. Aggressive pullback after the peak:
Immediately after hitting that $87k high, massive profit-taking kicked in along with a strong rejection. Price quickly fell back toward the $84,800 zone, sweeping late buyers.
📌 4. Current situation (Sideways action with a recovering bias):
Today, BTC is trading around $84,823. It remains in a sideways move while trying to form a gradual recovery structure.
🔍 What does the heatmap indicate right now?
• Lower side (Strong Support): There is a very bright and dense liquidity band accumulated in the $83,000 – $82,200 area.
• Upper side (Resistance): Attractive orders have again accumulated in the $86,000 – $87,000 range for a potential next sweep.
💬 Comment if you like my analysis. Hit a LIKE if this information helped!
🤝 If you follow me, I’ll follow you back.
👇 Do you think the next move will first hunt liquidity at $83k, or are we going back to find $87k again? Share your opinion.
$BTC $SOL #FedRateWatch #CryptoAnalysis
🧠 Weekly Informational Summary of Bitcoin & Liquidity Analysis
Let’s take a step-by-step look at everything that happened with Bitcoin during this week. Looking at the 7-day Liquidity Heatmap shows us exactly how the market hunted for and swept through the order-heavy zones:
📌 1. Initial drop and consolidation at the bottom:
At the beginning of the week, between September 26 and 28, the price dropped toward the $83,000 area. In those levels, a thick band of liquidity accumulated just below, while the market entered a sideways range of indecision.
📌 2. The big surge and the sweep toward $87,000:
Heading toward October 1, buying volume took off. BTC executed a strong bullish push designed to clear out the shorts that had built up, reaching a peak close to $87,000.
📌 3. Aggressive pullback after the peak:
Immediately after hitting that $87k high, massive profit-taking kicked in along with a strong rejection. Price quickly fell back toward the $84,800 zone, sweeping late buyers.
📌 4. Current situation (Sideways action with a recovering bias):
Today, BTC is trading around $84,823. It remains in a sideways move while trying to form a gradual recovery structure.
🔍 What does the heatmap indicate right now?
• Lower side (Strong Support): There is a very bright and dense liquidity band accumulated in the $83,000 – $82,200 area.
• Upper side (Resistance): Attractive orders have again accumulated in the $86,000 – $87,000 range for a potential next sweep.
💬 Comment if you like my analysis. Hit a LIKE if this information helped!
🤝 If you follow me, I’ll follow you back.
👇 Do you think the next move will first hunt liquidity at $83k, or are we going back to find $87k again? Share your opinion.
$BTC $SOL #FedRateWatch #CryptoAnalysis