📊 Analytical Summary for the Pair (#strkusdt $STRK ):
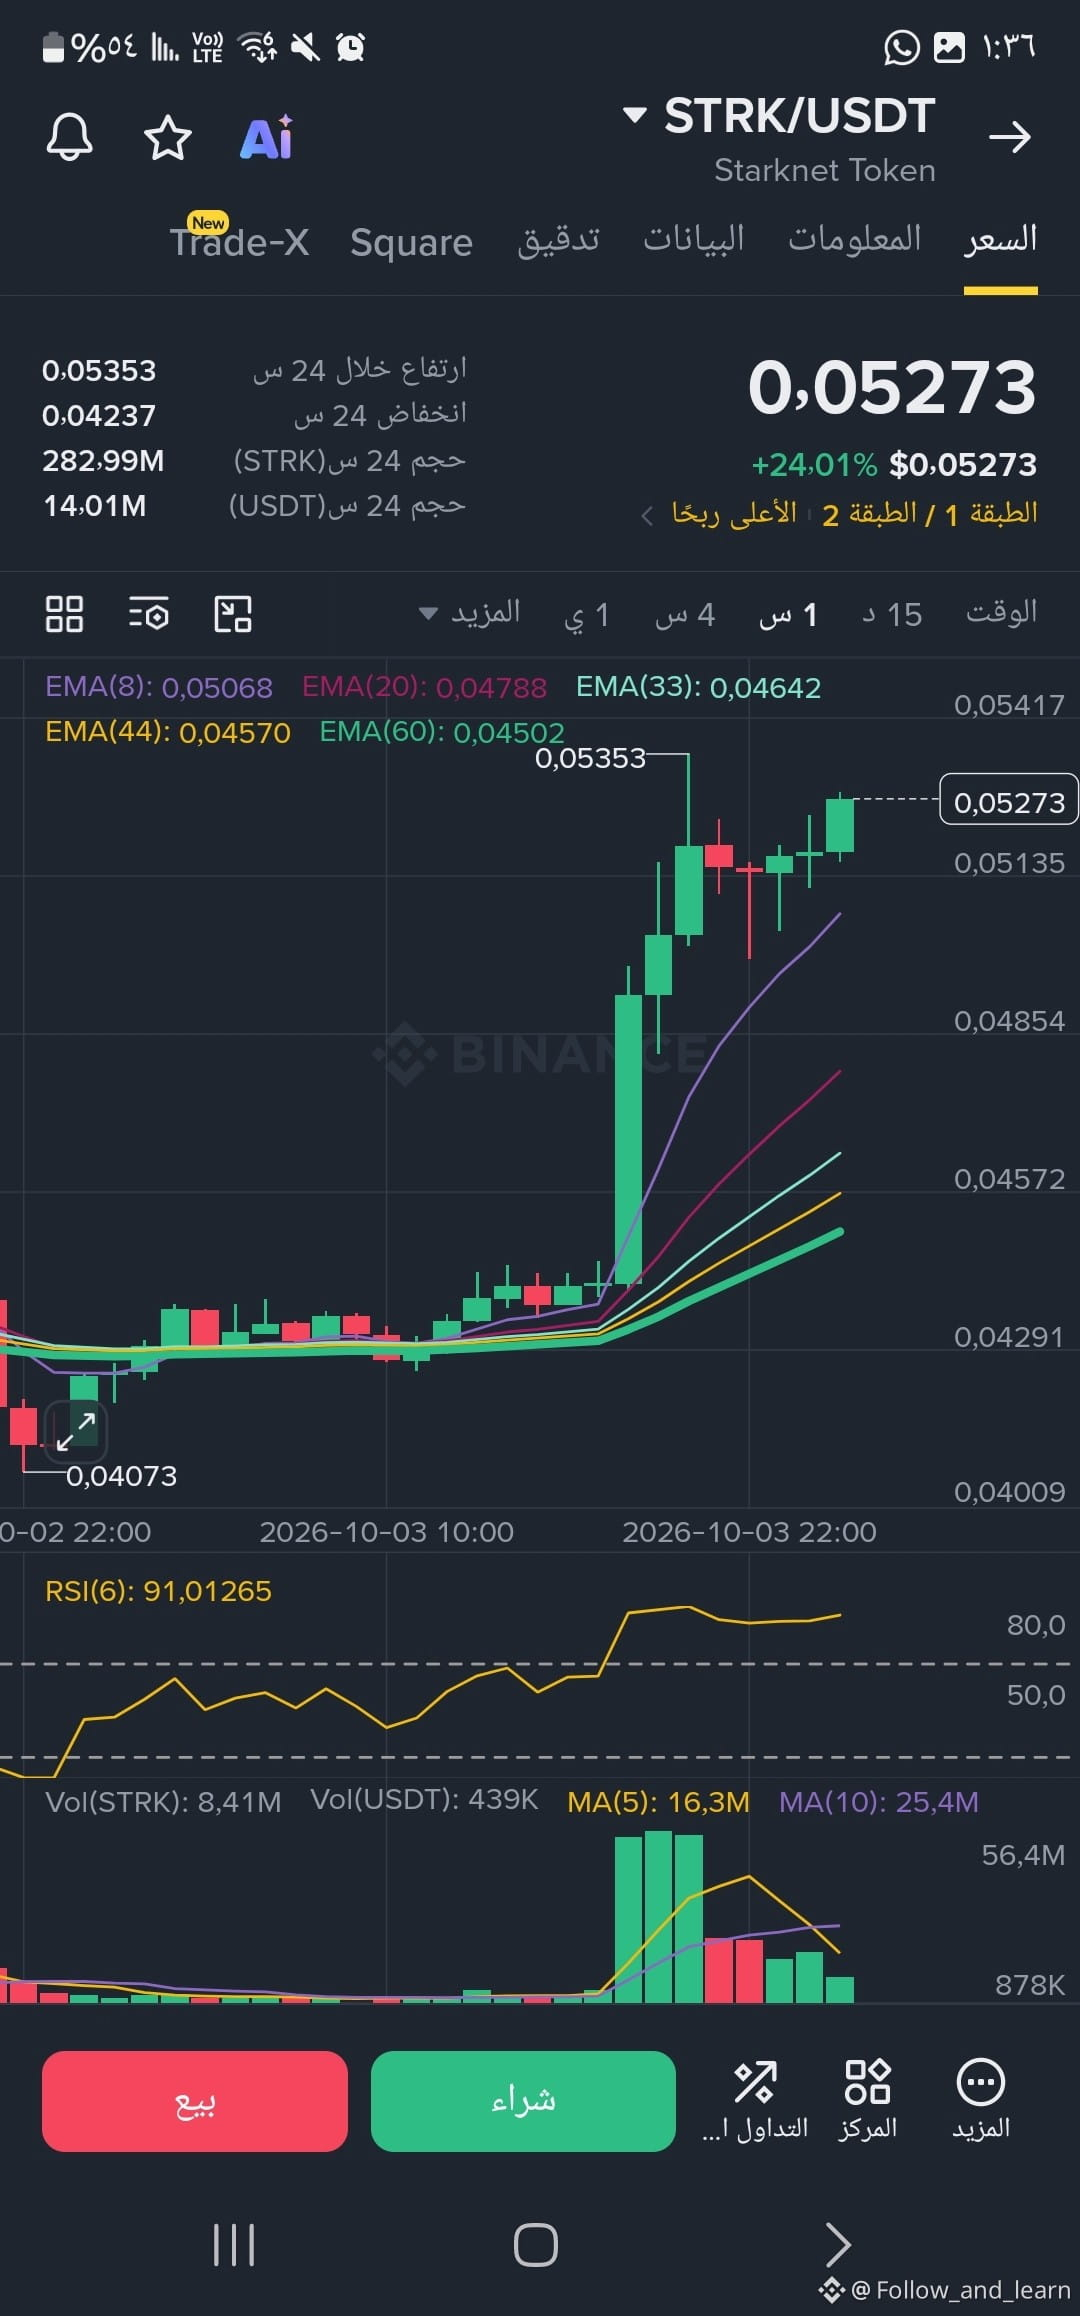
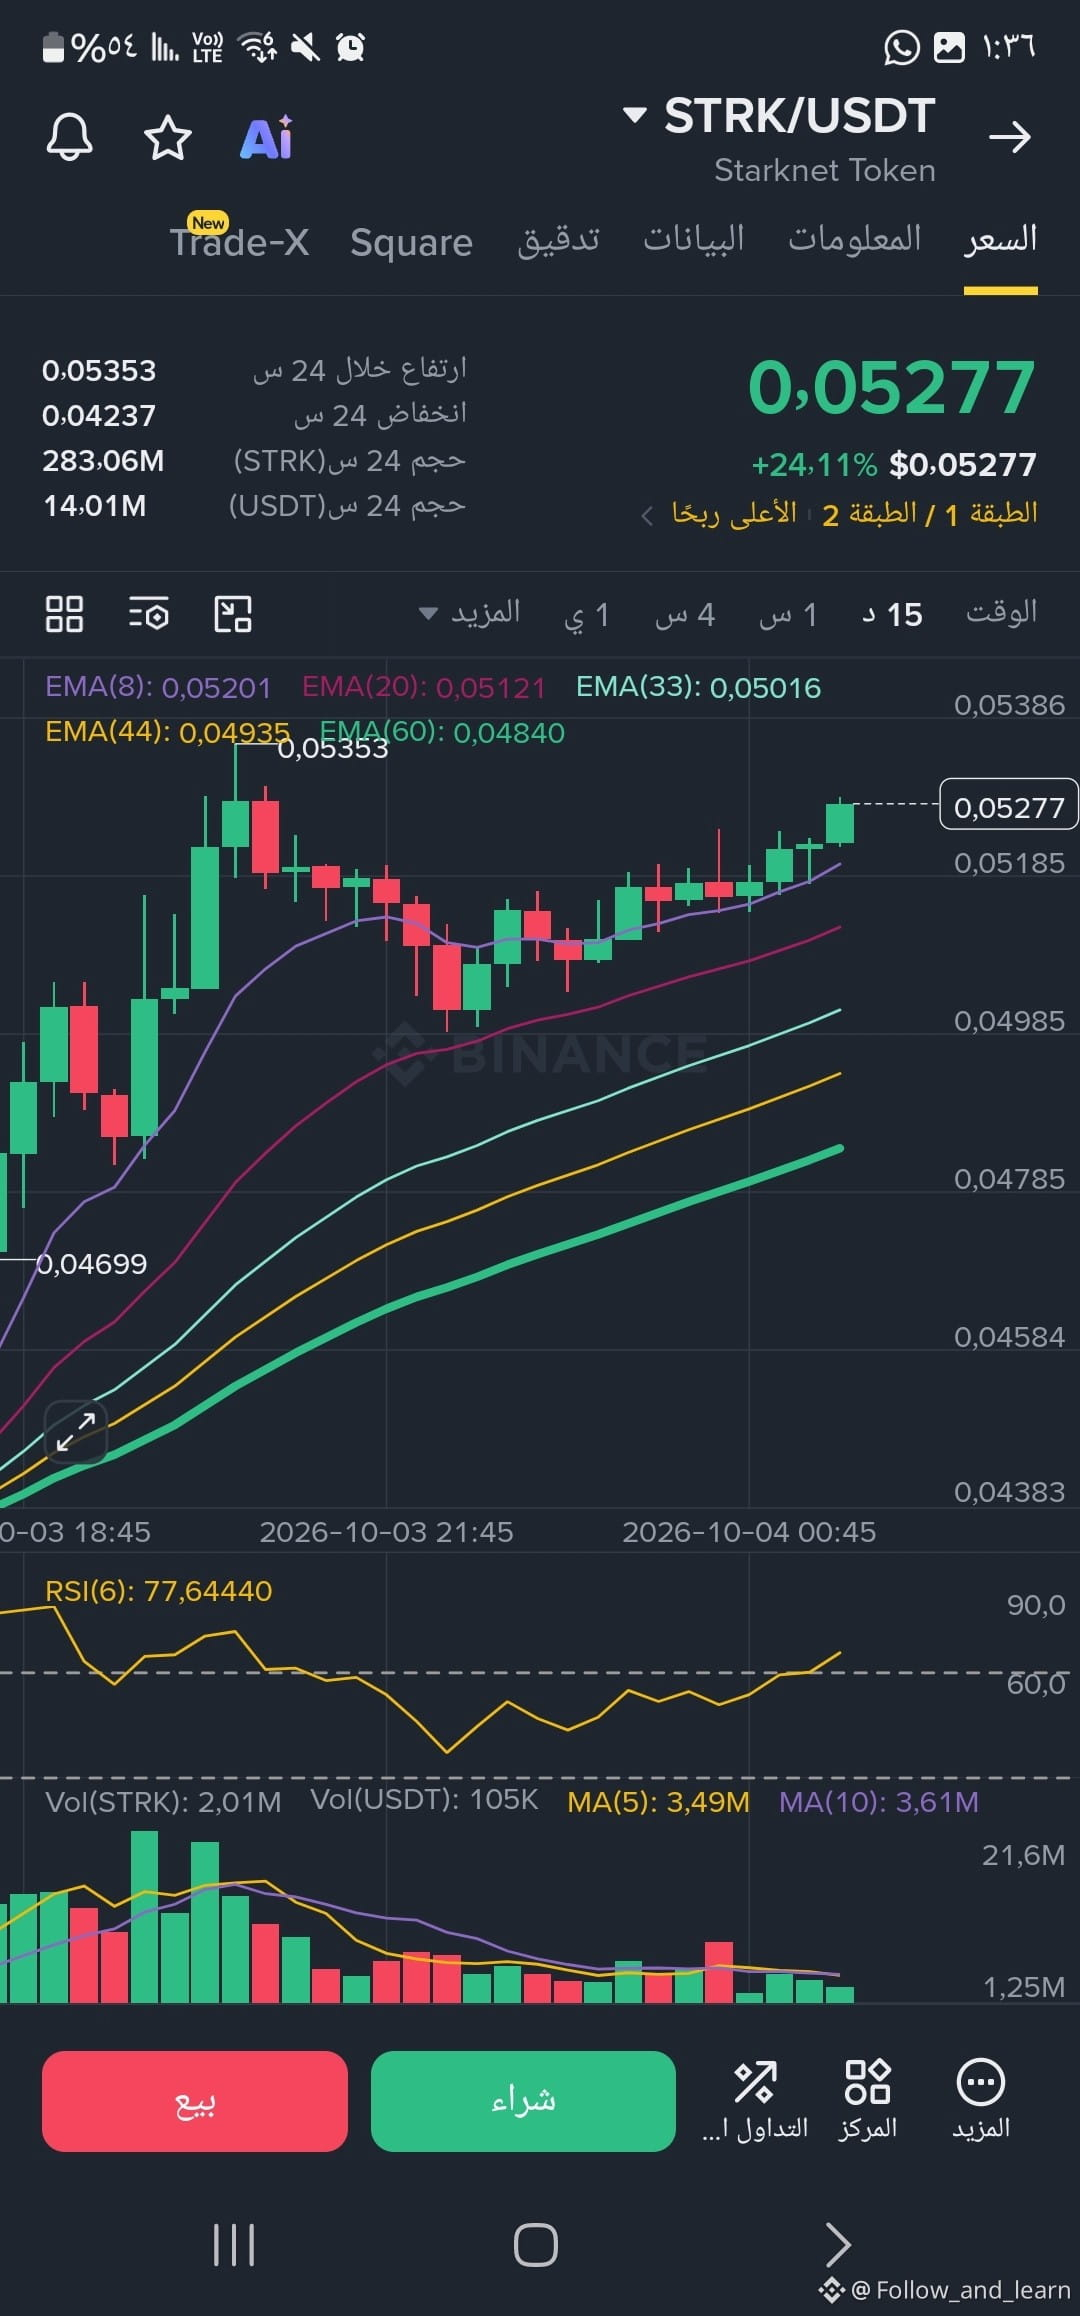
Current Performance: The coin is trading at the $0.0527 level, having achieved gains over the past 24 hours of approximately 24.01%.
Price Action: After a period of sideways consolidation, the chart witnessed a strong vertical upmove, breaking above the Exponential Moving Averages (EMAs), and recording a peak at $0.0535.
Technical Indicators:
The Relative Strength Index (RSI) on the broader timeframe is touching extremely high levels above 91, while it is around 77 on the 15-minute timeframe, reflecting clear buying saturation.
Short-term moving averages are aligned positively, supporting the current bullish momentum.
⚠️ Golden Tips for Traders and Beginners:
Be cautious of impulsive buying (FOMO): An RSI reaching above 90 means the price has surged faster than necessary, and entering now increases exposure to a sudden correction.
Watch Support and Resistance:
Resistance: A clear breakout and hold above the $0.0535 peak could signal continued upside.
Support: Any pullback below nearby moving averages may push the price to test lower support zones.
Risk Management: Don’t chase “burning” coins with full liquidity. Always set your stop-loss to protect your portfolio from sharp volatility.
Share your opinion: Will STRK continue breaking above the highs, or is profit-taking coming for sure?
Current Performance: The coin is trading at the $0.0527 level, having achieved gains over the past 24 hours of approximately 24.01%.
Price Action: After a period of sideways consolidation, the chart witnessed a strong vertical upmove, breaking above the Exponential Moving Averages (EMAs), and recording a peak at $0.0535.
Technical Indicators:
The Relative Strength Index (RSI) on the broader timeframe is touching extremely high levels above 91, while it is around 77 on the 15-minute timeframe, reflecting clear buying saturation.
Short-term moving averages are aligned positively, supporting the current bullish momentum.
⚠️ Golden Tips for Traders and Beginners:
Be cautious of impulsive buying (FOMO): An RSI reaching above 90 means the price has surged faster than necessary, and entering now increases exposure to a sudden correction.
Watch Support and Resistance:
Resistance: A clear breakout and hold above the $0.0535 peak could signal continued upside.
Support: Any pullback below nearby moving averages may push the price to test lower support zones.
Risk Management: Don’t chase “burning” coins with full liquidity. Always set your stop-loss to protect your portfolio from sharp volatility.
Share your opinion: Will STRK continue breaking above the highs, or is profit-taking coming for sure?