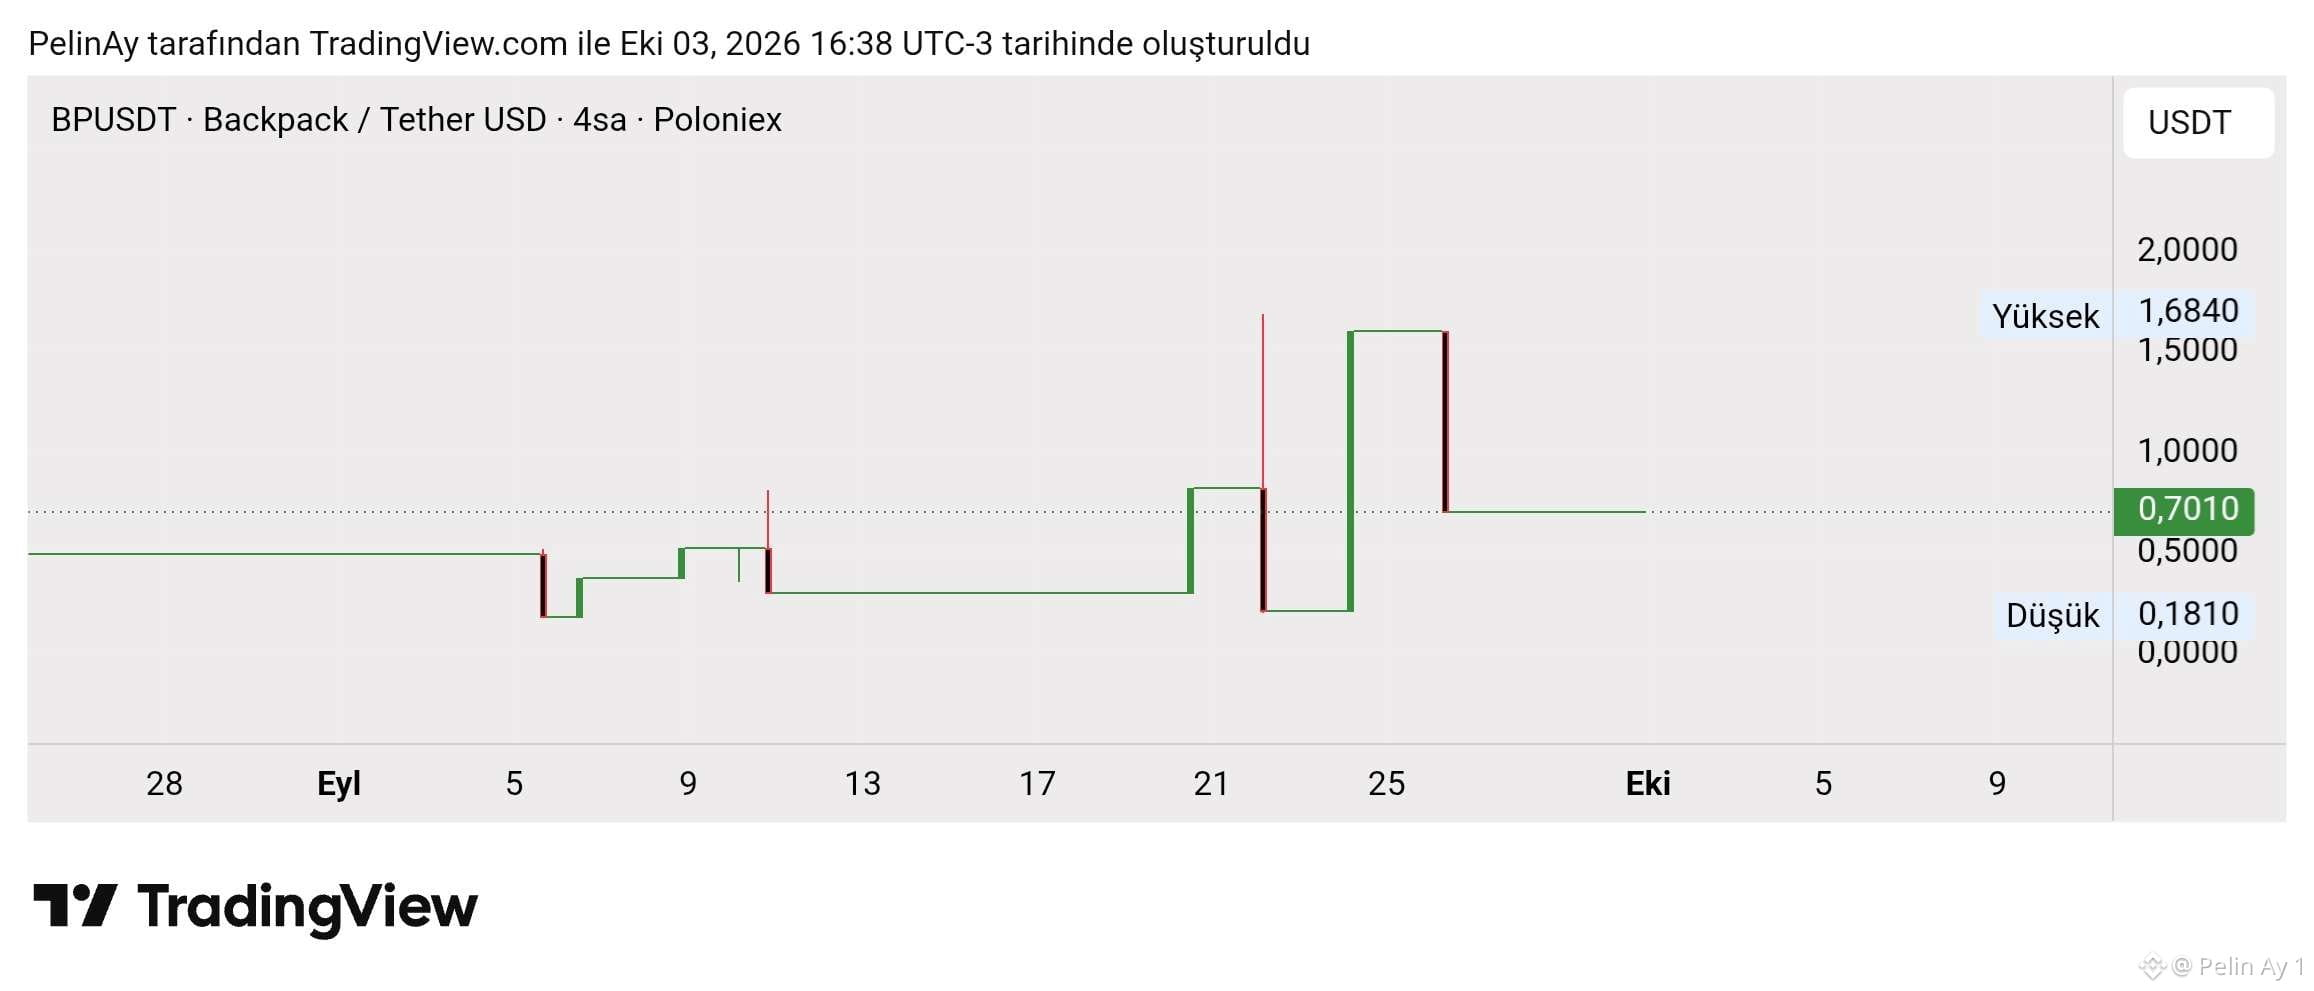
🚨 BACKPACK (BP) PRICE CHART’S UNUSUAL CANDLE STRUCTURE: WHAT’S BEHIND THE SHARP PRICE JUMPS?
On the BPUSDT pair of Backpack, an attention-grabbing unusual price movement can be observed. After the price remained sideways for a long time, it moved through different levels with sharp “steps,” and it also made sudden reversals within wide price ranges—posing a scenario that should be examined from a technical perspective.
What could be the possible reasons for this image?
-Low liquidity and a shallow order book may cause even limited-sized trades to impact the price sharply.
-In four-hour time frames, infrequent trading can lead to the price staying at the same level for a long time and then making sudden spikes.
-Exchange-specific price formation can create significant differences between price and volume data across different platforms.
-Missing OHLC data or chart rendering issues may also result in candles that look unusual. Therefore, it would not be accurate to explain the entire move directly as buy-sell pressure alone.
What’s happening on the project side?
Backpack offers exchange and wallet services within the Solana ecosystem. The BP token stands out with use cases such as platform advantages, trading-fee discounts, and a program that converts it into company shares under certain conditions.
At the beginning of October 2026, news circulated that BP reached an all-time high around $1.65. In addition, Backpack’s addition of tokenized Nokia shares to its platform at the end of September and its expansion of Arc support indicate that the product development roadmap is ongoing.
The unusual candles on the chart are not, by themselves, an indicator of a rise or a drop. In particular, movements within the 0.1810–1.6840 USDT range need to be confirmed with real trades—by checking Poloniex trading volume and comparing prices with other exchanges.
For a healthy technical assessment of BP, it’s important to track liquidity, trading volume, and the timing of news together, alongside price action. $BP #Backpack #BP
On the BPUSDT pair of Backpack, an attention-grabbing unusual price movement can be observed. After the price remained sideways for a long time, it moved through different levels with sharp “steps,” and it also made sudden reversals within wide price ranges—posing a scenario that should be examined from a technical perspective.
What could be the possible reasons for this image?
-Low liquidity and a shallow order book may cause even limited-sized trades to impact the price sharply.
-In four-hour time frames, infrequent trading can lead to the price staying at the same level for a long time and then making sudden spikes.
-Exchange-specific price formation can create significant differences between price and volume data across different platforms.
-Missing OHLC data or chart rendering issues may also result in candles that look unusual. Therefore, it would not be accurate to explain the entire move directly as buy-sell pressure alone.
What’s happening on the project side?
Backpack offers exchange and wallet services within the Solana ecosystem. The BP token stands out with use cases such as platform advantages, trading-fee discounts, and a program that converts it into company shares under certain conditions.
At the beginning of October 2026, news circulated that BP reached an all-time high around $1.65. In addition, Backpack’s addition of tokenized Nokia shares to its platform at the end of September and its expansion of Arc support indicate that the product development roadmap is ongoing.
The unusual candles on the chart are not, by themselves, an indicator of a rise or a drop. In particular, movements within the 0.1810–1.6840 USDT range need to be confirmed with real trades—by checking Poloniex trading volume and comparing prices with other exchanges.
For a healthy technical assessment of BP, it’s important to track liquidity, trading volume, and the timing of news together, alongside price action. $BP #Backpack #BP