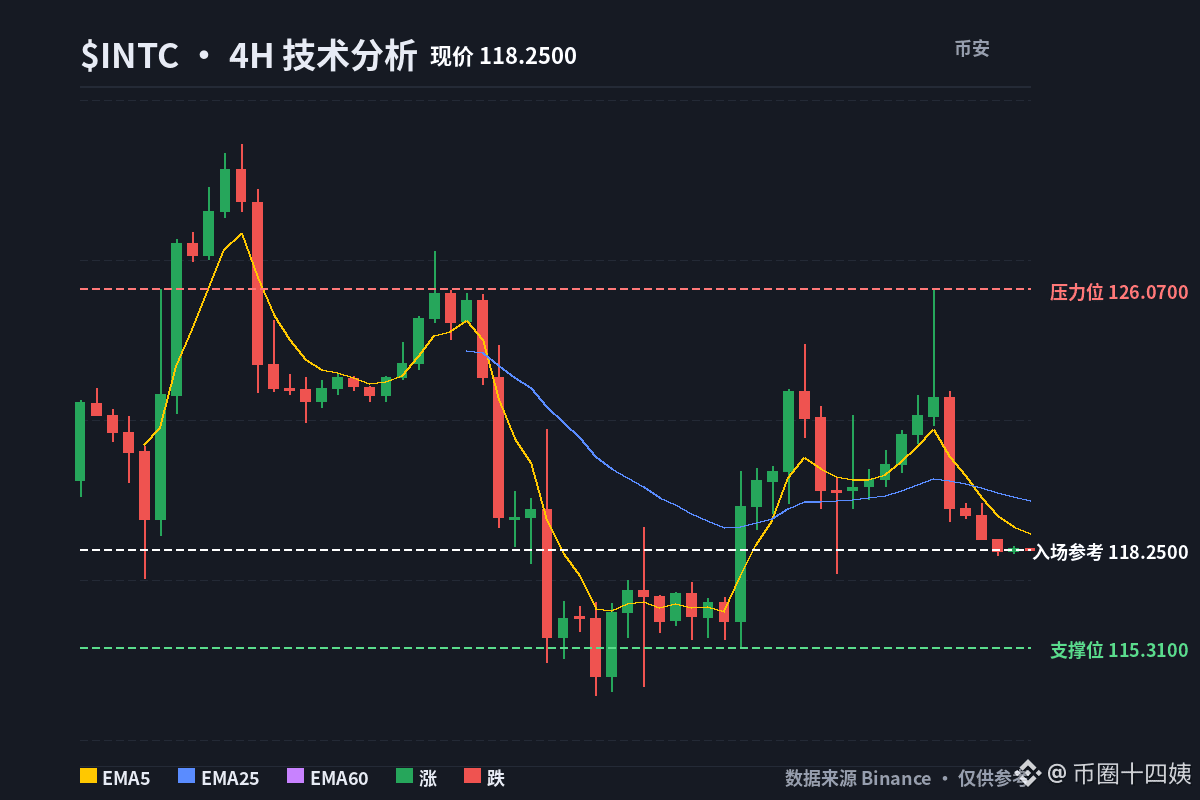
$INTC Semiconductor daily chart follows a trend-continuation pattern.
These past two weeks surged pretty aggressively—from $86 all the way up to $127—then pulled back to the 8EMA. Now it’s pushing back up into the supply zone at $124.73–$127.43.
However, pay attention to the very last candlestick: it closed right at the pivot point with a large bearish candlestick body, and the upper wick rejected the level, indicating there isn’t small overhead selling pressure.
I’m inclined to let it play out on its own first—either until it digests this range—or alternatively, wait for a pullback and then reassess.
These past two weeks surged pretty aggressively—from $86 all the way up to $127—then pulled back to the 8EMA. Now it’s pushing back up into the supply zone at $124.73–$127.43.
However, pay attention to the very last candlestick: it closed right at the pivot point with a large bearish candlestick body, and the upper wick rejected the level, indicating there isn’t small overhead selling pressure.
I’m inclined to let it play out on its own first—either until it digests this range—or alternatively, wait for a pullback and then reassess.