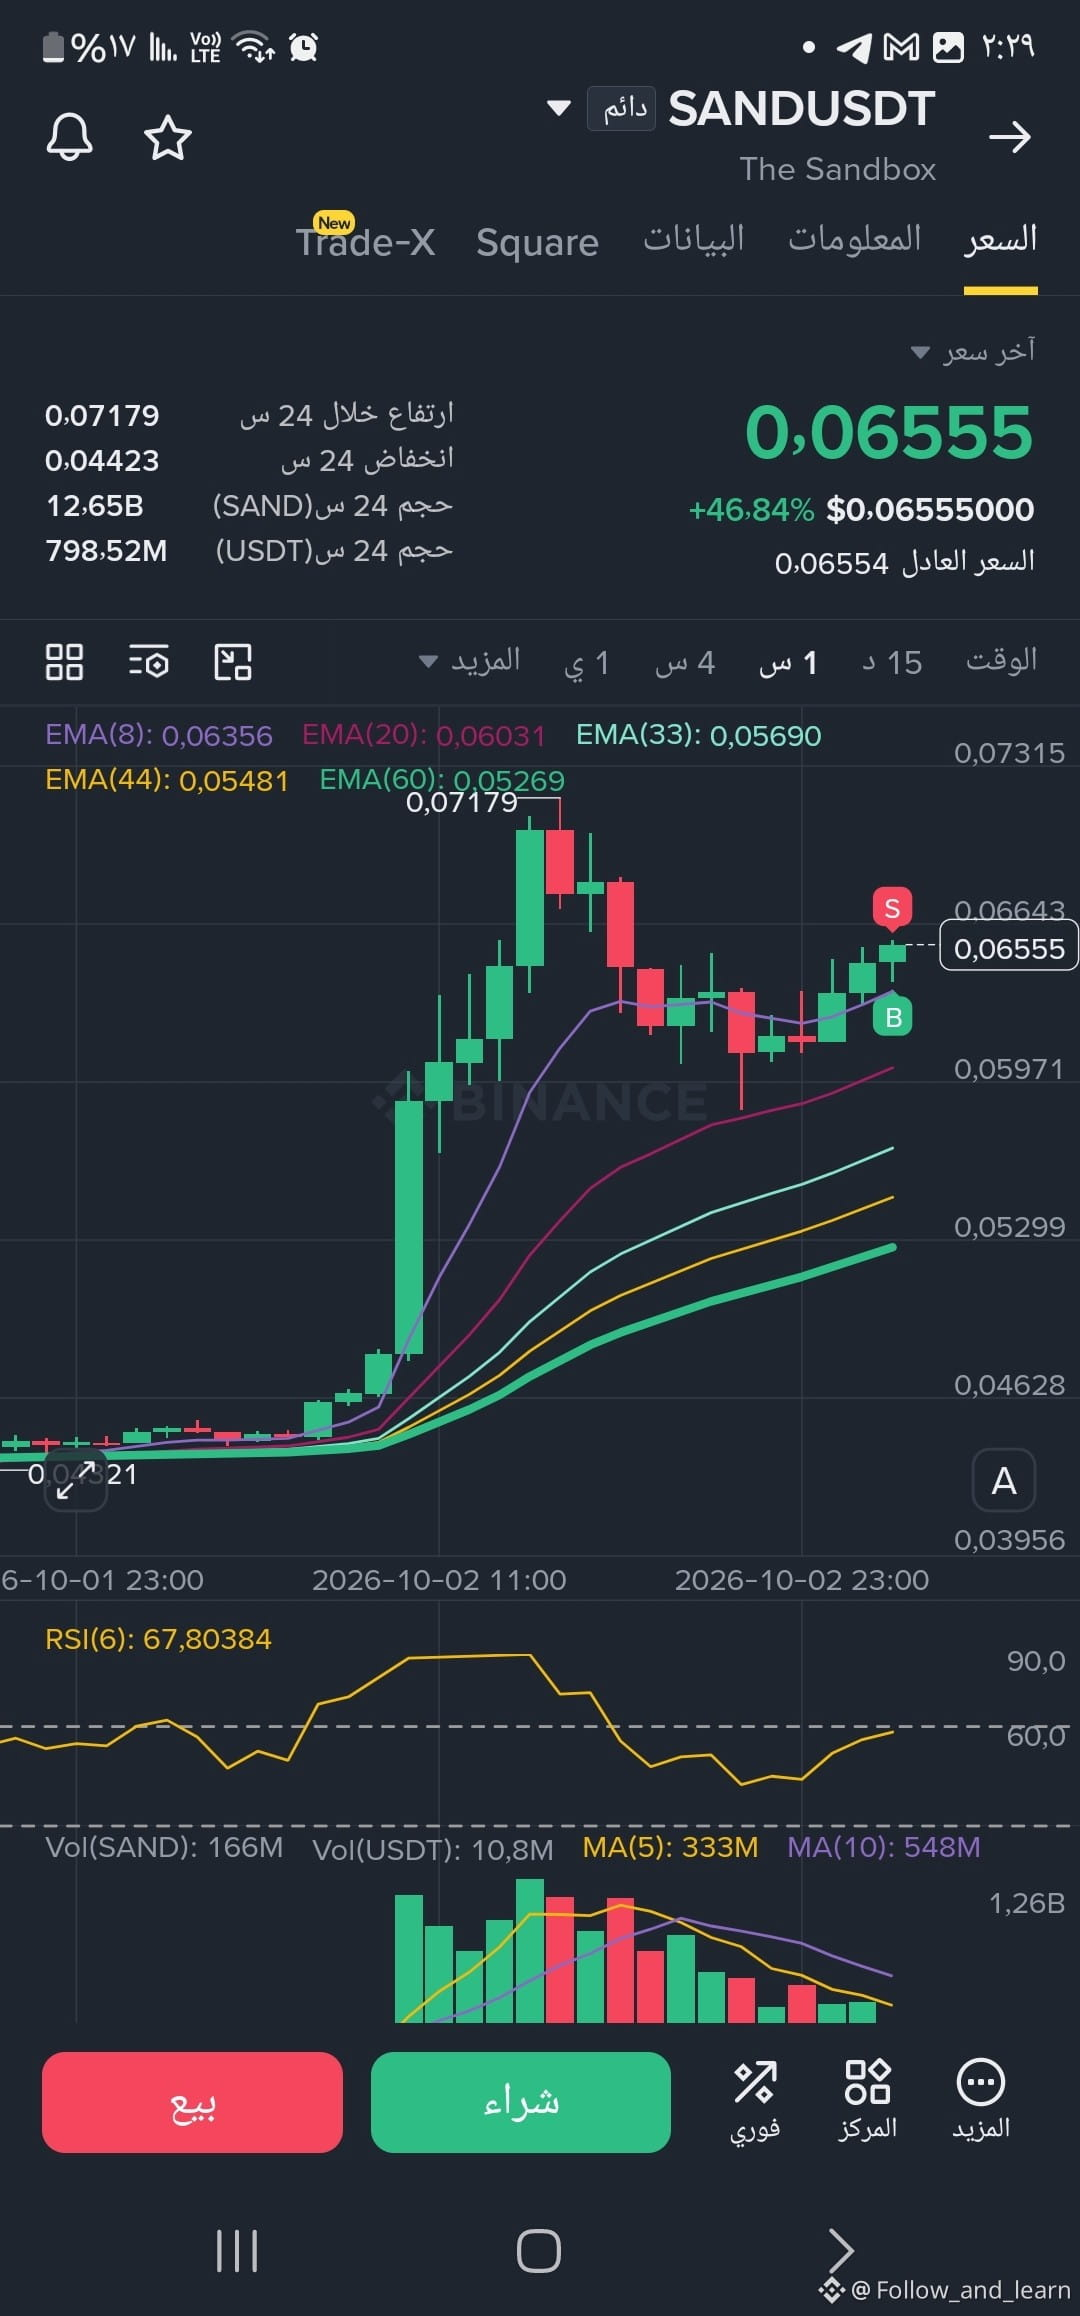
🔥 $SAND Coin Analysis| 1H Frame
A strong surge exceeding +46% within 24 hours, as the price enters a positive accumulation phase above the averages at 0.06555$.
📊 Technical Indicators:
• Moving Averages (EMA): A clear bullish arrangement; trading above EMA 8 strengthens momentum continuation.
• Relative Strength Index (RSI): At a reading of 67.8, reflecting buyer control without being in extreme overbought conditions right after.
🎯 Targets and Resistance:
• 0.06643$ (breaking it opens the path upward)
• 0.07179$ (the main peak of the past 24 hours)
🛡️ Support Levels:
• 0.06356$ (very important immediate support — EMA 8)
• 0.06000$ (support zone and previous correction bottom — EMA 20)
💡 Expected Scenario:
Stabilizing above 0.06356$ may push the price to attack the high at 0.07179$, while breaking the immediate support could send the price into a temporary correction toward the 0.06000$ area to accumulate strength before another attempt.
Not financial advice—do your own research $SAND
#SAND/USDT $ZEC
#ZECUSDT
A strong surge exceeding +46% within 24 hours, as the price enters a positive accumulation phase above the averages at 0.06555$.
📊 Technical Indicators:
• Moving Averages (EMA): A clear bullish arrangement; trading above EMA 8 strengthens momentum continuation.
• Relative Strength Index (RSI): At a reading of 67.8, reflecting buyer control without being in extreme overbought conditions right after.
🎯 Targets and Resistance:
• 0.06643$ (breaking it opens the path upward)
• 0.07179$ (the main peak of the past 24 hours)
🛡️ Support Levels:
• 0.06356$ (very important immediate support — EMA 8)
• 0.06000$ (support zone and previous correction bottom — EMA 20)
💡 Expected Scenario:
Stabilizing above 0.06356$ may push the price to attack the high at 0.07179$, while breaking the immediate support could send the price into a temporary correction toward the 0.06000$ area to accumulate strength before another attempt.
Not financial advice—do your own research $SAND
#SAND/USDT $ZEC
#ZECUSDT