

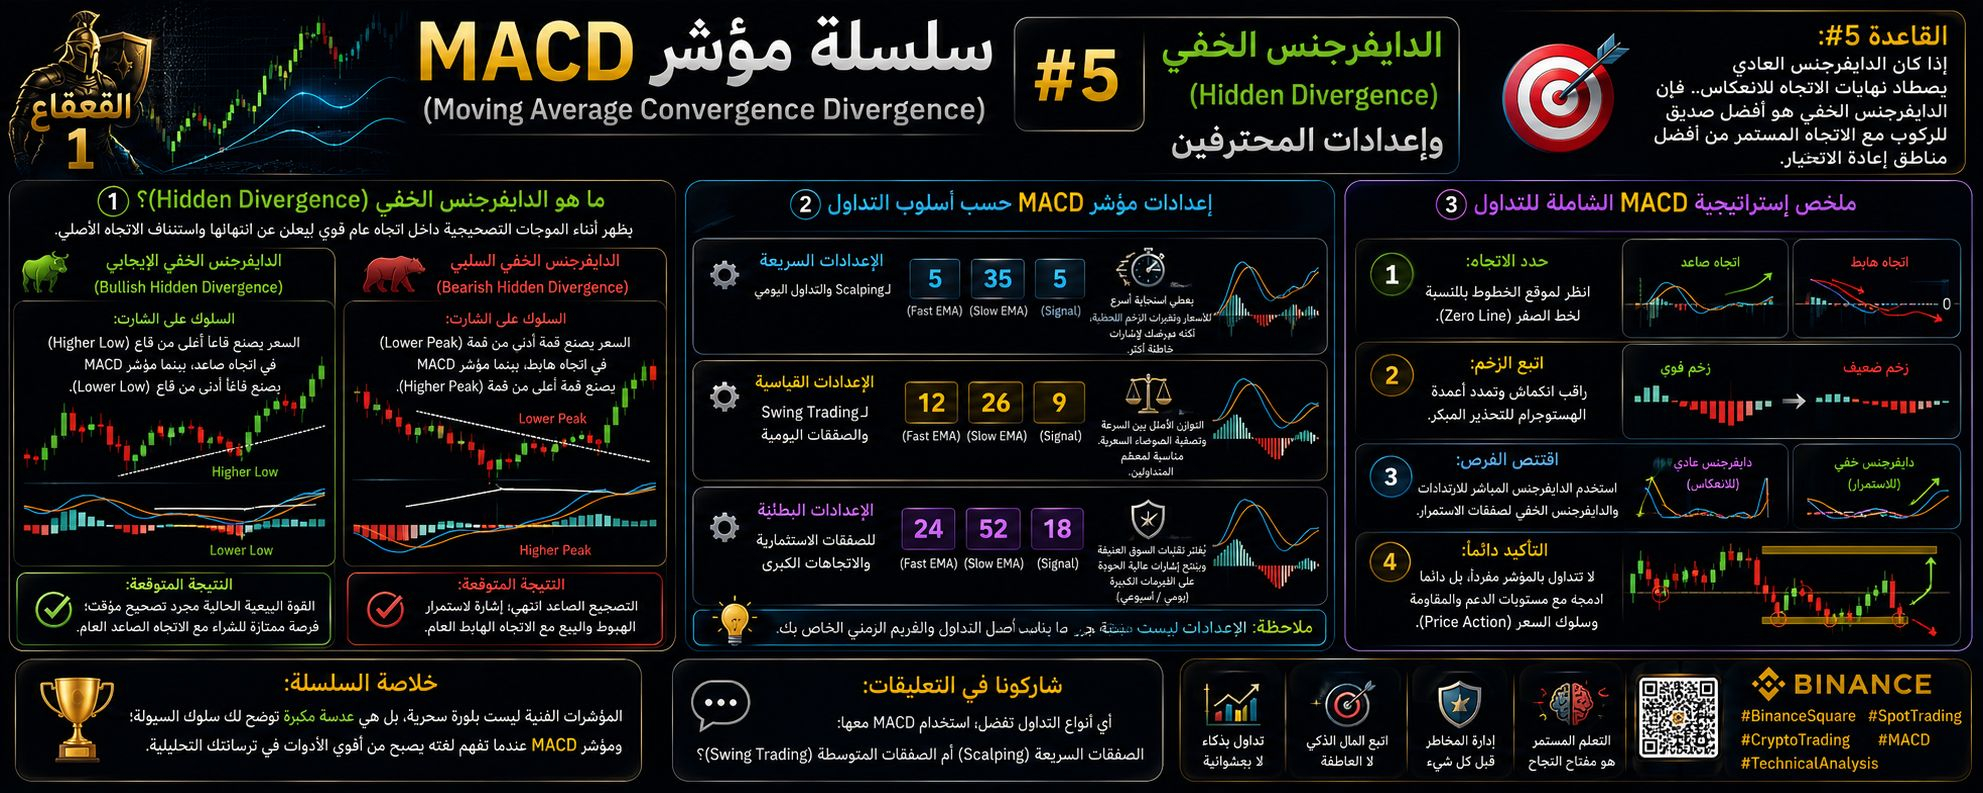

Hello fellow traders! Welcome to the fifth and final station of our educational series about the MACD indicator. After learning the basics, crossovers, histogram bars, and direct divergence, today we conclude with the secret weapon of professional traders: hidden divergence (Hidden Divergence) and how to adjust the indicator settings according to your trading strategy.
🎯 Rule #5: "If regular divergence catches the ends of a trend for reversal… then hidden divergence is the best friend for riding the ongoing trend (Trend Following) from the best retest areas."
💡 1️⃣ What is Hidden Divergence?
Hidden divergence does not target the final highs and lows; rather, it appears during corrective waves within a strong general trend, signaling their end and the resumption of the original trend:
• 1. Bullish Hidden Divergence:
- Behavior on the chart: Price forms a higher low in an upward trend, while the MACD indicator forms a lower low.
- Expected outcome: The current selling strength is only a temporary correction; an excellent buying opportunity with the overall upward trend.
• 2. Bearish Hidden Divergence
- Behavior on the chart: Price forms a lower peak in a downtrend, while the MACD indicator forms a higher peak
- Expected outcome: The upward correction has ended; a signal for the continuation of the decline and selling with the overall downtrend.
---
🧬 2️⃣ MACD indicator settings according to the trading style
The default settings (12, 26, 9) are excellent for most traders, but you can adjust them to fit your style:
• Fast settings (for Scalping and day trading): (5, 35, 5)
- Provides a faster response to price and momentary momentum changes, but it exposes you to more false signals.
• Standard settings (for Swing Trading and day trades): (12, 26, 9)
- The optimal balance between speed and filtering price noise.
• Slow settings (for investment trades and major trends): (24, 52, 18)
- It filters out extreme market volatility and produces high-quality signals on larger timeframes (daily/weekly).
---
🔍 3️⃣ A complete MACD trading strategy summary
To achieve the best results on the chart:
1. Identify the trend: look at the position of the lines relative to the Zero Line.
2. Follow the momentum: watch the contraction and expansion of the histogram bars for an early warning.
3. Seize opportunities: use direct divergence for bounces and hidden divergence for continuation trades.
4. Always confirm: don’t trade based on the indicator alone; always combine it with support and resistance levels and price action behavior.
---
⚖️ Series summary:
"Technical indicators are not a magic crystal; they are a magnifying glass that shows you liquidity behavior. And when you understand MACD’s language, it becomes one of the strongest tools in your analytical arsenal."
---
💬 Share with us in the comments:
Which types of trading do you prefer to use MACD with: quick trades (Scalping) or medium-term trades (Swing Trading)?
#BinanceSquare #cryptotrading #MACD #TechnicalAnalysis #القعقاع_1


