

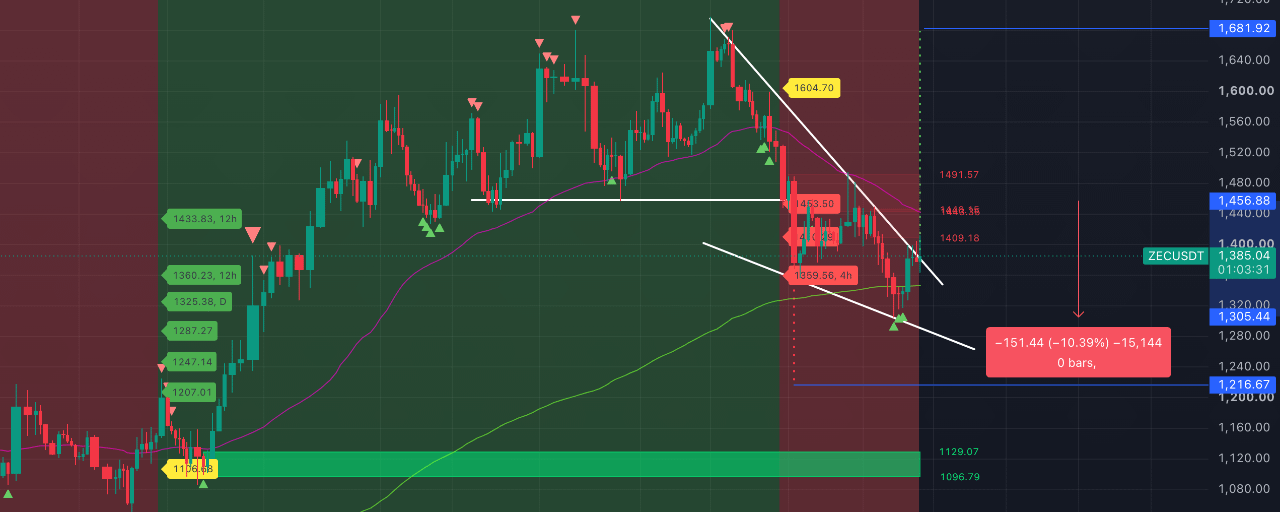


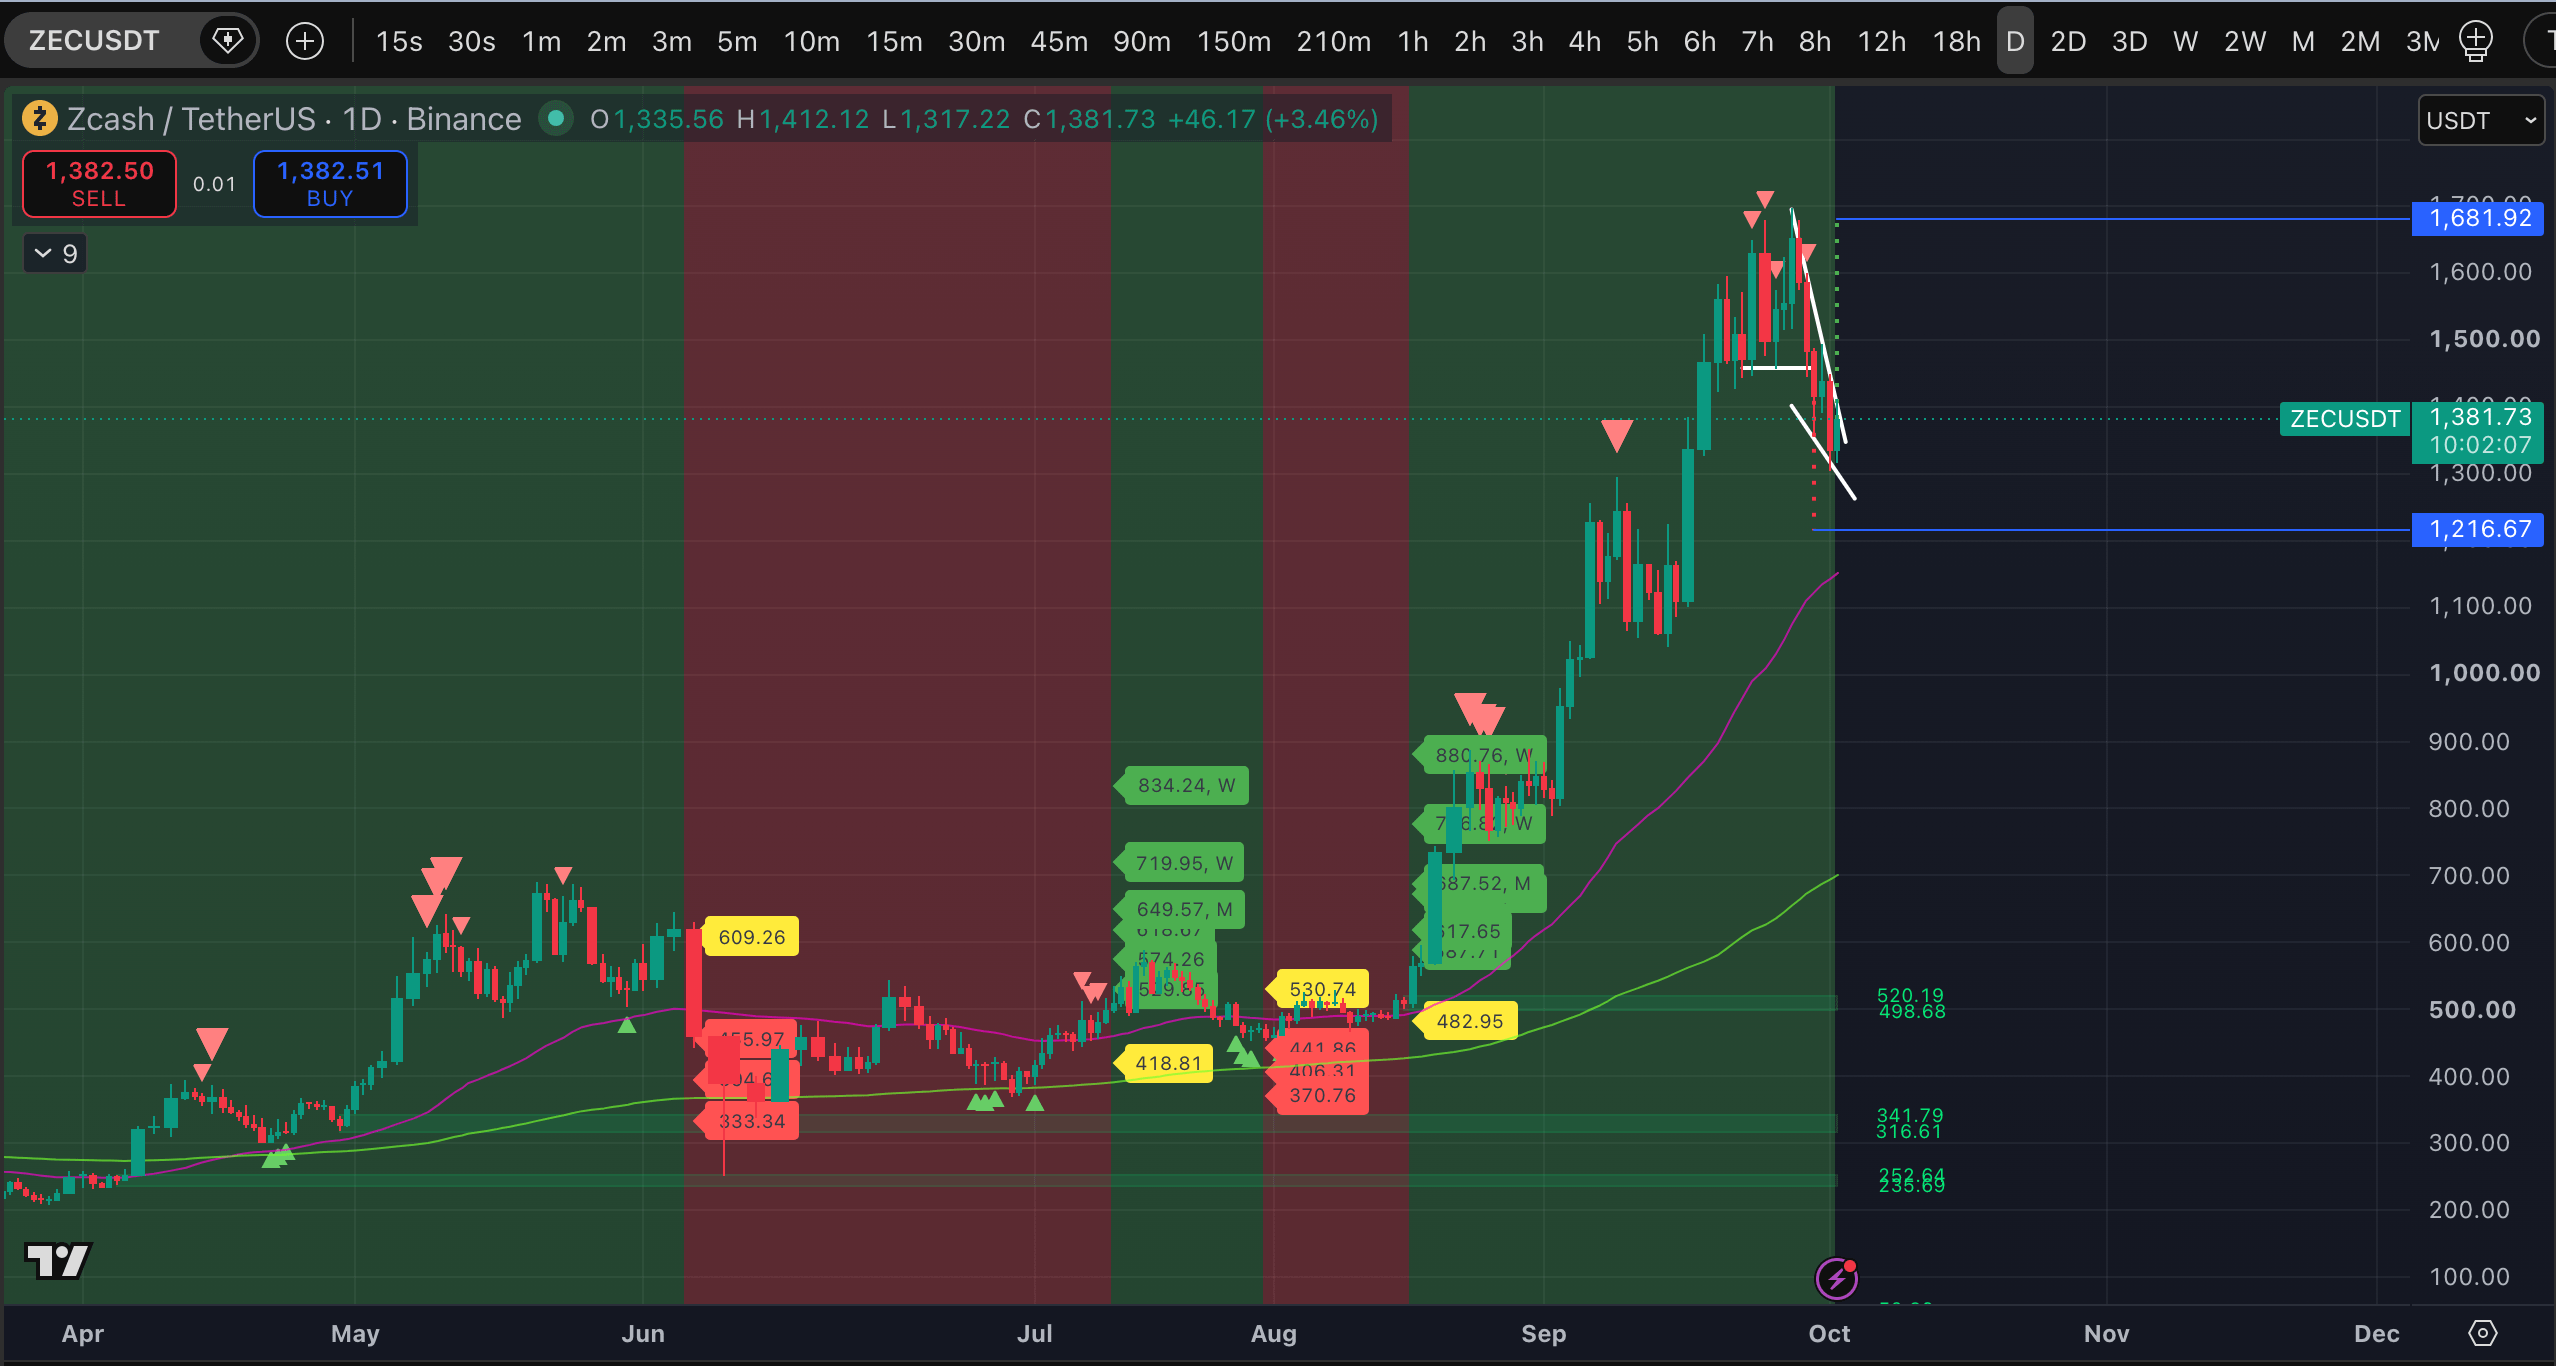
This night, for the first time since early August, ZEC has shifted into a sustained downtrend on the 12- and 18-hour timeframes. That looks quite unusual against the backdrop of a buoyant market.
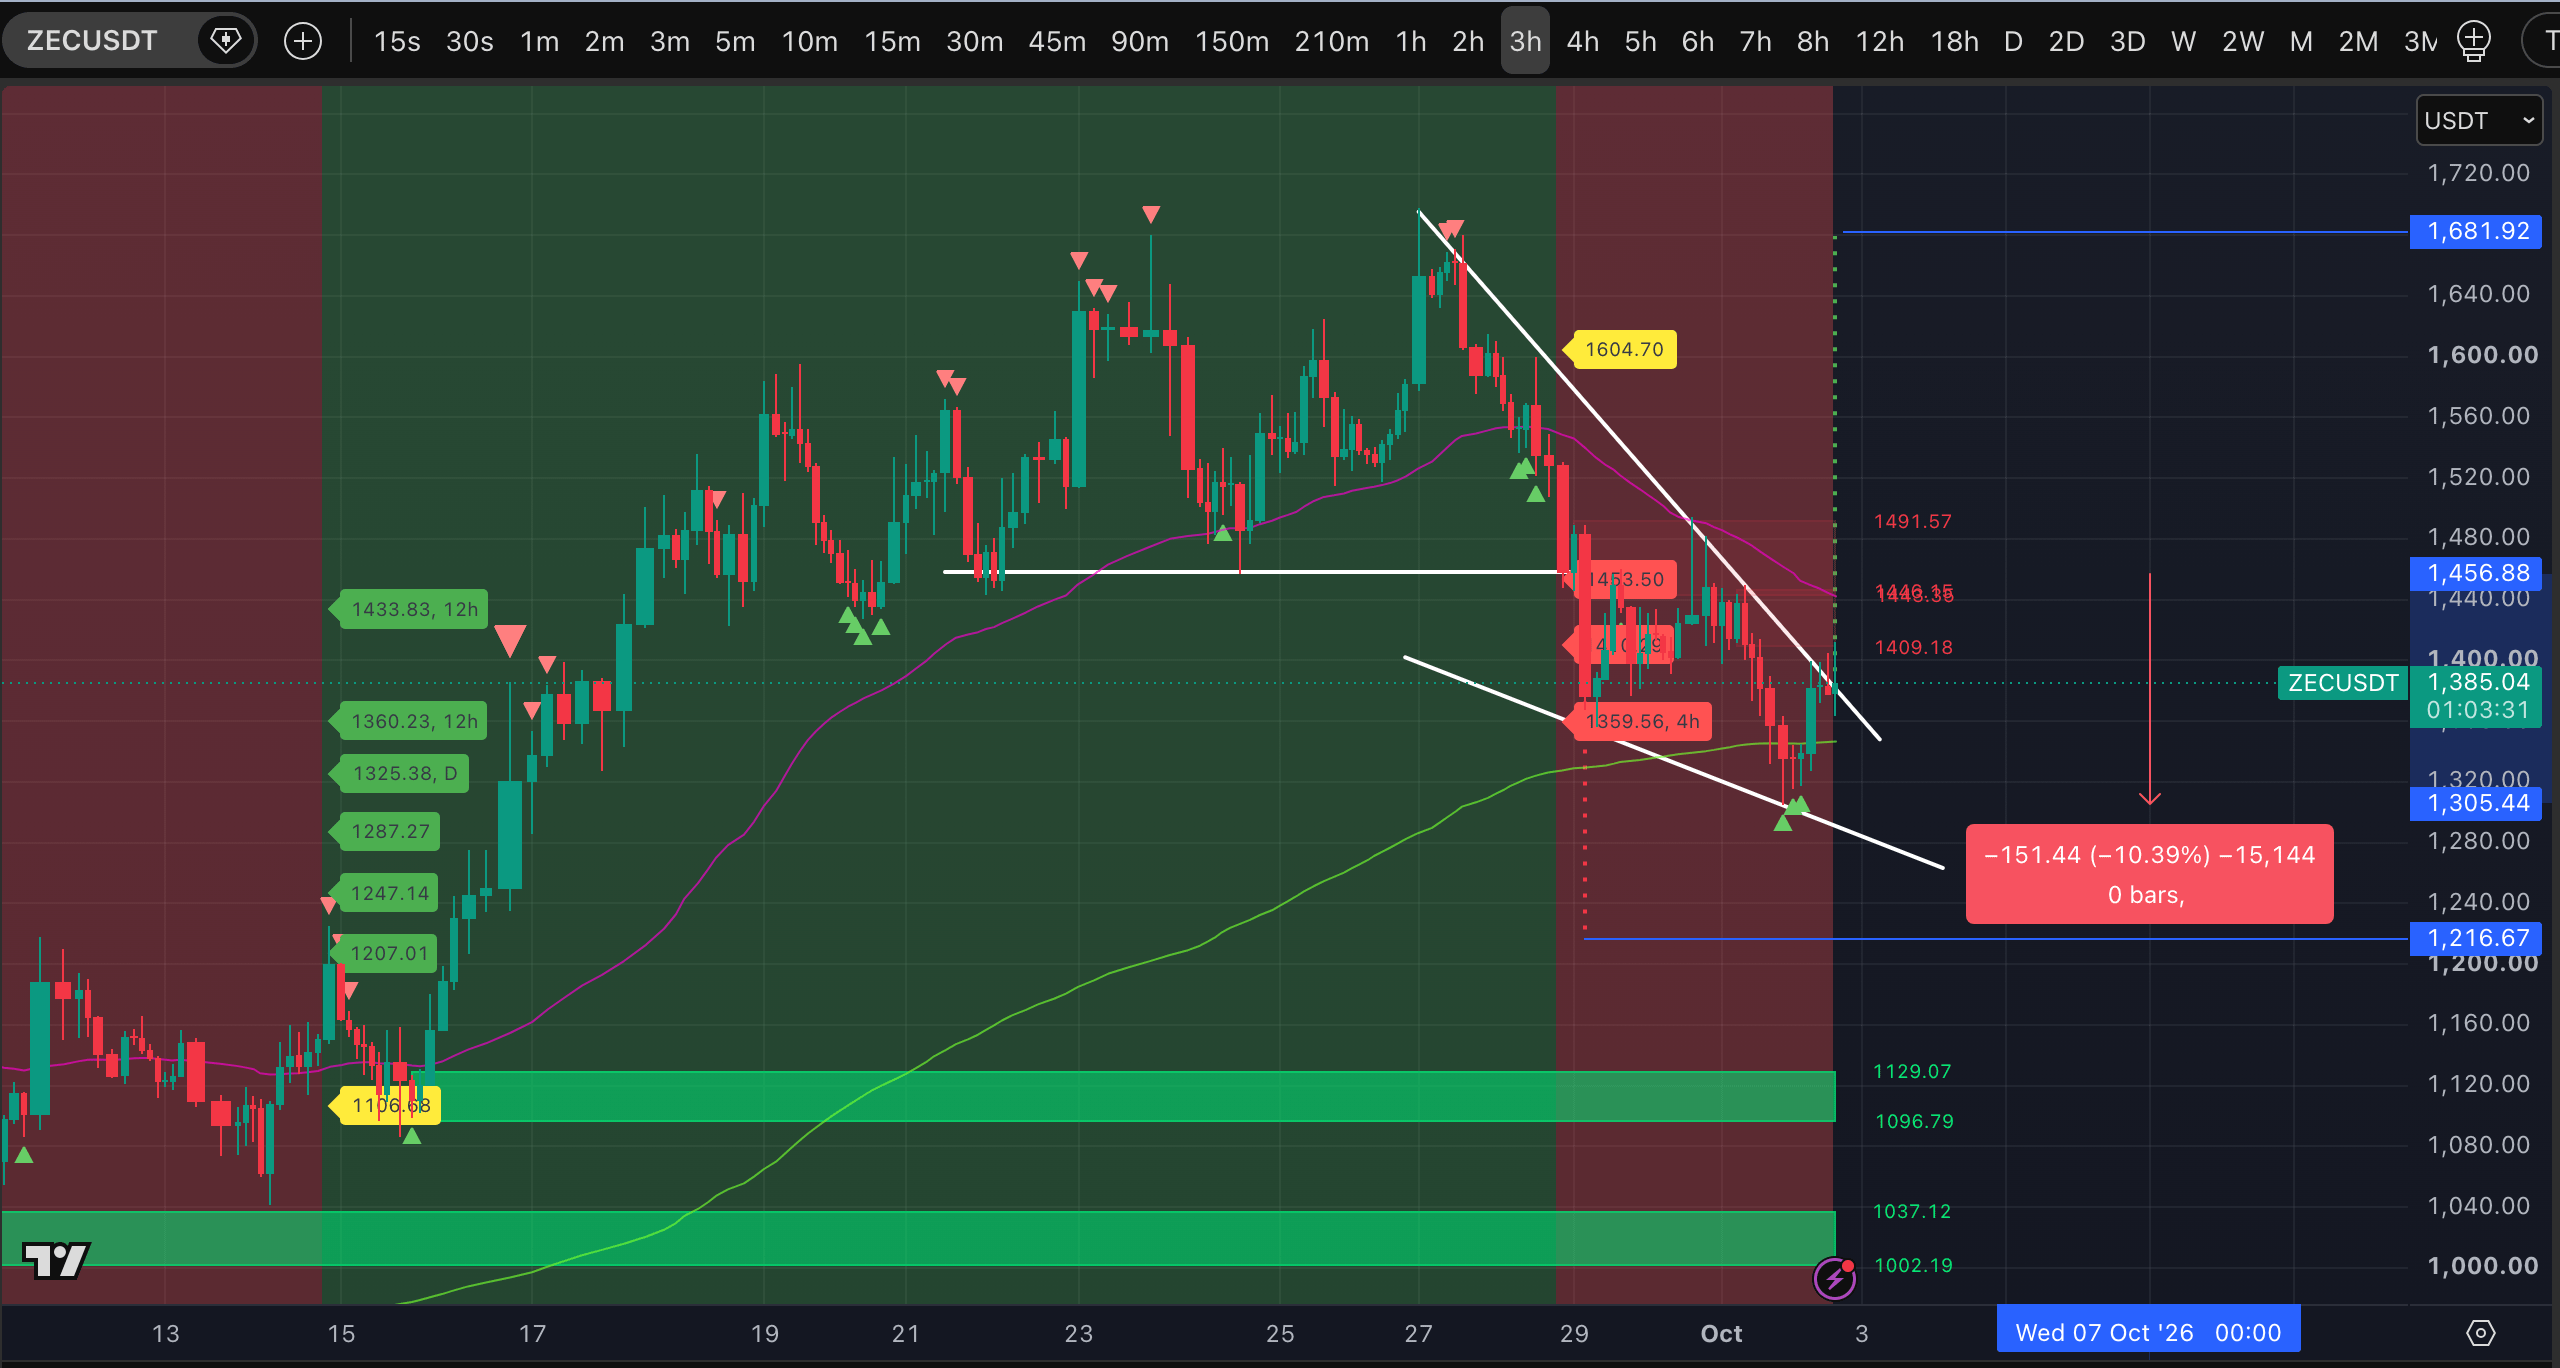
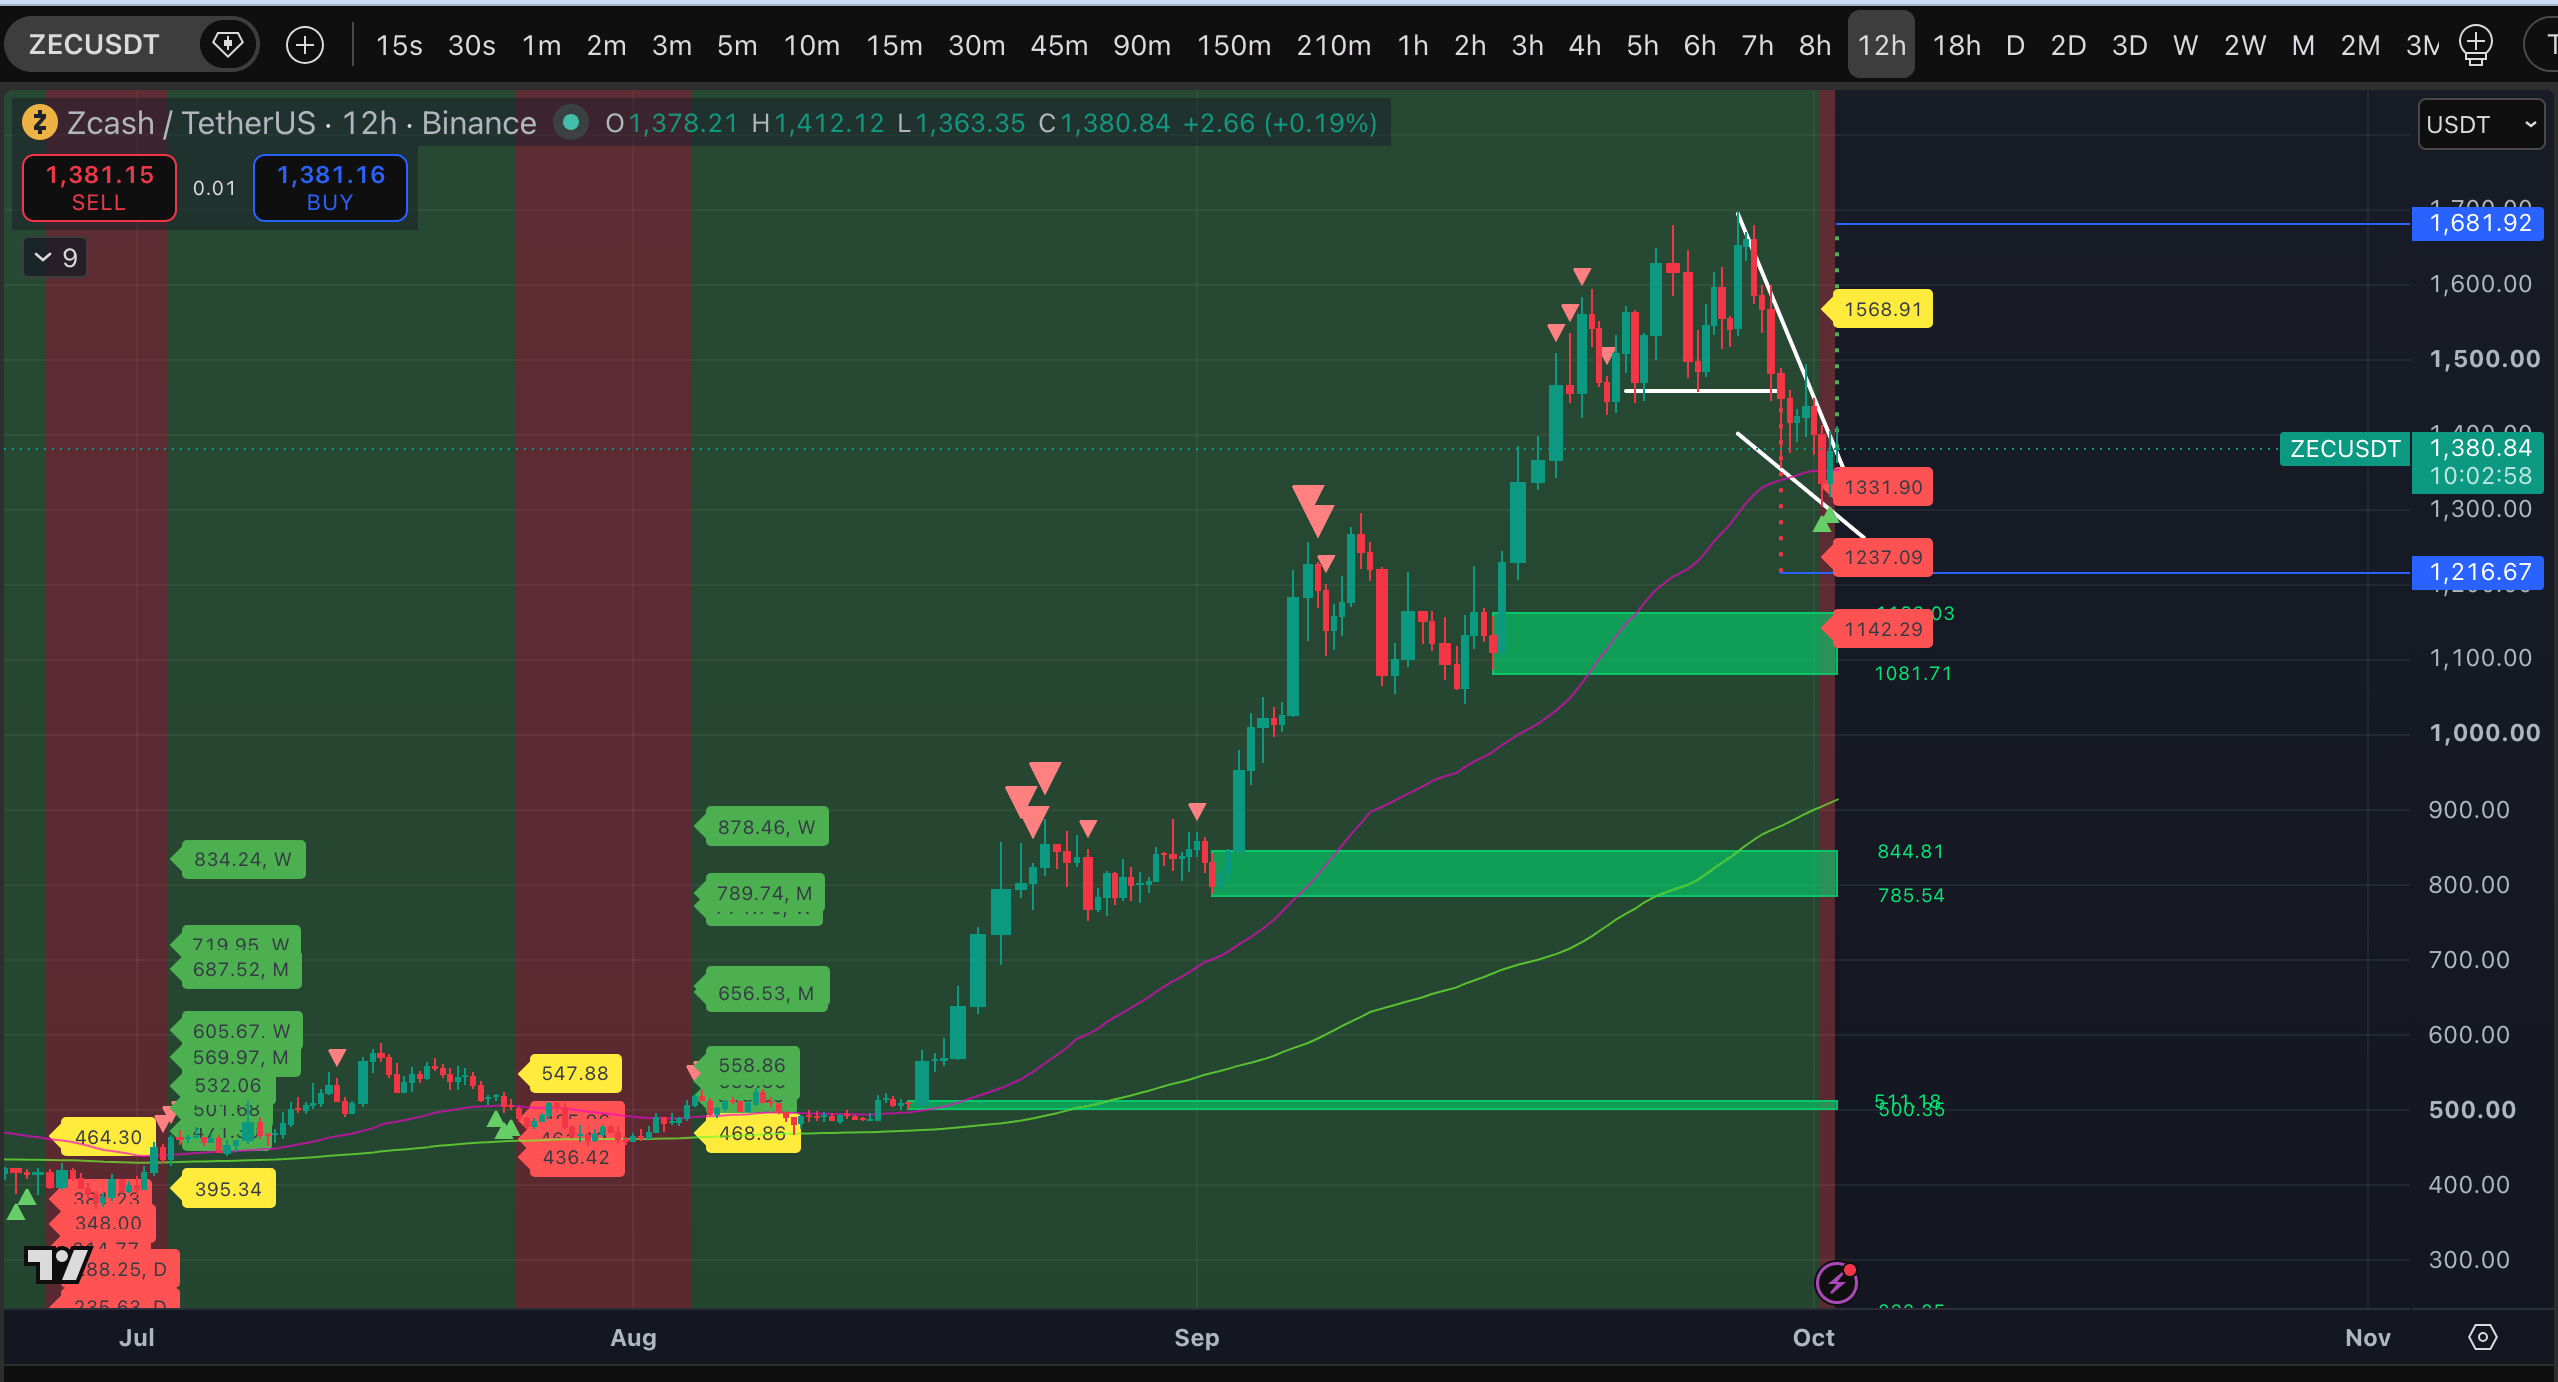
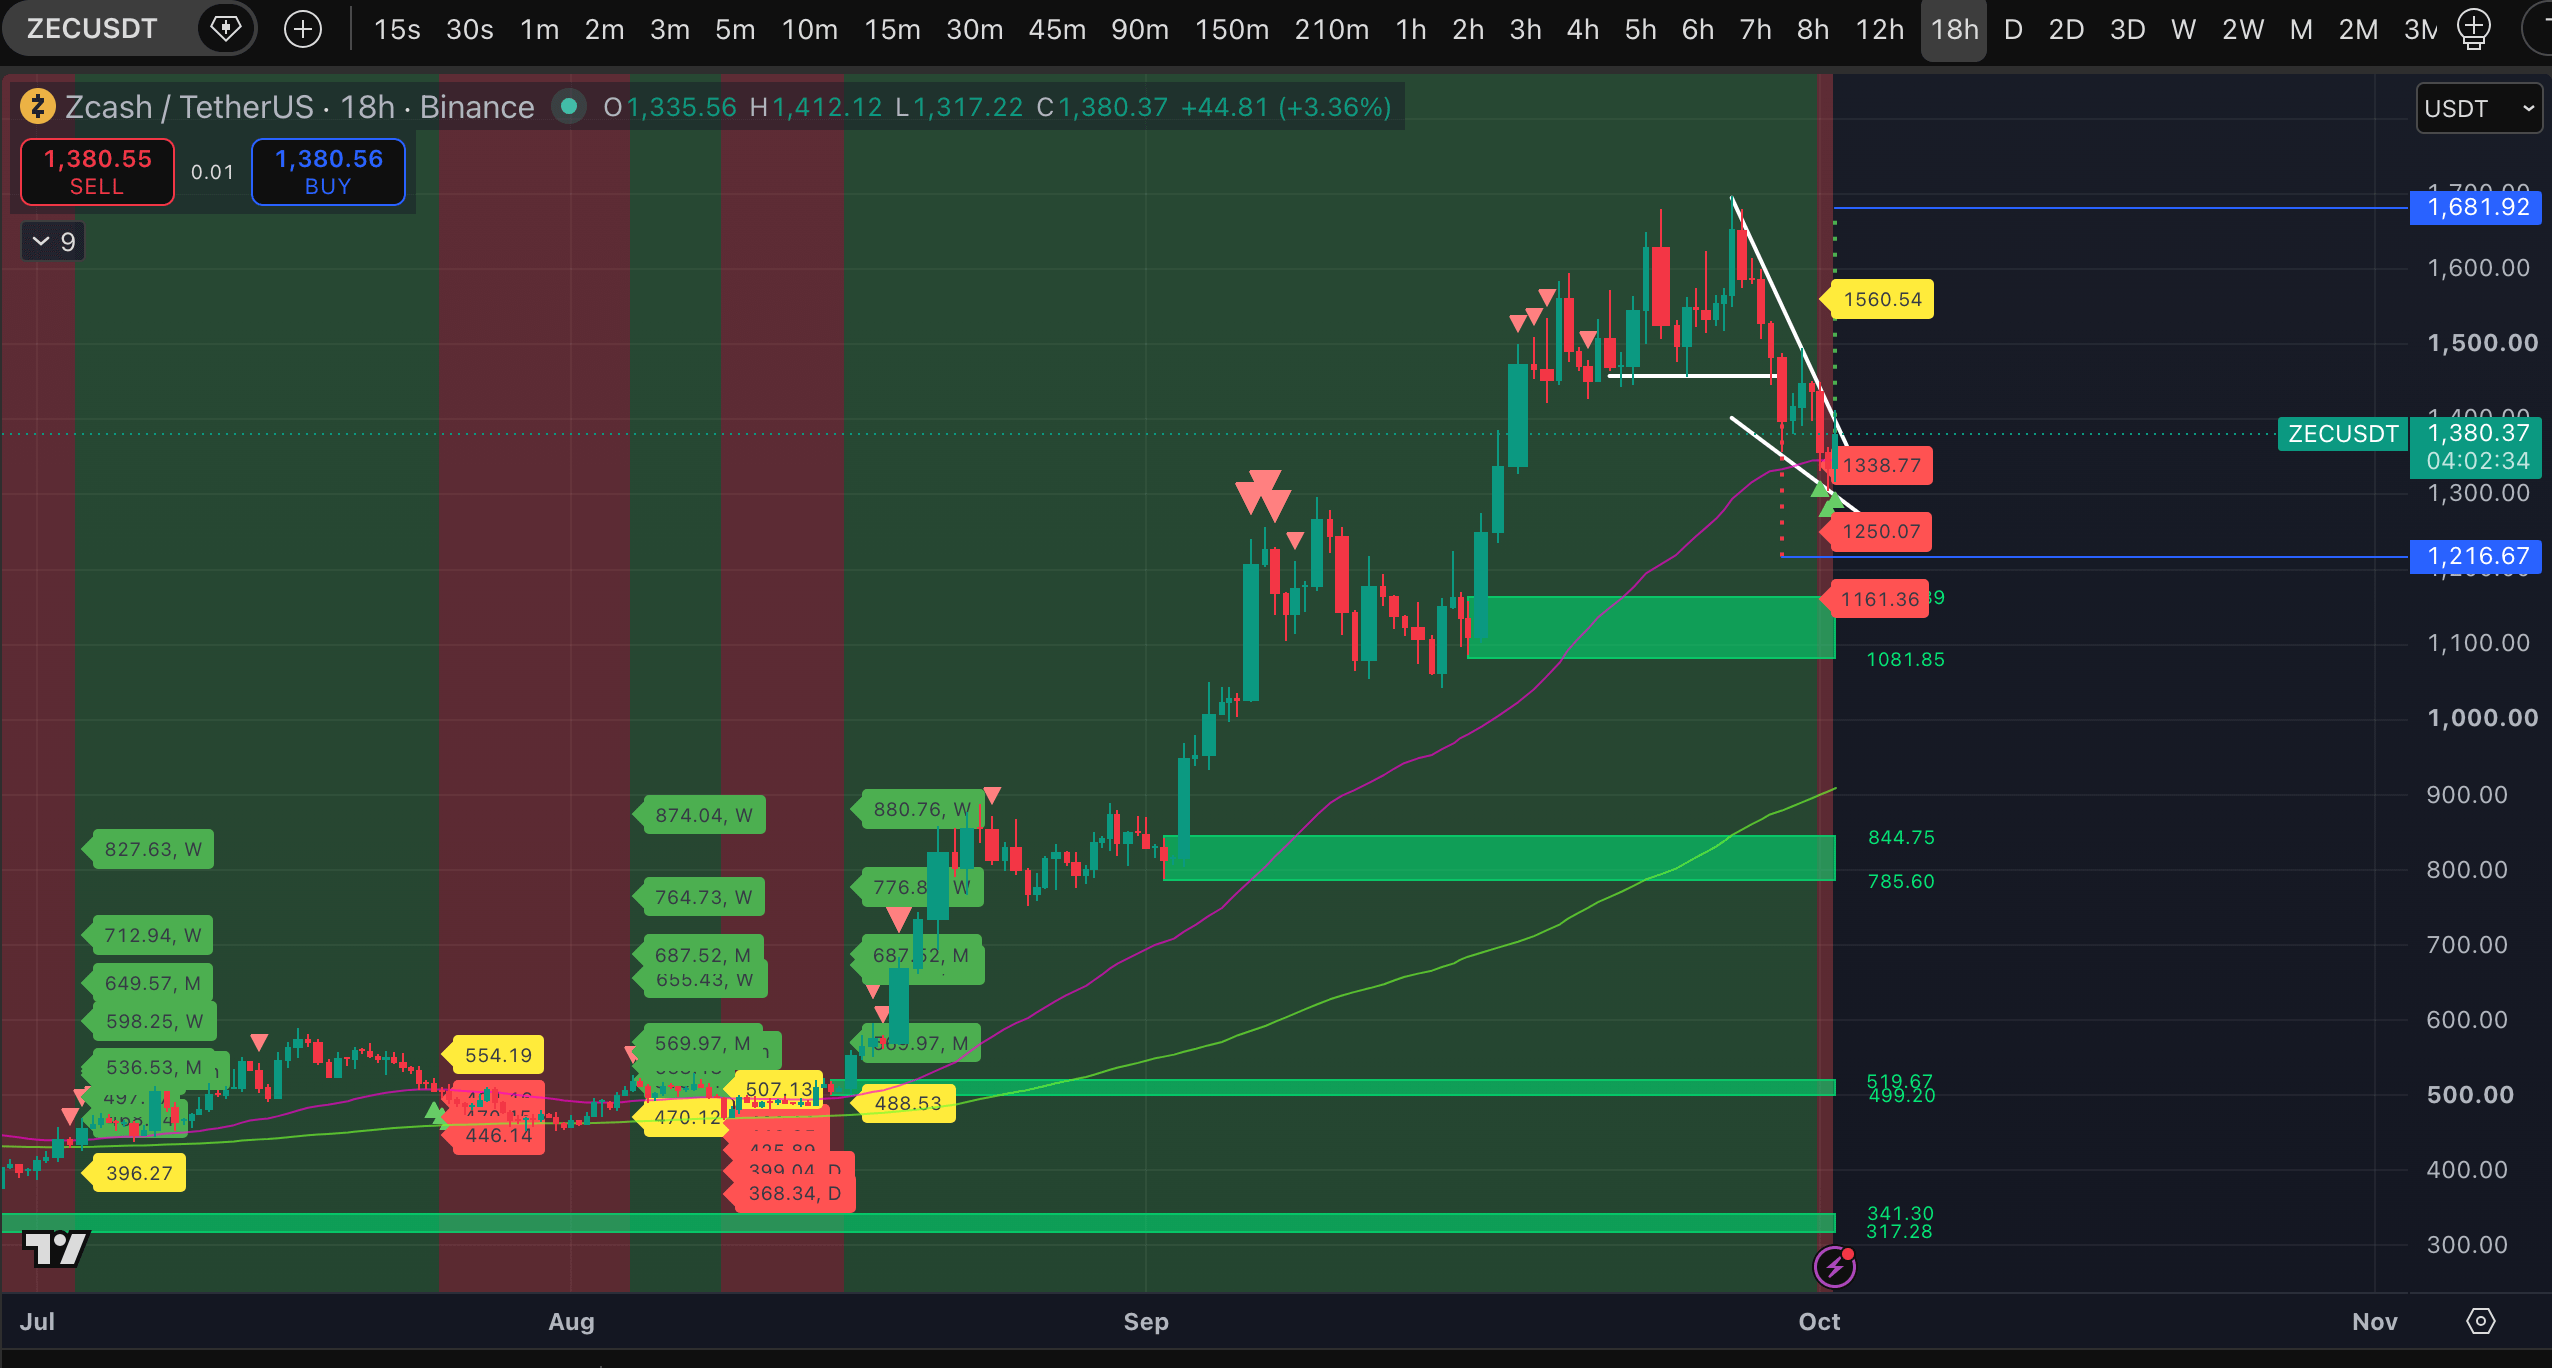
NOT at all unusual, considering our earlier higher-timeframe analysis of the asset, which we did on September 19.
First, a brief reminder, and at the end — a new breakdown. Spoiler: we’re waiting for a noticeable bounce, and then — further down.
Back then we wrote that from the end of September—early October, we expect the start of a long-term correction.
Literally, the post from September 19; the main part:
"... Against the backdrop of bets on Polymarket for $2,000 by the end of 2026 and technical analysis involving a "Cup with Handle" with a target above $3,100, we will share an unpopular opinion: the rise in #ZEC may end before the end of September, after which the asset will embark on a VERY long and strong correction.
The reason for this view is that there have already been three Strong signal marks for a potential high on the 3-month timeframe (❗️). There is no such thing as an eternal rise, and if a pump took the price to those levels, then why not bet on the likelihood of a reversal right now. Especially amid mass hysteria.
Maybe the asset will show some kind of further local high after September, BUT overall, what these Strong signal marks bring—shows it well in BTC, which had similar marks on the 3-month timeframe in October 2024—March 2025. There was a local high of $109,588, but it all ended with a move to the current low of $57,800.
Our view is that the next shift of sustained trends from an uptrend to a downtrend on the 3- and 4-hour timeframe for #ZEC will become a good long-term short entry point..."
What do we see right now? Since September 19, the asset has shown a new high, and even twice: on September 23 and September 27. As a result, it confirmed the "Double Top" with a full target of $1,216. At the same time, marks for a potential high were obtained on the daily timeframe. And this week, the asset produced a fresh Strong signal for a potential high on the weekly timeframe, which drives another nail into the coffin of the bears’ expectations.
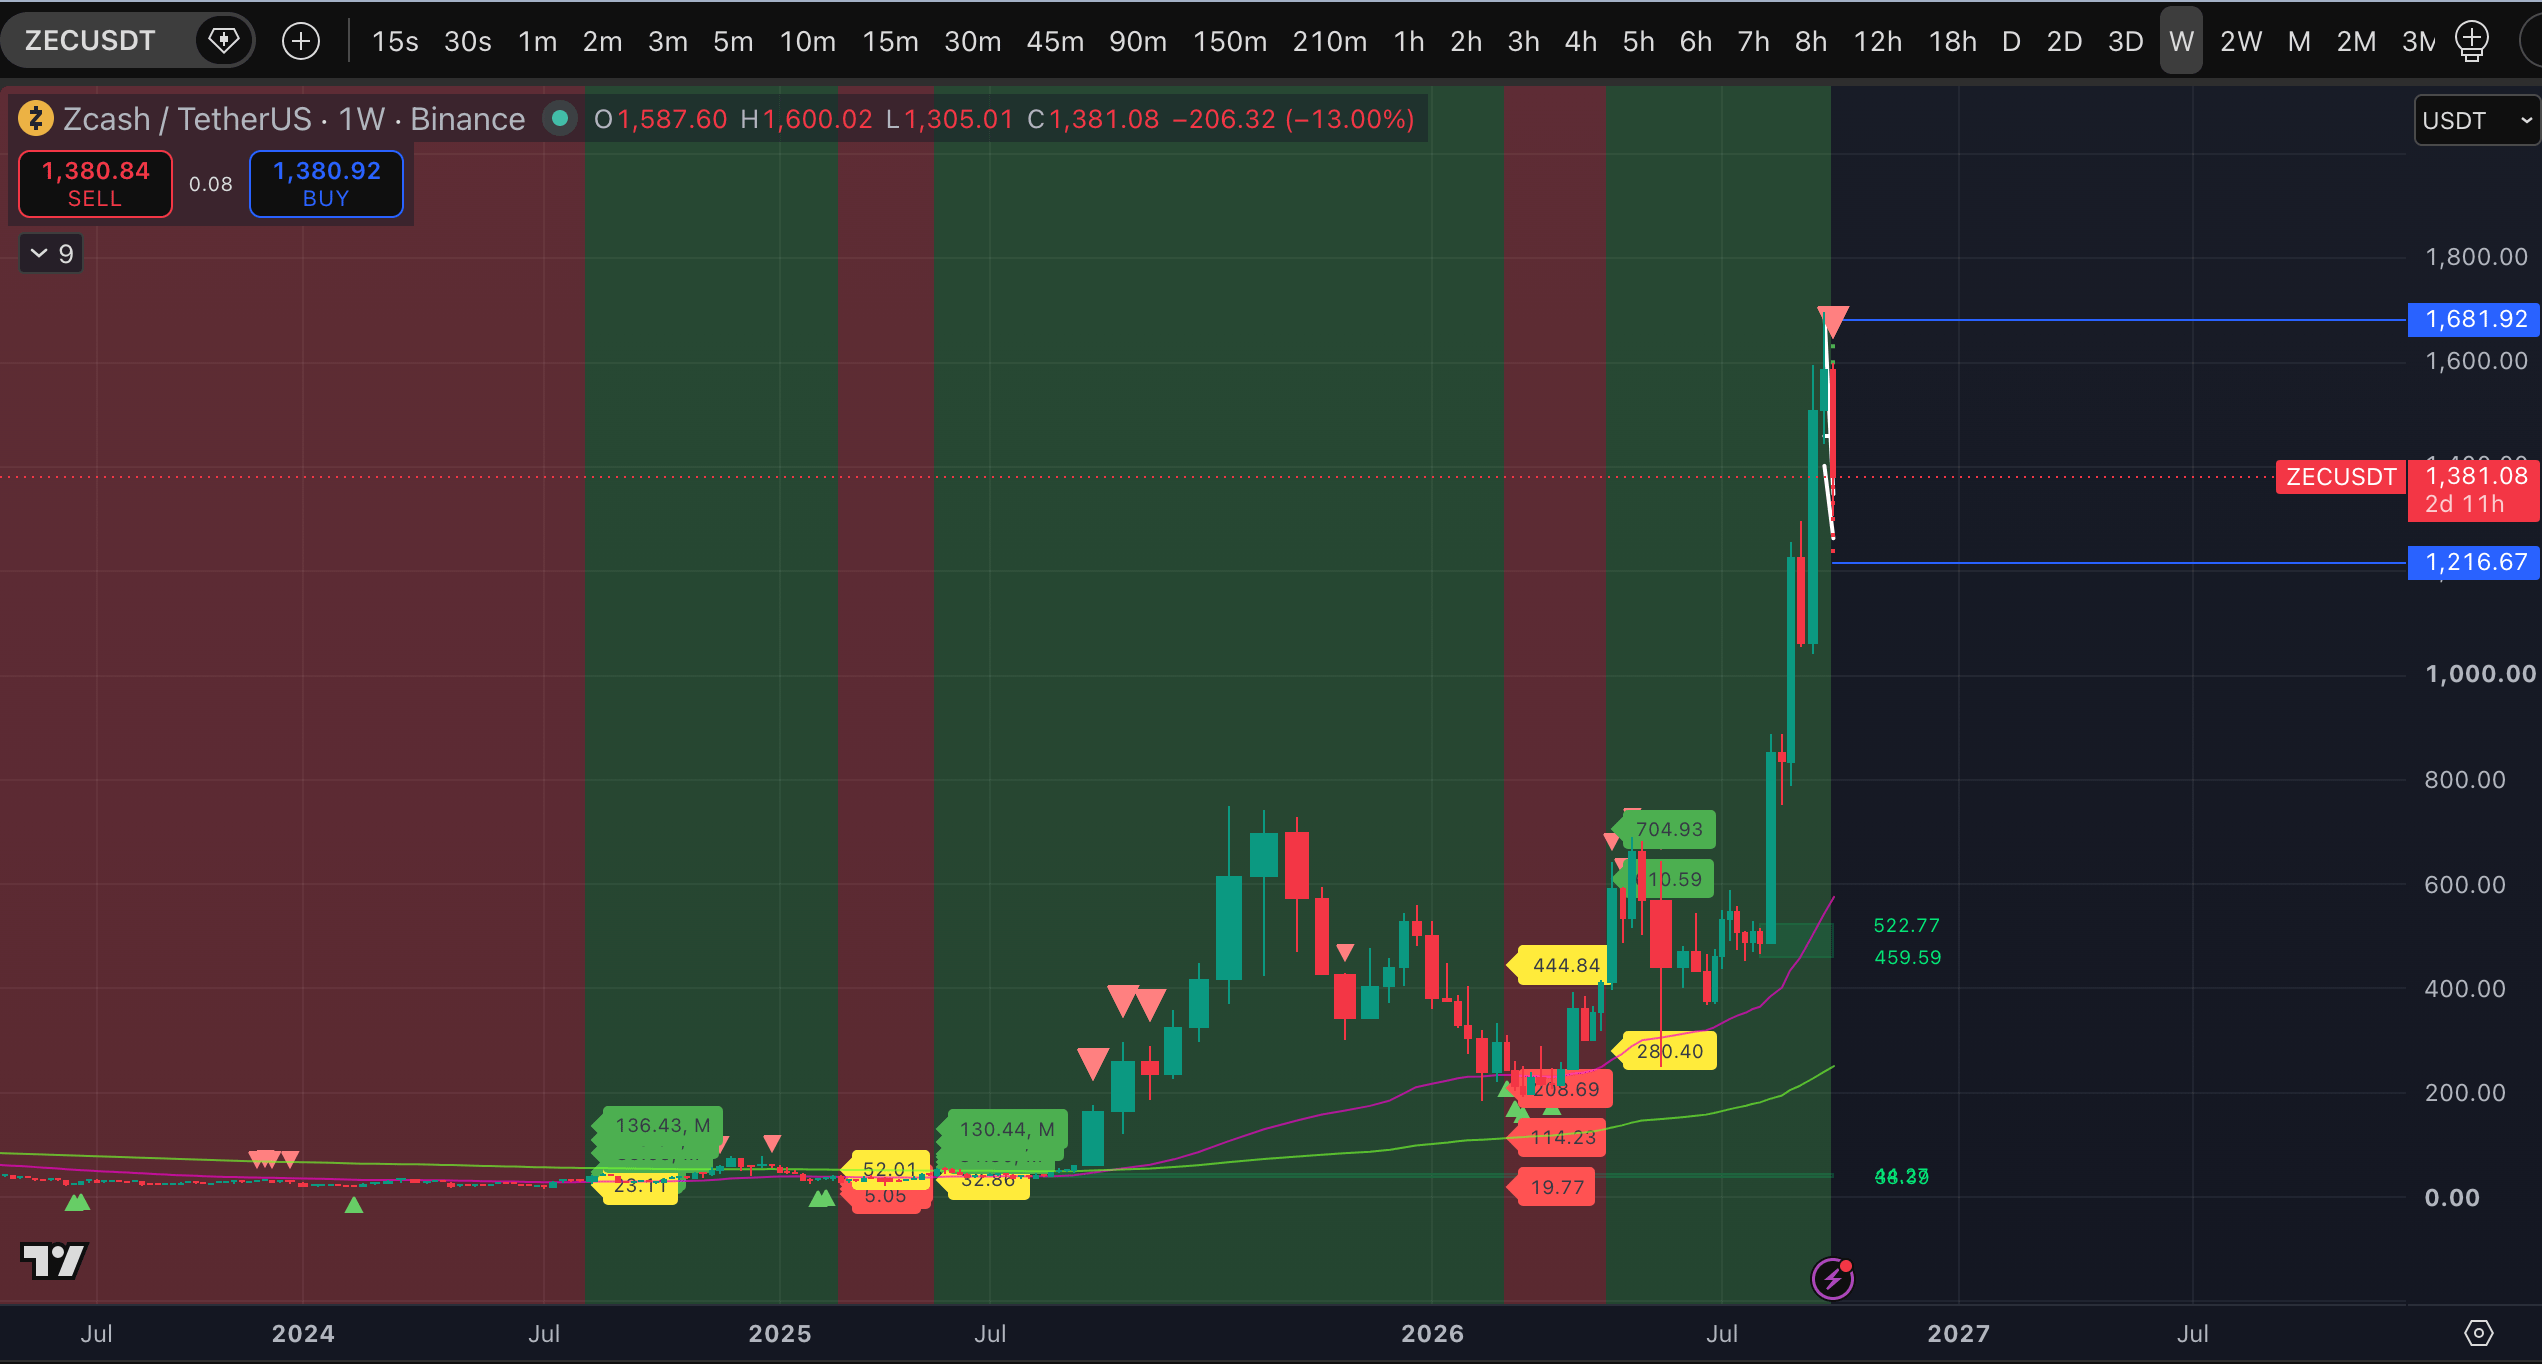
Then on September 28, the asset finally showed a break in the downtrend on the 3-hour timeframe, right as it was testing the "neckline" of the "Double Top." After that, the pattern started playing out. As a result, from the trend break, the price has already moved more than 10% from the low of yesterday’s day. So the recommendation to consider shorts on this signal turned out to be justified.
What are we waiting for next? A bounce in this correction, and it could be quite strong. Today the price broke out of the "Bullish wedge" with the full target around $1,681, but so far the breakout is not confident. It’s bumping into the liquidity zones shown in the screenshot. More important: there are marks for a potential low on the 3-, 12-, and 18-hour timeframes. The bounce is developing from those levels right now.
Opinion on the asset: at the likely bounce right now, this is a good time to build up/add to a short position for the long term. With special emphasis on the potential downtrend-break level at $1,568. The invalidation of the expectation of a long-term correction (more precisely, the postponement of the attempt to start it—given such potential high marks on the 3-month timeframe, it is highly unlikely to keep growing already) will only happen if, within the bounce, the price returns to a sustained uptrend on the 18-hour timeframe. Higher timeframe with a downtrend.
If a global correction has started—what targets should we look at right now? Our indicator currently won’t show any significant targets, only basics on the 12- and 18-hour timeframes. But you can ориентate on horizontal levels or Fibonacci levels. Especially since often they match one-to-one. The correction signal is global, so the trend is also global—from spring 2023 up to the high of this autumn:
- level 0.618 - $1,056.22,
- level 0.5 - $875.97,
- level 0.382 - $659.72,
- and for the absolute skeptics, level 0.236 - $414.43.
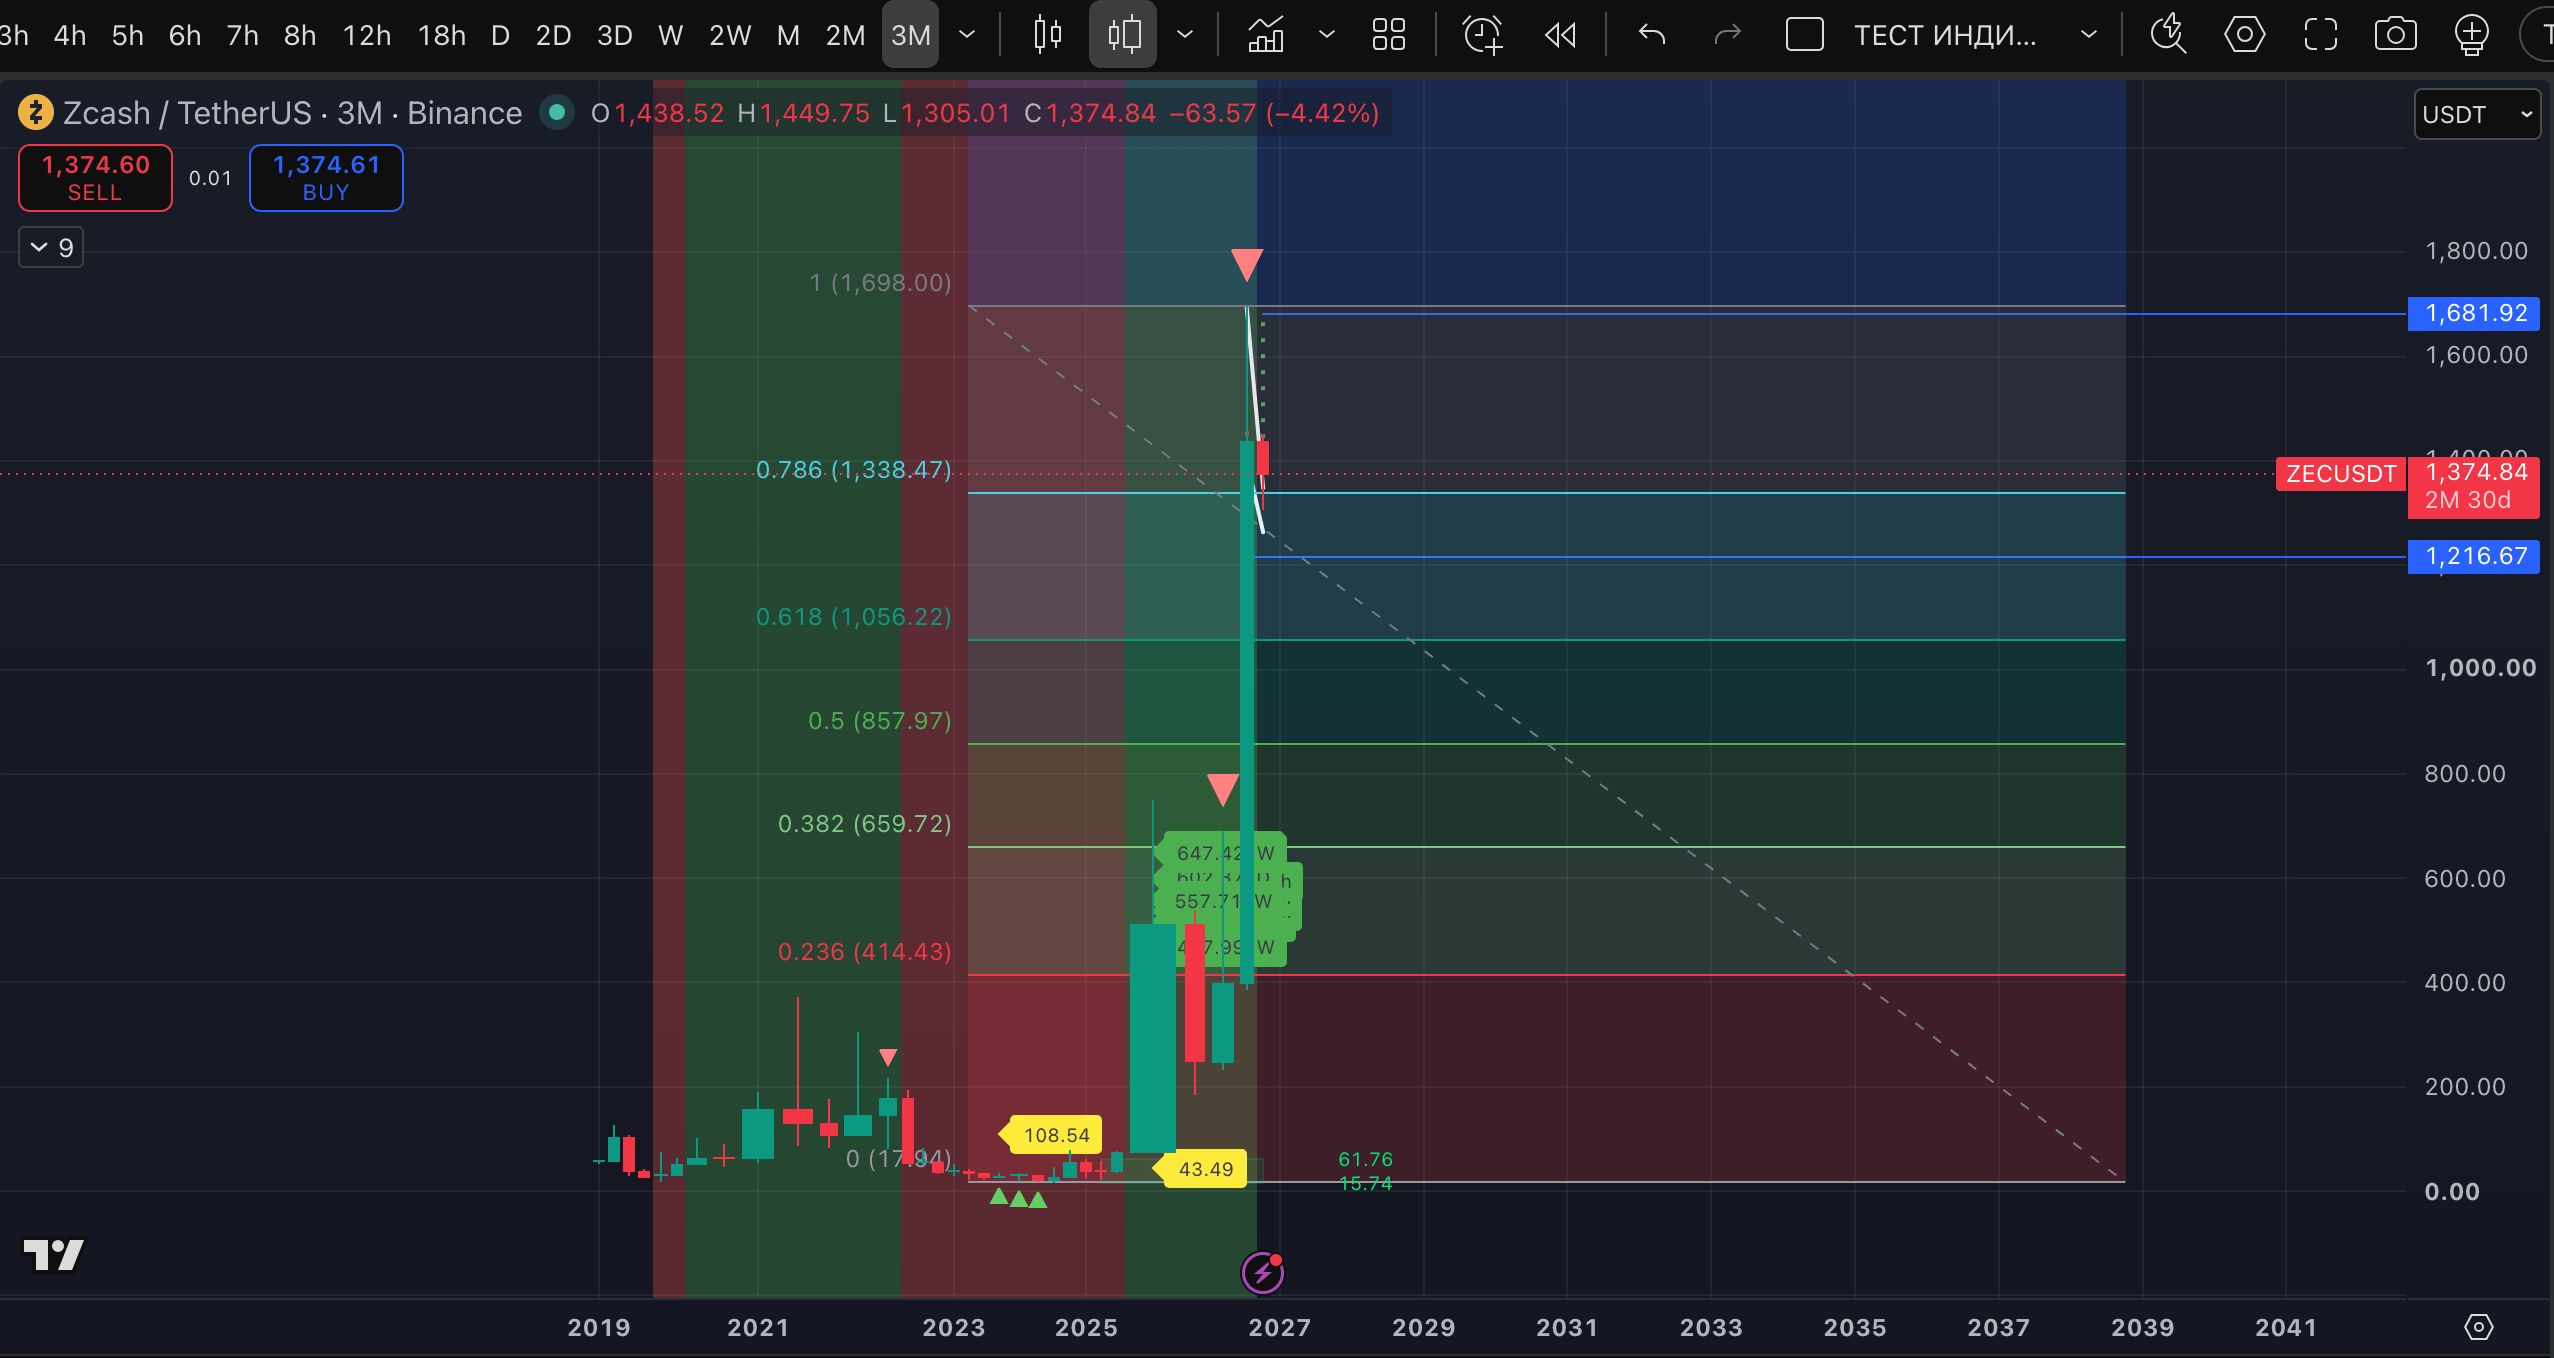
In a bull market, the last two targets seem impossible. But in any case, you should follow the trend. Confirmations that price could head at least toward the first two targets would be sustained downtrends on the 3-day and weekly timeframes.