Is BNB ready to follow the daily trend higher?
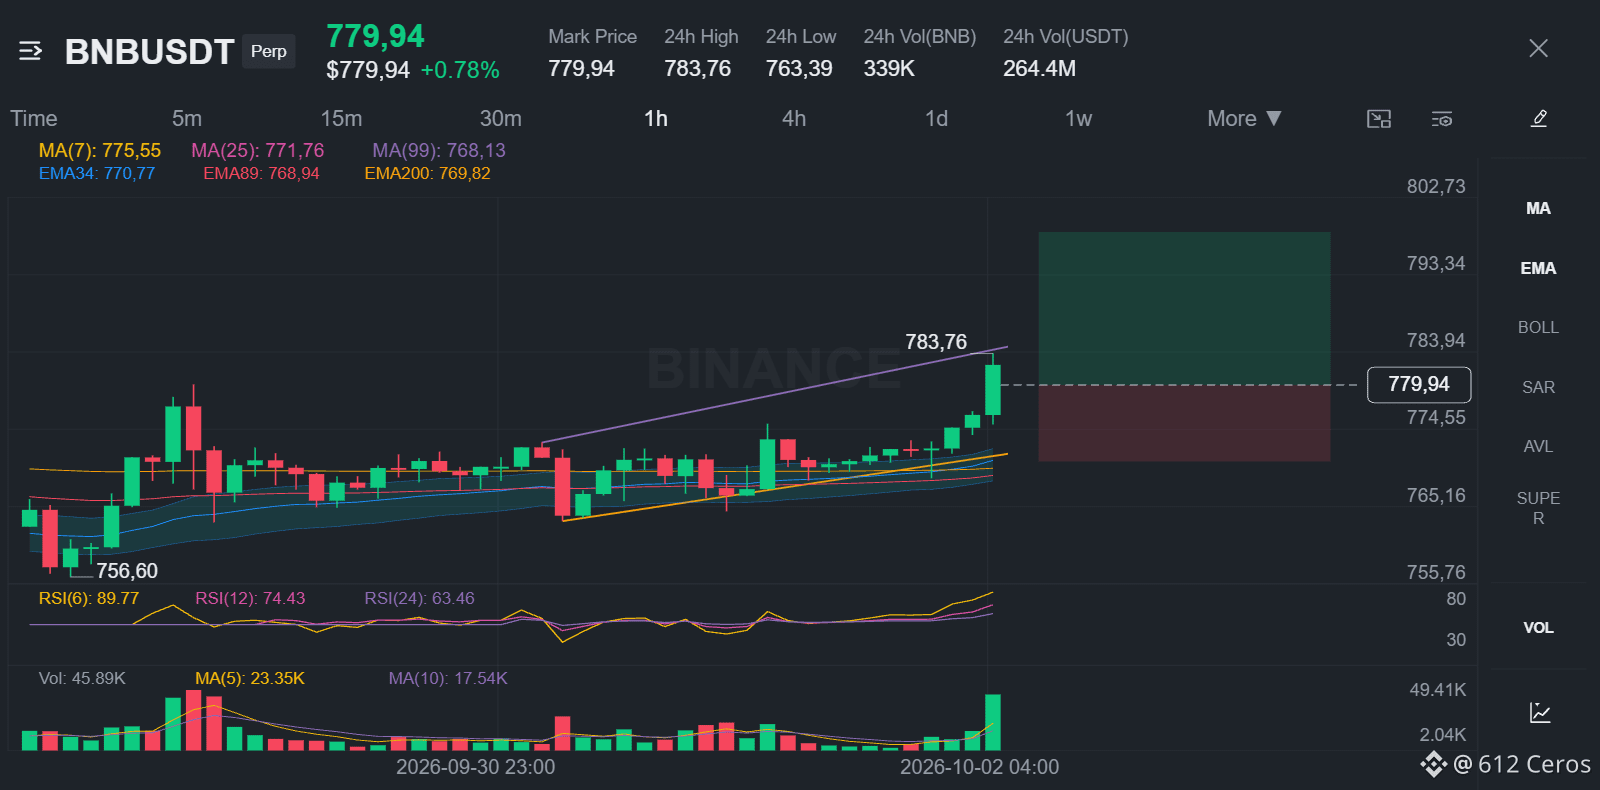
🟢 LONG $BNB /USDT: expecting price to go UP
Bias: LONG · Strong
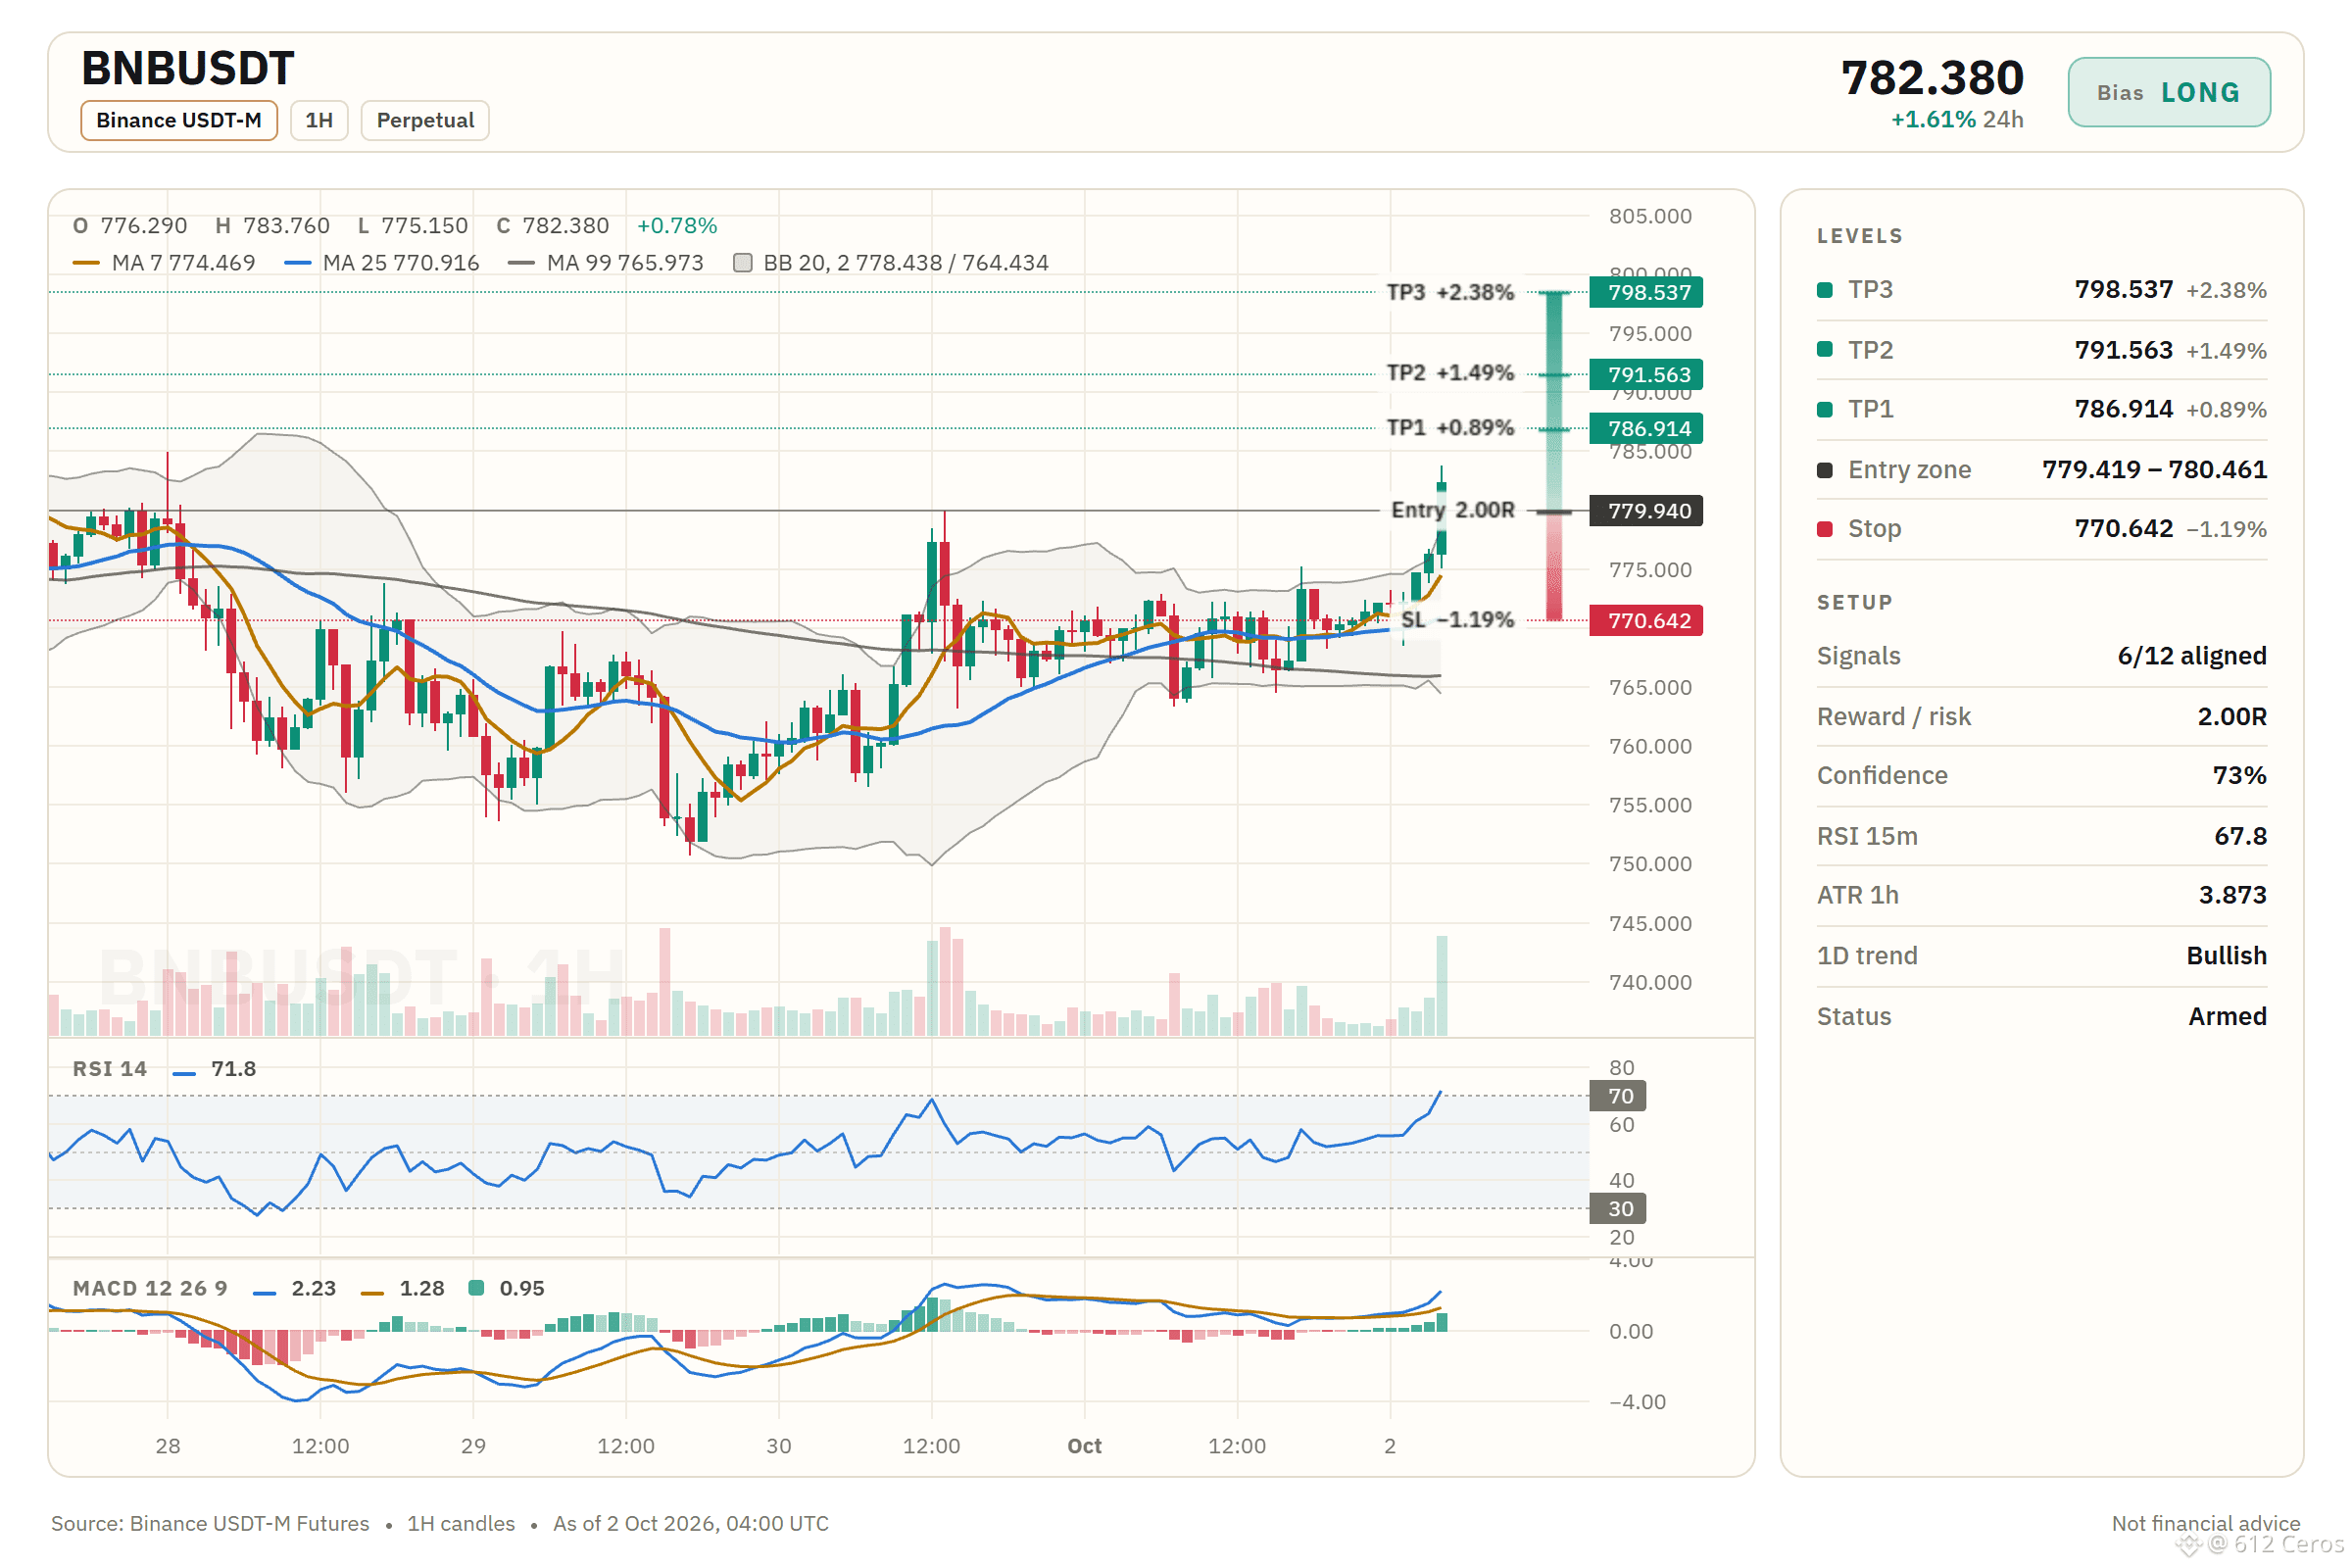
Entry: 779.419 – 780.461
TP1: 786.914 (+0.9%)
TP2: 791.563 (+1.5%)
TP3: 798.537 (+2.4%)
SL: 770.642 (-1.2%)
Plan: enter only inside the zone, take half at TP1, then move the stop to entry.
Why LONG? Strong call, 6/12 signals agree, 1 against, 5 undecided.
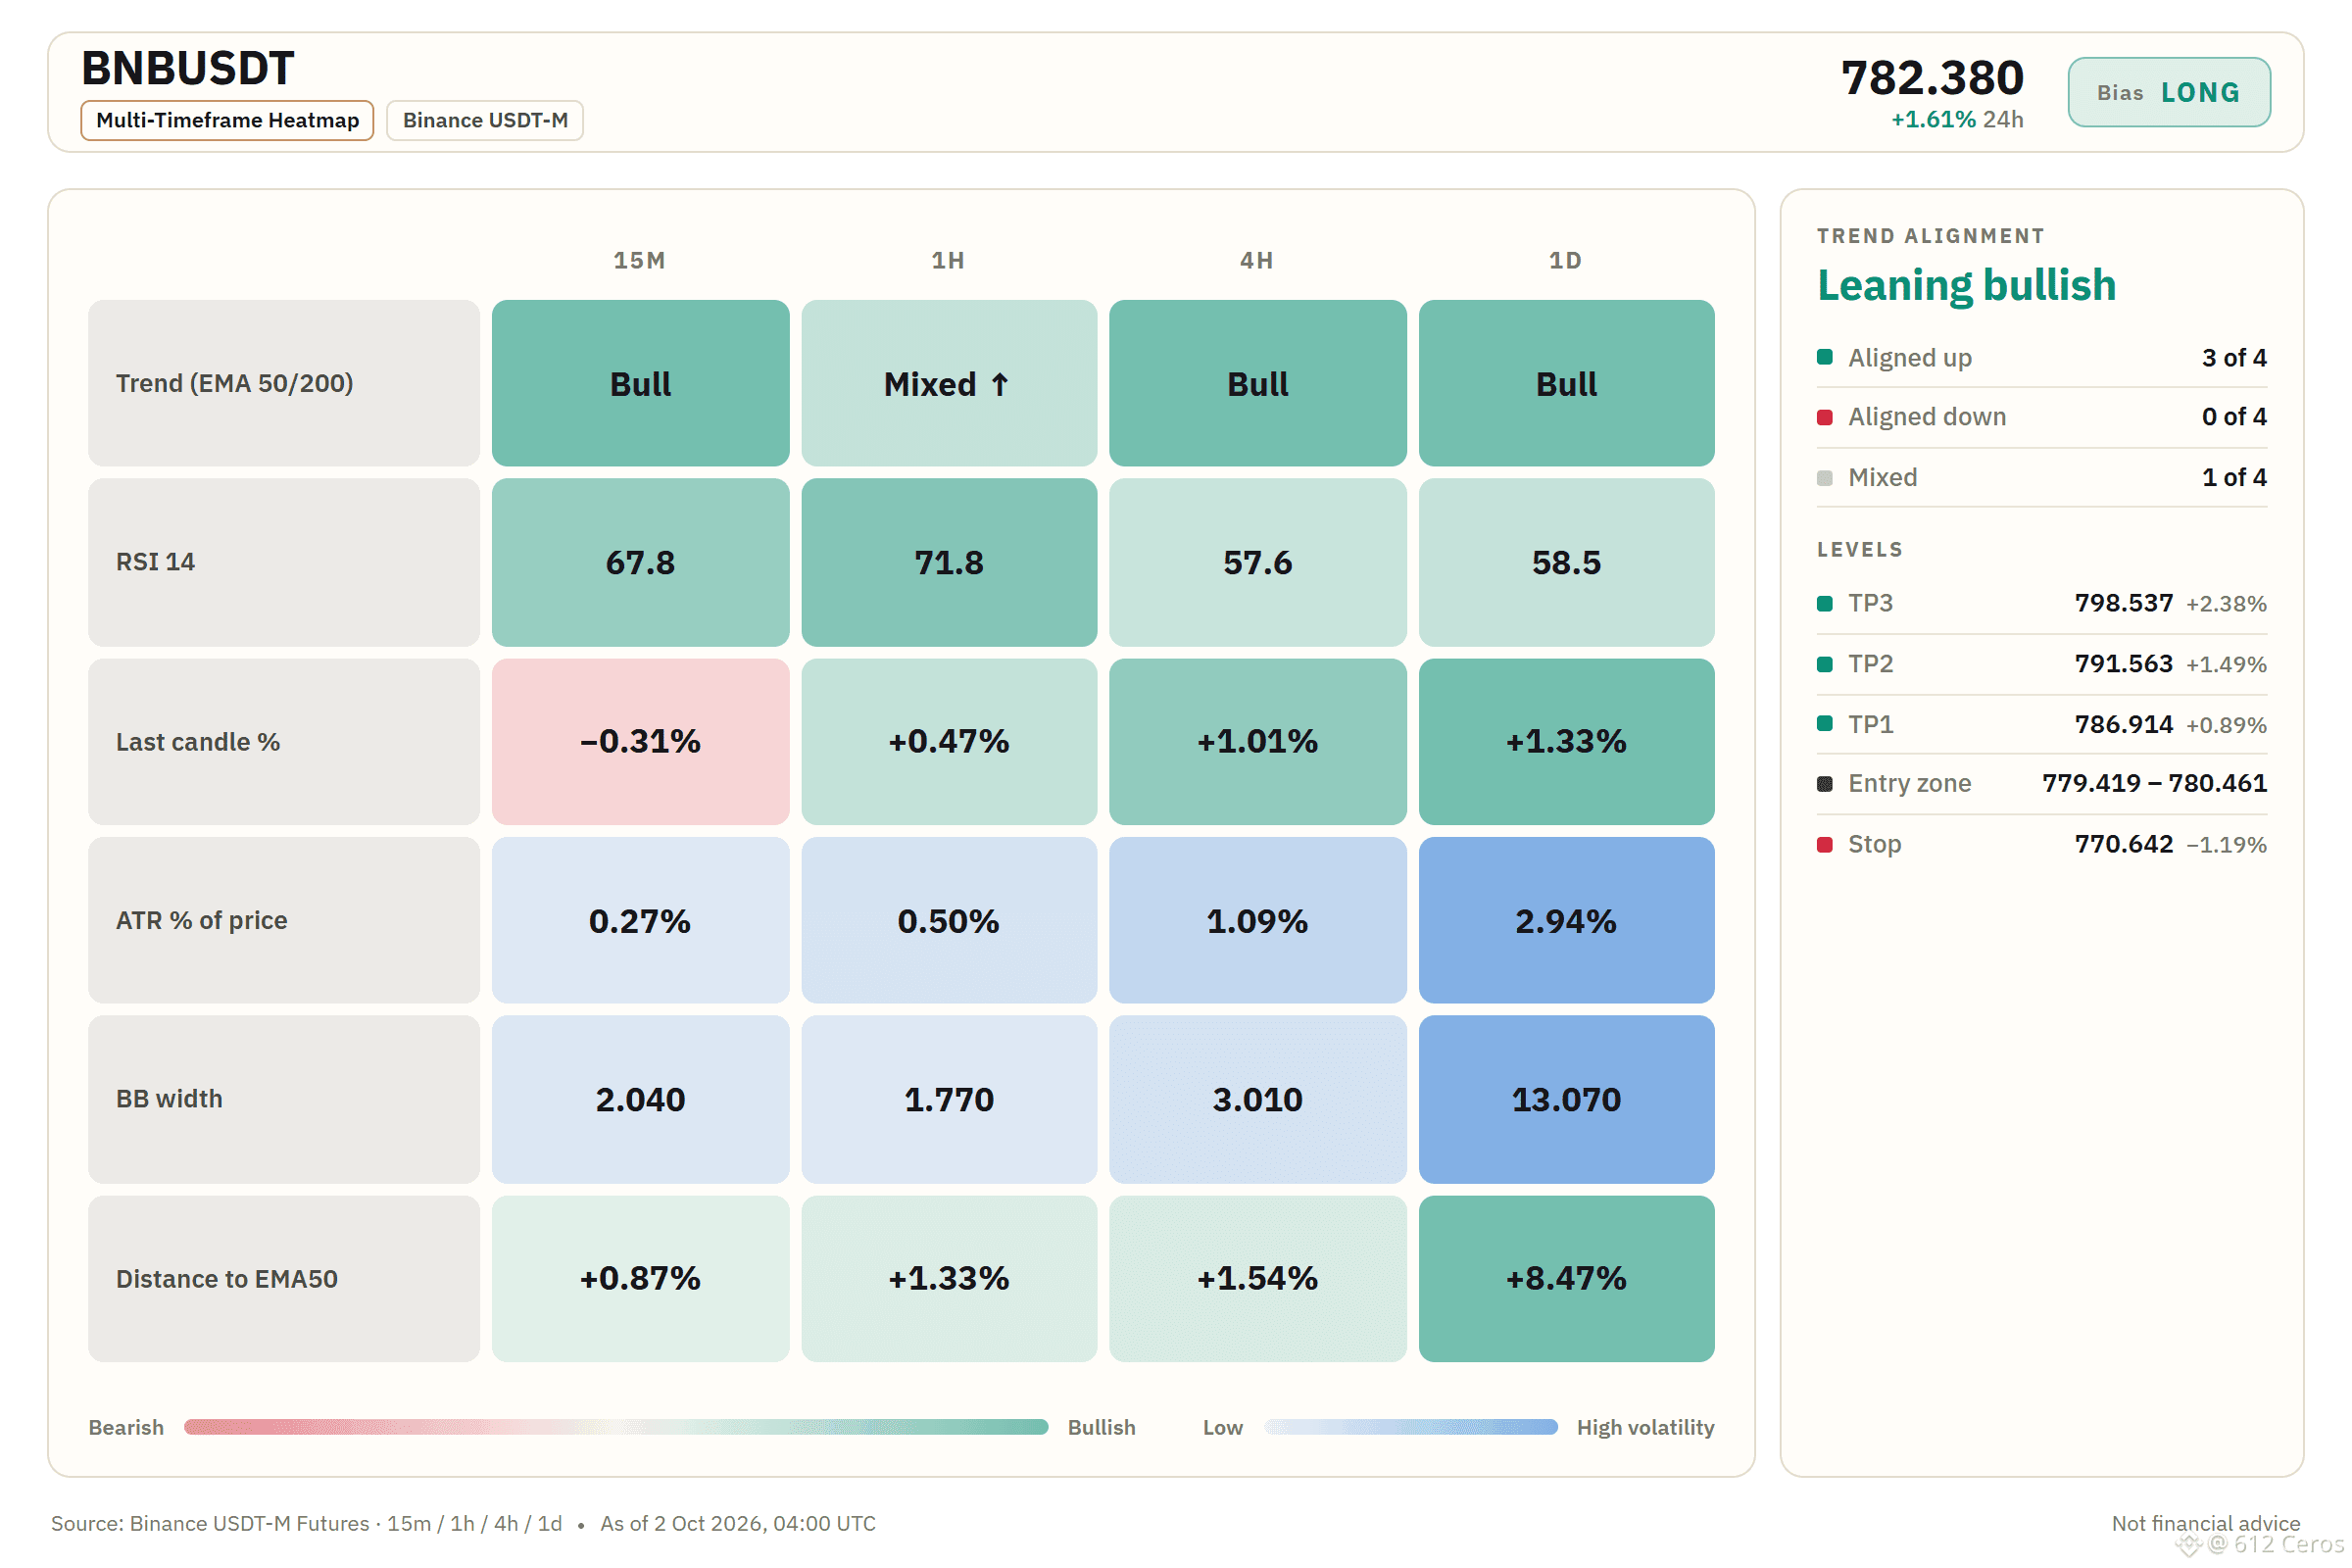
• Daily trend: price > EMA50 > EMA200, bullish stack → the big-picture trend is up
• 4h trend: price > EMA50 > EMA200, bullish stack → the swing trend is up
• Trend strength (ADX/DI, 15m): ADX 29.1 with buyers in control (DI+ 35.2 vs DI− 12.3) → buyers are driving the move
Risk: Relative strength vs BTC: underperforming, −1.47% vs BTC over the last day → weaker than BTC
The reasoning:
The daily trend is bullish and the 4h trend is bullish too, which means both the big picture and the swing direction point up. Buyers are in control on the 15m time frame with the ADX at 29.1 and the 1h price sits above the EMA50, so momentum has been building. The setup is long, but the price is still close enough to the recent 1h EMA50 that a pullback would not be unusual.
Where do you want to see the invalidation level before you would consider this a bad trade?
Chart with every level below.
📲 Want more of my latest signals? Join me here:
https://app.binance.com/uni-qr/D26WbL9t
⚠️ Personal market analysis only. NFA — manage risk and DYOR.
Educational content, not investment advice or a recommendation to buy, sell, deposit, or withdraw any asset. No paid promotion or referral/affiliate links.
🟢 LONG $BNB /USDT: expecting price to go UP
Bias: LONG · Strong
Entry: 779.419 – 780.461
TP1: 786.914 (+0.9%)
TP2: 791.563 (+1.5%)
TP3: 798.537 (+2.4%)
SL: 770.642 (-1.2%)
Plan: enter only inside the zone, take half at TP1, then move the stop to entry.
Why LONG? Strong call, 6/12 signals agree, 1 against, 5 undecided.
• Daily trend: price > EMA50 > EMA200, bullish stack → the big-picture trend is up
• 4h trend: price > EMA50 > EMA200, bullish stack → the swing trend is up
• Trend strength (ADX/DI, 15m): ADX 29.1 with buyers in control (DI+ 35.2 vs DI− 12.3) → buyers are driving the move
Risk: Relative strength vs BTC: underperforming, −1.47% vs BTC over the last day → weaker than BTC
The reasoning:
The daily trend is bullish and the 4h trend is bullish too, which means both the big picture and the swing direction point up. Buyers are in control on the 15m time frame with the ADX at 29.1 and the 1h price sits above the EMA50, so momentum has been building. The setup is long, but the price is still close enough to the recent 1h EMA50 that a pullback would not be unusual.
Where do you want to see the invalidation level before you would consider this a bad trade?
Chart with every level below.
📲 Want more of my latest signals? Join me here:
https://app.binance.com/uni-qr/D26WbL9t
⚠️ Personal market analysis only. NFA — manage risk and DYOR.
Educational content, not investment advice or a recommendation to buy, sell, deposit, or withdraw any asset. No paid promotion or referral/affiliate links.