

Hello, fellow traders! Welcome to the fourth station of our series. After learning in the previous lesson the Volume Profile map and the locations of the whales, today we’ll learn how to uncover "direct accumulation and distribution" even before the price moves—using the legendary cumulative tool: the On-Balance Volume (OBV) indicator.
---
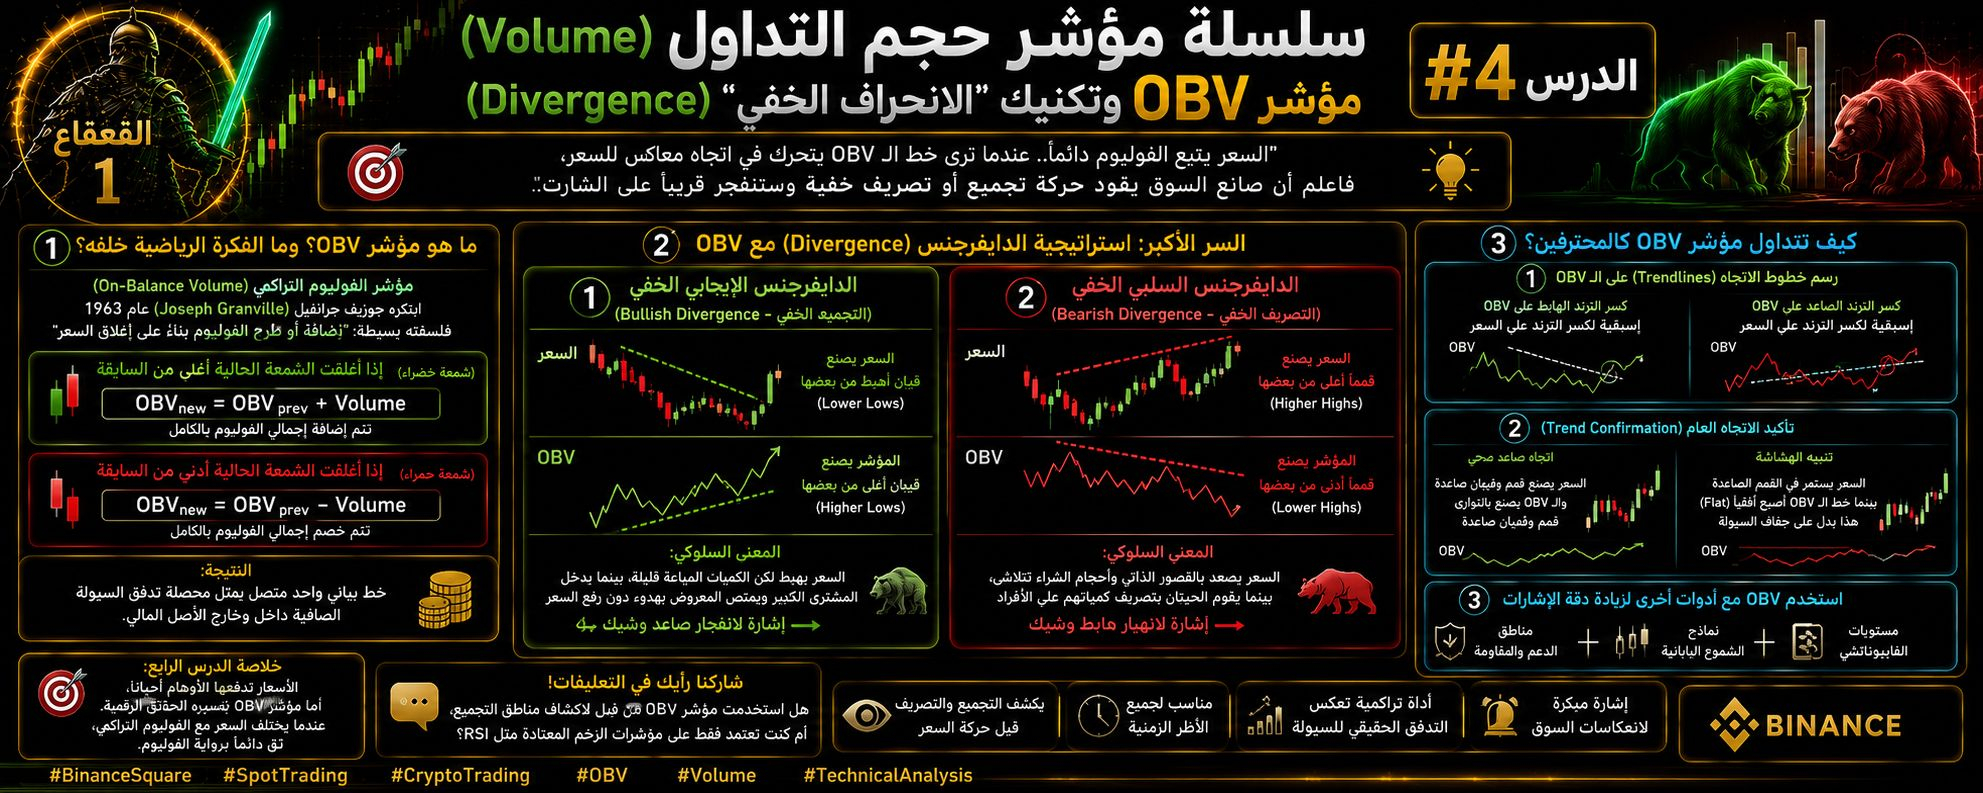
🎯 Rule #4: "Price always follows volume... When you see the OBV line moving in the opposite direction of the price, know that the market maker is leading a hidden accumulation or distribution move, and it will explode soon on the chart."
---
💡 1️⃣ What is the OBV indicator? And what is the mathematical idea behind it?
This technical analysis indicator was invented by Joseph Granville in 1963, and its philosophy is based on a very simple principle: "Add the candle’s volume or subtract it based on the candle close:"
• If the current candle closes above the previous one (green candle):
The total volume is fully added to the cumulative indicator value:
$$OBV_{\text{new}} = OBV_{\text{previous}} + \text{Volume}$$
• If the current candle closes below the previous one (red candle):
The total volume is fully deducted from the indicator value:
$$OBV_{\text{new}} = OBV_{\text{previous}} - \text{Volume}$$
• Result: A single connected graph line represents the net "liquidity flow outcome" inside and outside the financial asset.
---
🧬 2️⃣ The biggest secret: the Divergence strategy with OBV
Divergence with the OBV indicator is considered one of the strongest reversal signals in technical analysis, and it comes in two forms:
• 1. Hidden Bullish Divergence (Hidden Divergence - Hidden Accumulation):
- On the chart: Price forms lower lows ($Lower\ Lows$).
- On the OBV indicator: The indicator forms higher lows ($Higher\ Lows$).
- Behavioral meaning: Price is falling, but the sold volumes are low, while a large buyer enters and absorbs the supply quietly without pushing the price up ⬅️ a sign of an imminent bullish breakout.
• 2. Hidden Bearish Divergence (Hidden Divergence - Hidden Distribution):
- On the chart: Price forms higher highs ($Higher\ Highs$).
- On the OBV indicator: The indicator forms lower highs ($Lower\ Highs$).
- Behavioral meaning: Price is rising with sluggish momentum and buying volumes are fading, while the whales distribute their quantities to the public ⬅️ a sign of an imminent bearish breakdown.
---
🔍 3️⃣ How to trade the OBV indicator like a pro?
Don’t look at the numeric values of the OBV—focus on the connection of movement and direction:
• Draw trend lines on the OBV:
You can draw a trendline on the highs or lows of the indicator itself. When OBV breaks a downward trendline, that is a clear advantage/break signal that the trend break on price will also happen.
• General trend confirmation (Trend Confirmation):
- Healthy uptrend: Price forms higher highs and higher lows, and the OBV forms rising highs and rising lows in parallel.
- Fragility warning: If price continues to make higher highs while the OBV line becomes flat (horizontal), this indicates a drought of liquidity.
---
⚖️ Summary of Lesson Four:
"Prices are sometimes driven by illusions, but the OBV indicator is driven by digital facts. When price differs from cumulative volume, always trust the volume story."
---
💬 Share with us in the comments:
Have you used the OBV indicator before to detect accumulation zones, or were you relying only on common momentum indicators like RSI?
#BinanceSquare #cryptotrading #Volume #القعقاع_1


