After the ETH breakout, it dipped back down again. For the next 4 hours, we’ll keep watching for consolidation. In the previous post, the 2724 level that I was waiting for did indeed close above it, but the very next bearish candle ate the breakout. Moreover, its trading volume was about 76% higher than the breakout candle. Then the subsequent push upward also failed to hold, which suggests that selling pressure is still present above.
Although the latest bullish candle has recovered the prior candle’s decline, its volume is about 30% lower than that previous candle, so we can’t simply call for a continuation of the breakout right away. Next, watch whether support can continue to hold around 2667–2673. On any rebound, first face 2724. The 2743–2749 zone above is also an area where prices have surged twice and then pulled back.
This time, we’re only observing the range for support/continuation. The original defense level at 2626 remains unchanged. If the 4-hour chart breaks down, we’ll remove the consolidation (range-bound) view.
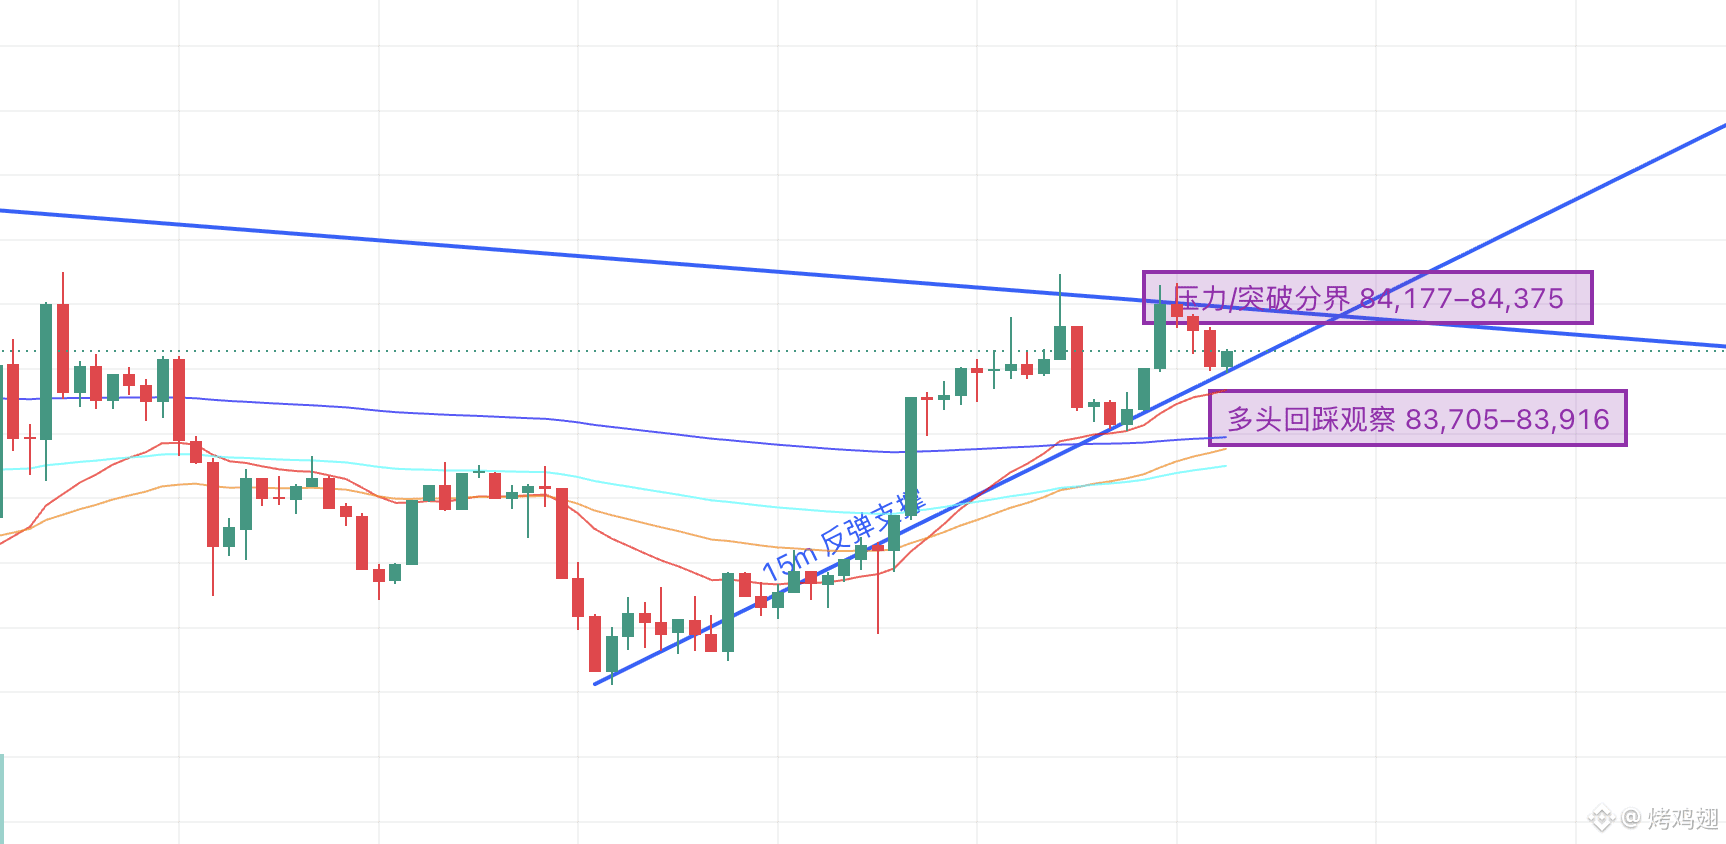
As for BTC/“big cake” (Btc), it remains somewhat bearish. This round of rise-and-fall is more significant than a single rebound bullish candle. The move surged with volume to 85.6k, but it finally closed back at 84.1k. The “short/empty trigger” for the close at 85,242 was not triggered. The latest rebound volume is also smaller than the preceding bearish candle, and during the session price has retreated below the old sideways range. Continue to monitor the sell pressure after a rebound reaches 83.8k–84.3k. Don’t chase shorts near 82.8k, the old support below. If the 4-hour candle closes back at 85,242, we’ll remove the bearish view; we can’t move that line upward just because there’s been one more long upper wick.
$BTC $ETH
Although the latest bullish candle has recovered the prior candle’s decline, its volume is about 30% lower than that previous candle, so we can’t simply call for a continuation of the breakout right away. Next, watch whether support can continue to hold around 2667–2673. On any rebound, first face 2724. The 2743–2749 zone above is also an area where prices have surged twice and then pulled back.
This time, we’re only observing the range for support/continuation. The original defense level at 2626 remains unchanged. If the 4-hour chart breaks down, we’ll remove the consolidation (range-bound) view.
As for BTC/“big cake” (Btc), it remains somewhat bearish. This round of rise-and-fall is more significant than a single rebound bullish candle. The move surged with volume to 85.6k, but it finally closed back at 84.1k. The “short/empty trigger” for the close at 85,242 was not triggered. The latest rebound volume is also smaller than the preceding bearish candle, and during the session price has retreated below the old sideways range. Continue to monitor the sell pressure after a rebound reaches 83.8k–84.3k. Don’t chase shorts near 82.8k, the old support below. If the 4-hour candle closes back at 85,242, we’ll remove the bearish view; we can’t move that line upward just because there’s been one more long upper wick.
$BTC $ETH