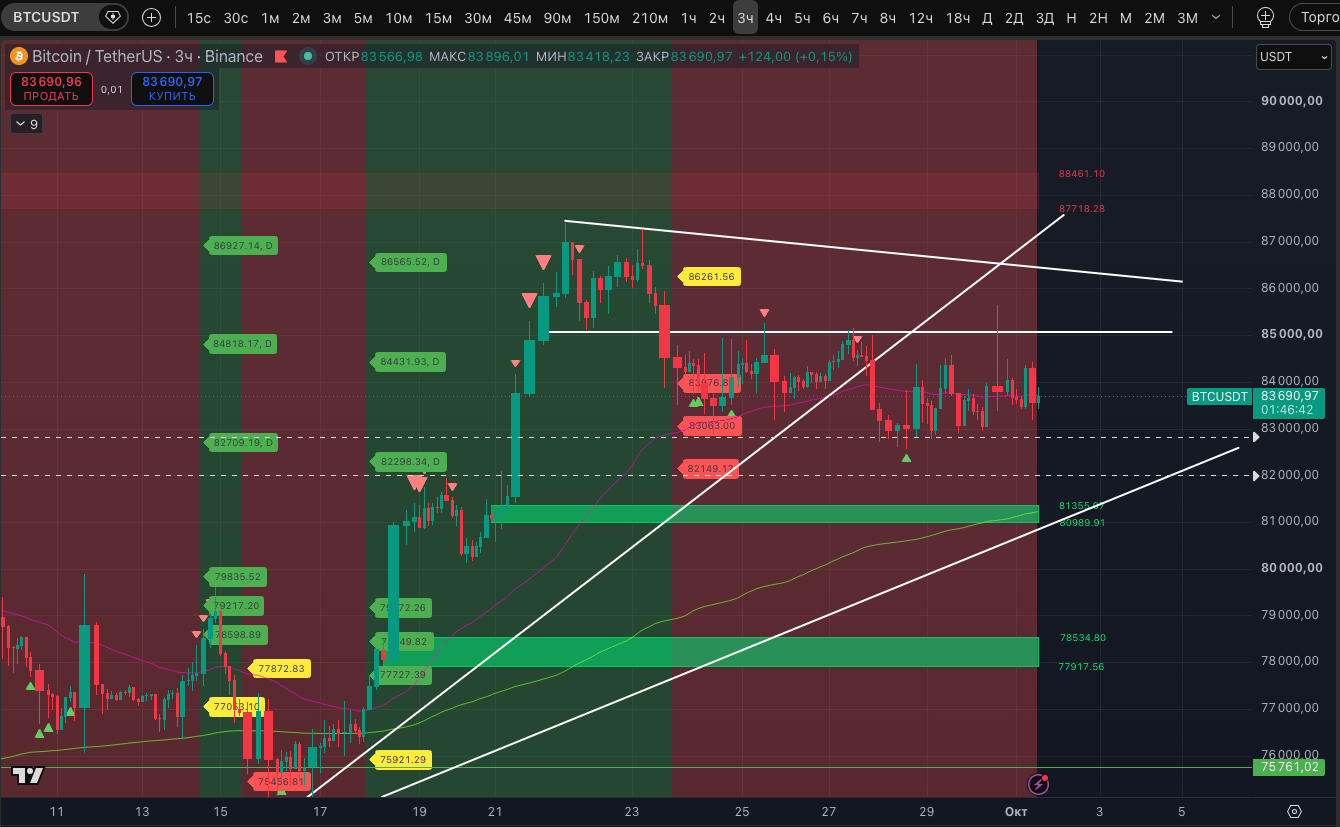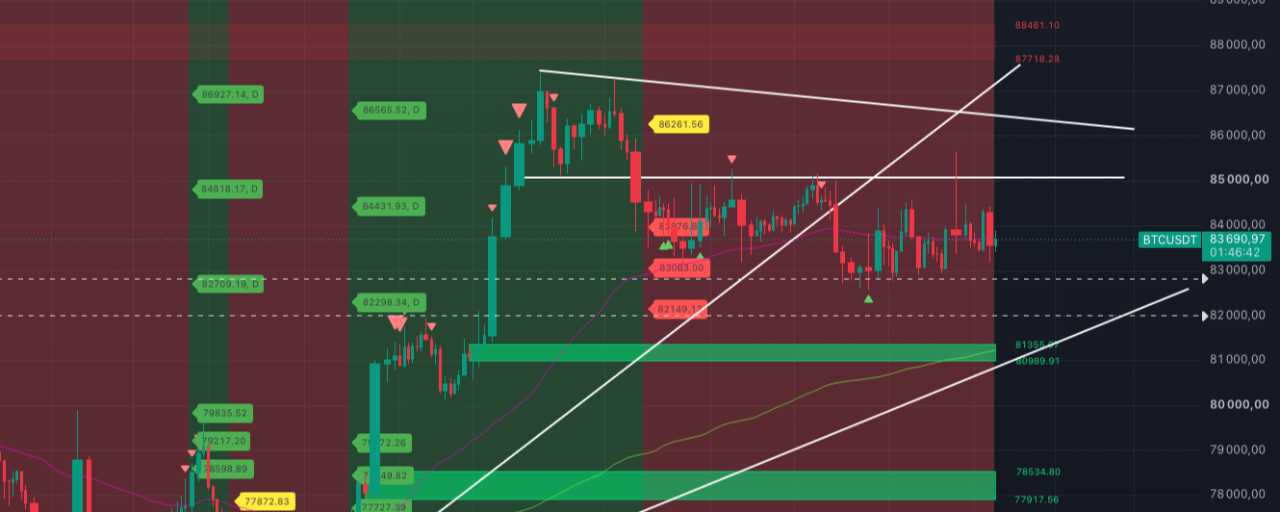


BTC consolidates below $84,000, and all attempts to recover today are being rebuffed by sellers. Moreover, aggressively so, which is clearly visible on the 5-minute timeframe.
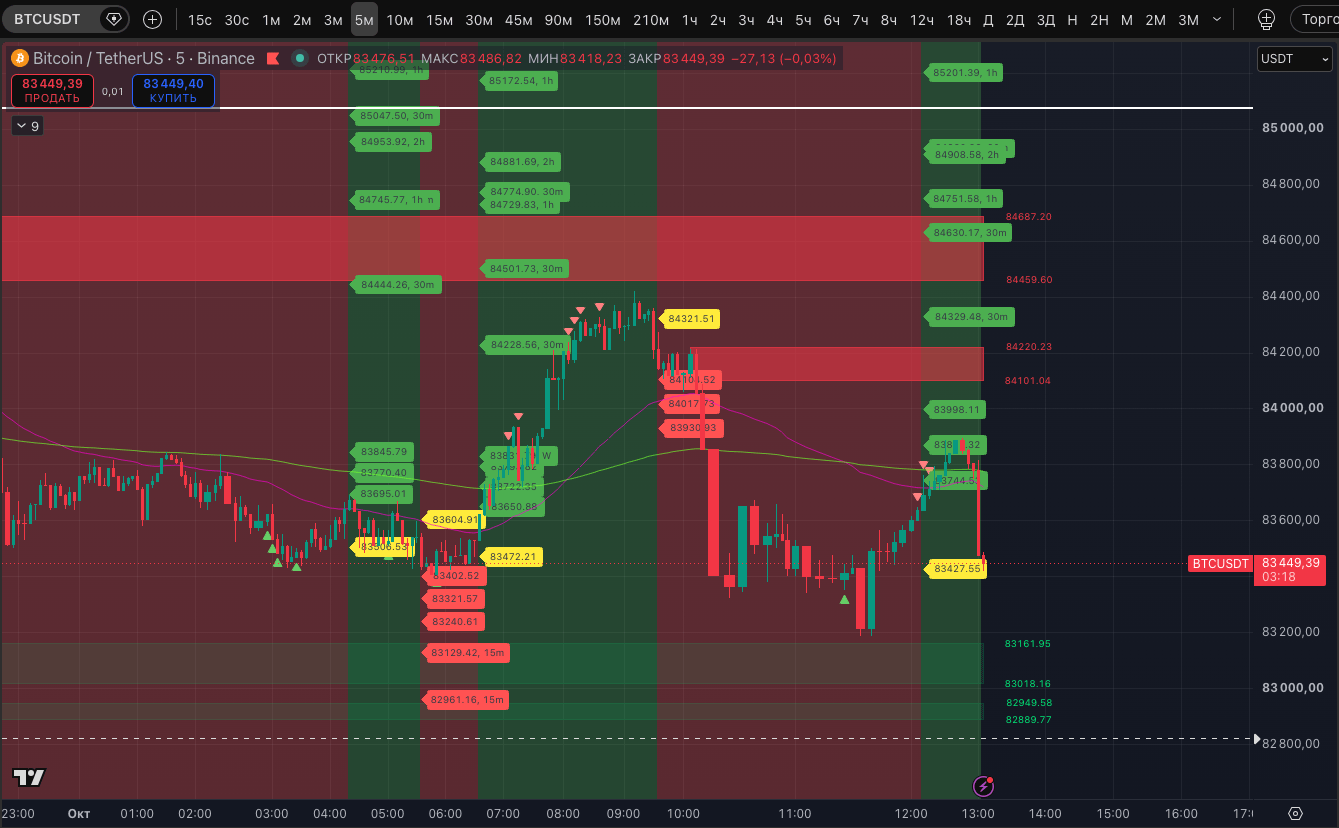
Nevertheless, the price is still holding a sustained uptrend on the 1-hour and 2-hour timeframes obtained yesterday. As long as it isn’t absorbed by selling, the move to new lows remains in question. Since September 28, the chart is still within the structure of rising highs and lows.
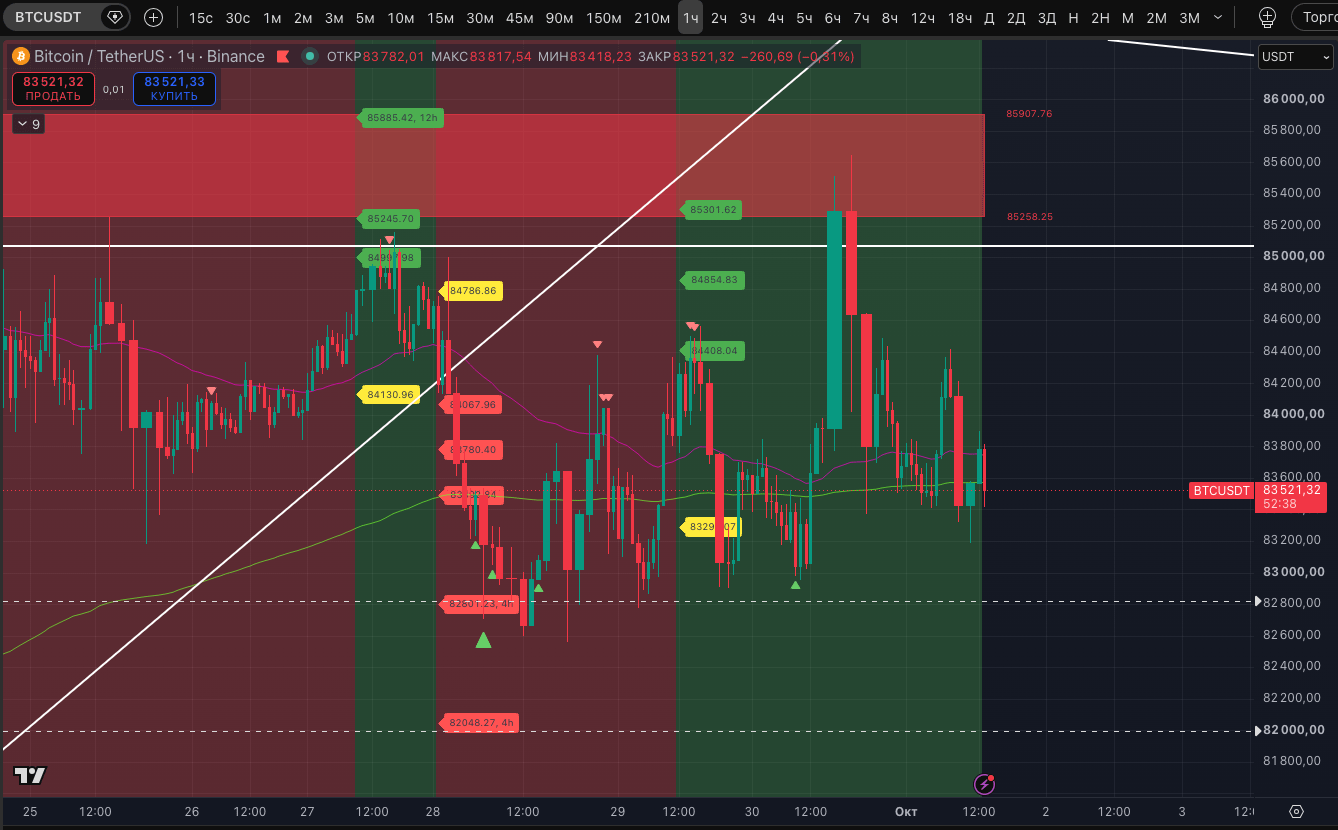
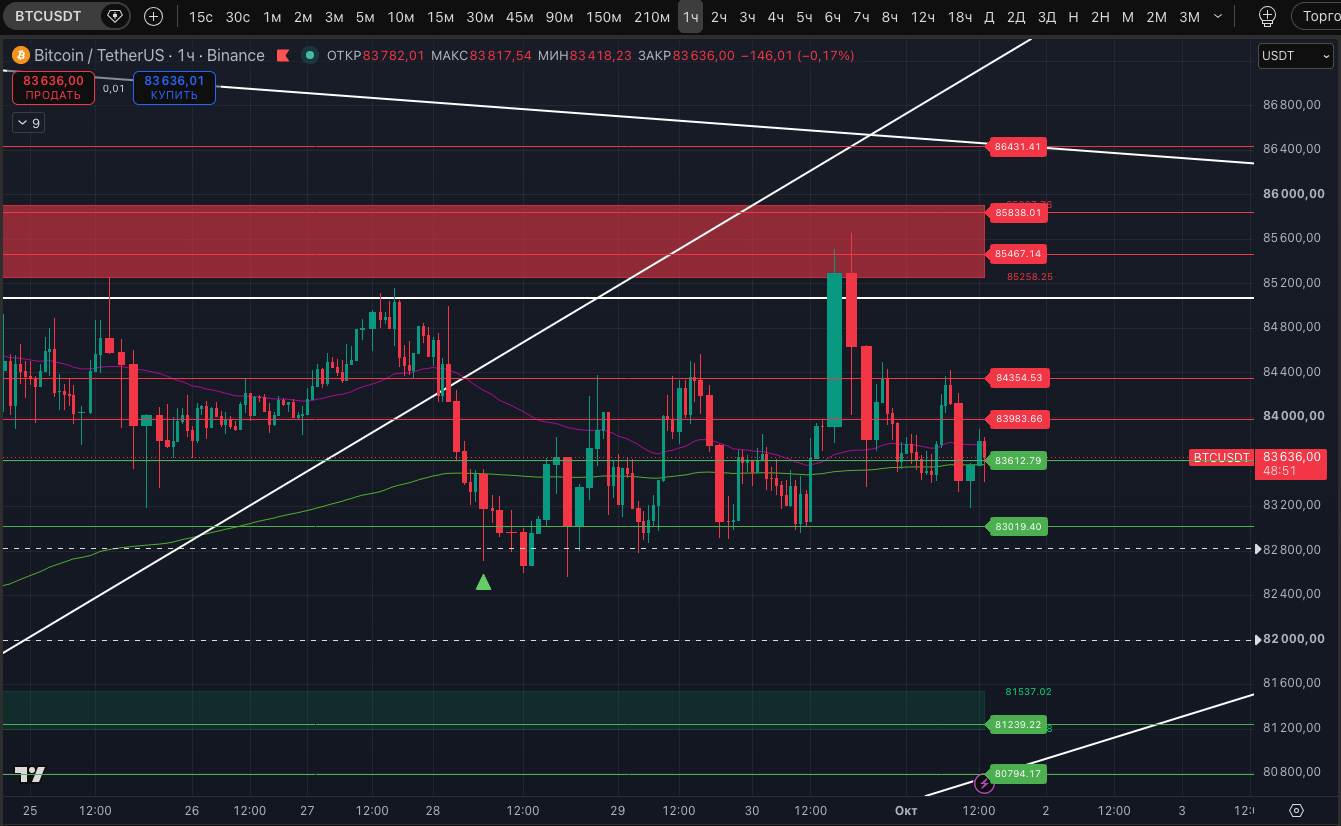
We’ll also note the situation around the horizontal levels. Right now, there are two important supports on the 1-hour timeframe: $83,612 and $83,019. A break of the second one would open the way to a new attempt at an impulse move down to the $81,239 level and into the $81,200–$81,537 liquidation zone, which has been discussed many times over the past few days. The nearest upper liquidation zone on the 1-hour timeframe, $85,258–$85,907, was tested yesterday during the pump in the release of the Personal Consumption Expenditures price index. And it triggered an aggressive sell-off.
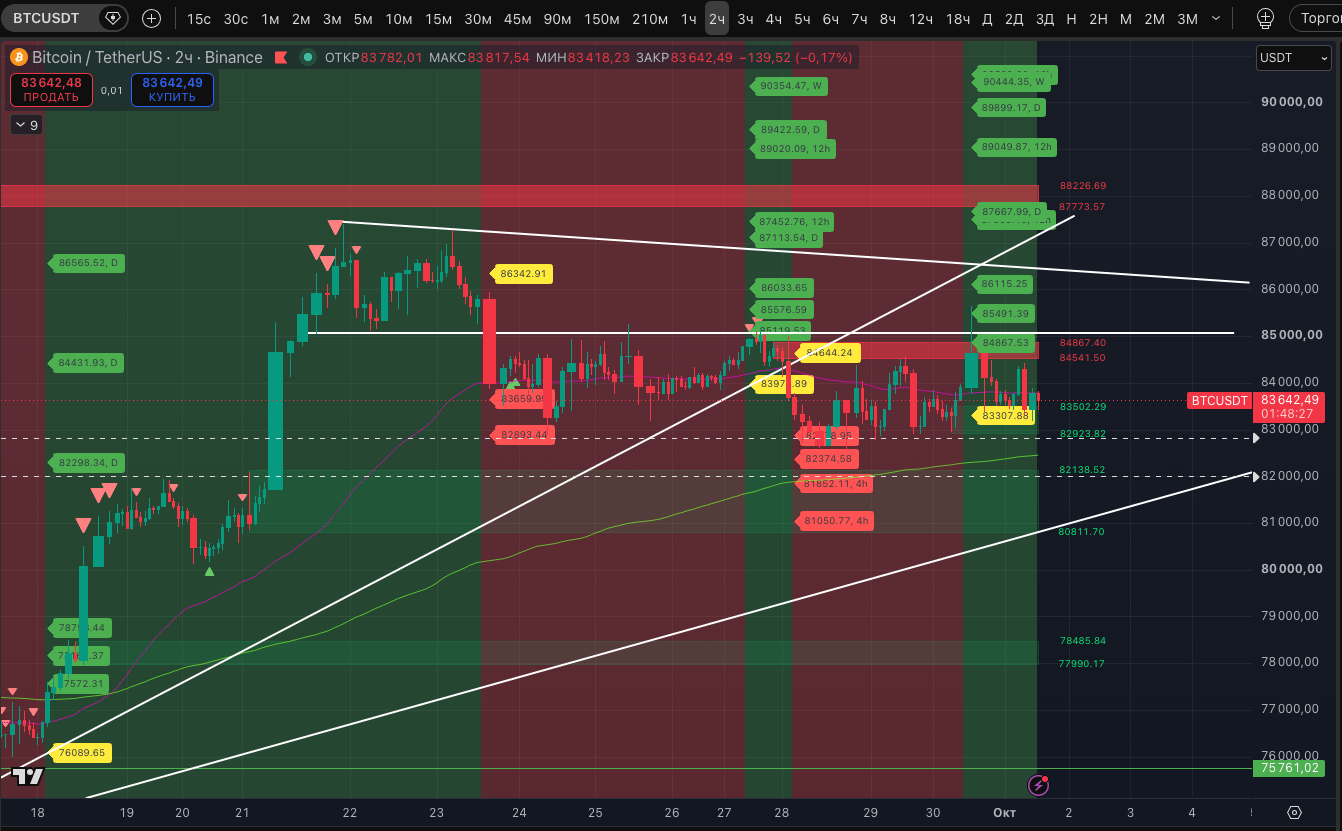
On the 2-hour timeframe, resistance is overhead, from which yesterday sales began and there was aggressive absorption—$84,541–$84,867. At the same time, the price since yesterday has been pressing toward the lower zone, $82,923–$83,502. As long as they hold—and as long as the potential uptrend-break level on this timeframe at $83,307—further decline is contained.
The situation, based on our assessment, is ambiguous. That means we’ll wait for signals from stable trends.
For the bullish scenario, we need a transition to a stable uptrend on the 2.5- and 3-hour timeframes.
For the bearish scenario—switching to a stable downtrend on the 1-hour and 2-hour timeframes.
We’ll keep our short, because the 3-hour timeframe downtrend remains in effect.