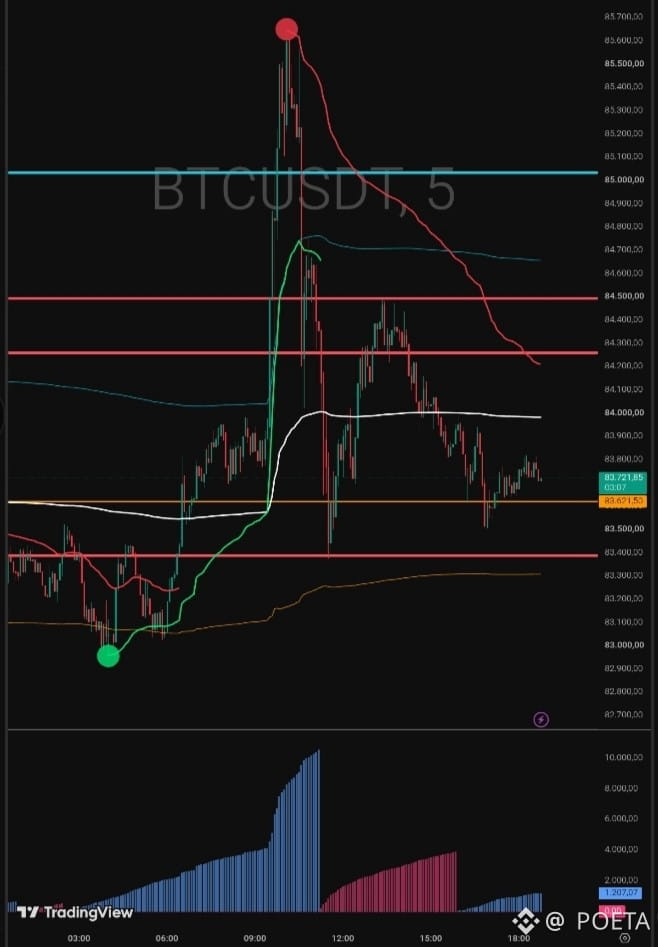
The BTC/USDT price movement on the 5-minute chart began with a strong bullish impulse from the support region near $82,900, highlighted by the green marker. This upward move gained significant momentum, breaking through successive intermediate resistances until reaching the high at the red point, around $85,600, accompanied by a high volume spike on the lower indicator. However, upon reaching this level, the asset suffered a strong buy rejection that triggered a sharp and rapid correction. The price lost the support of the upper moving averages and began trading in a descending structure, stabilizing temporarily in the range of $83,720.
Given the current scenario, expectations for the next moves point to two main paths. In the bearish scenario, since the price is trading below the short-term moving averages and has been forming progressively lower highs, the trend suggests continued selling pressure, which may lead the asset to test the support zone again at $83,400 or even seek the previous low at $82,900. On the other hand, for a bullish reversal to occur, the market will need to show enough buying strength to reclaim and surpass the central moving average, located near $84,000, consolidating above the $84,250 to $84,500 barrier in order to attempt to reach the day’s highs again.
Given the current scenario, expectations for the next moves point to two main paths. In the bearish scenario, since the price is trading below the short-term moving averages and has been forming progressively lower highs, the trend suggests continued selling pressure, which may lead the asset to test the support zone again at $83,400 or even seek the previous low at $82,900. On the other hand, for a bullish reversal to occur, the market will need to show enough buying strength to reclaim and surpass the central moving average, located near $84,000, consolidating above the $84,250 to $84,500 barrier in order to attempt to reach the day’s highs again.