【 $BTC four-year cycle series 85】
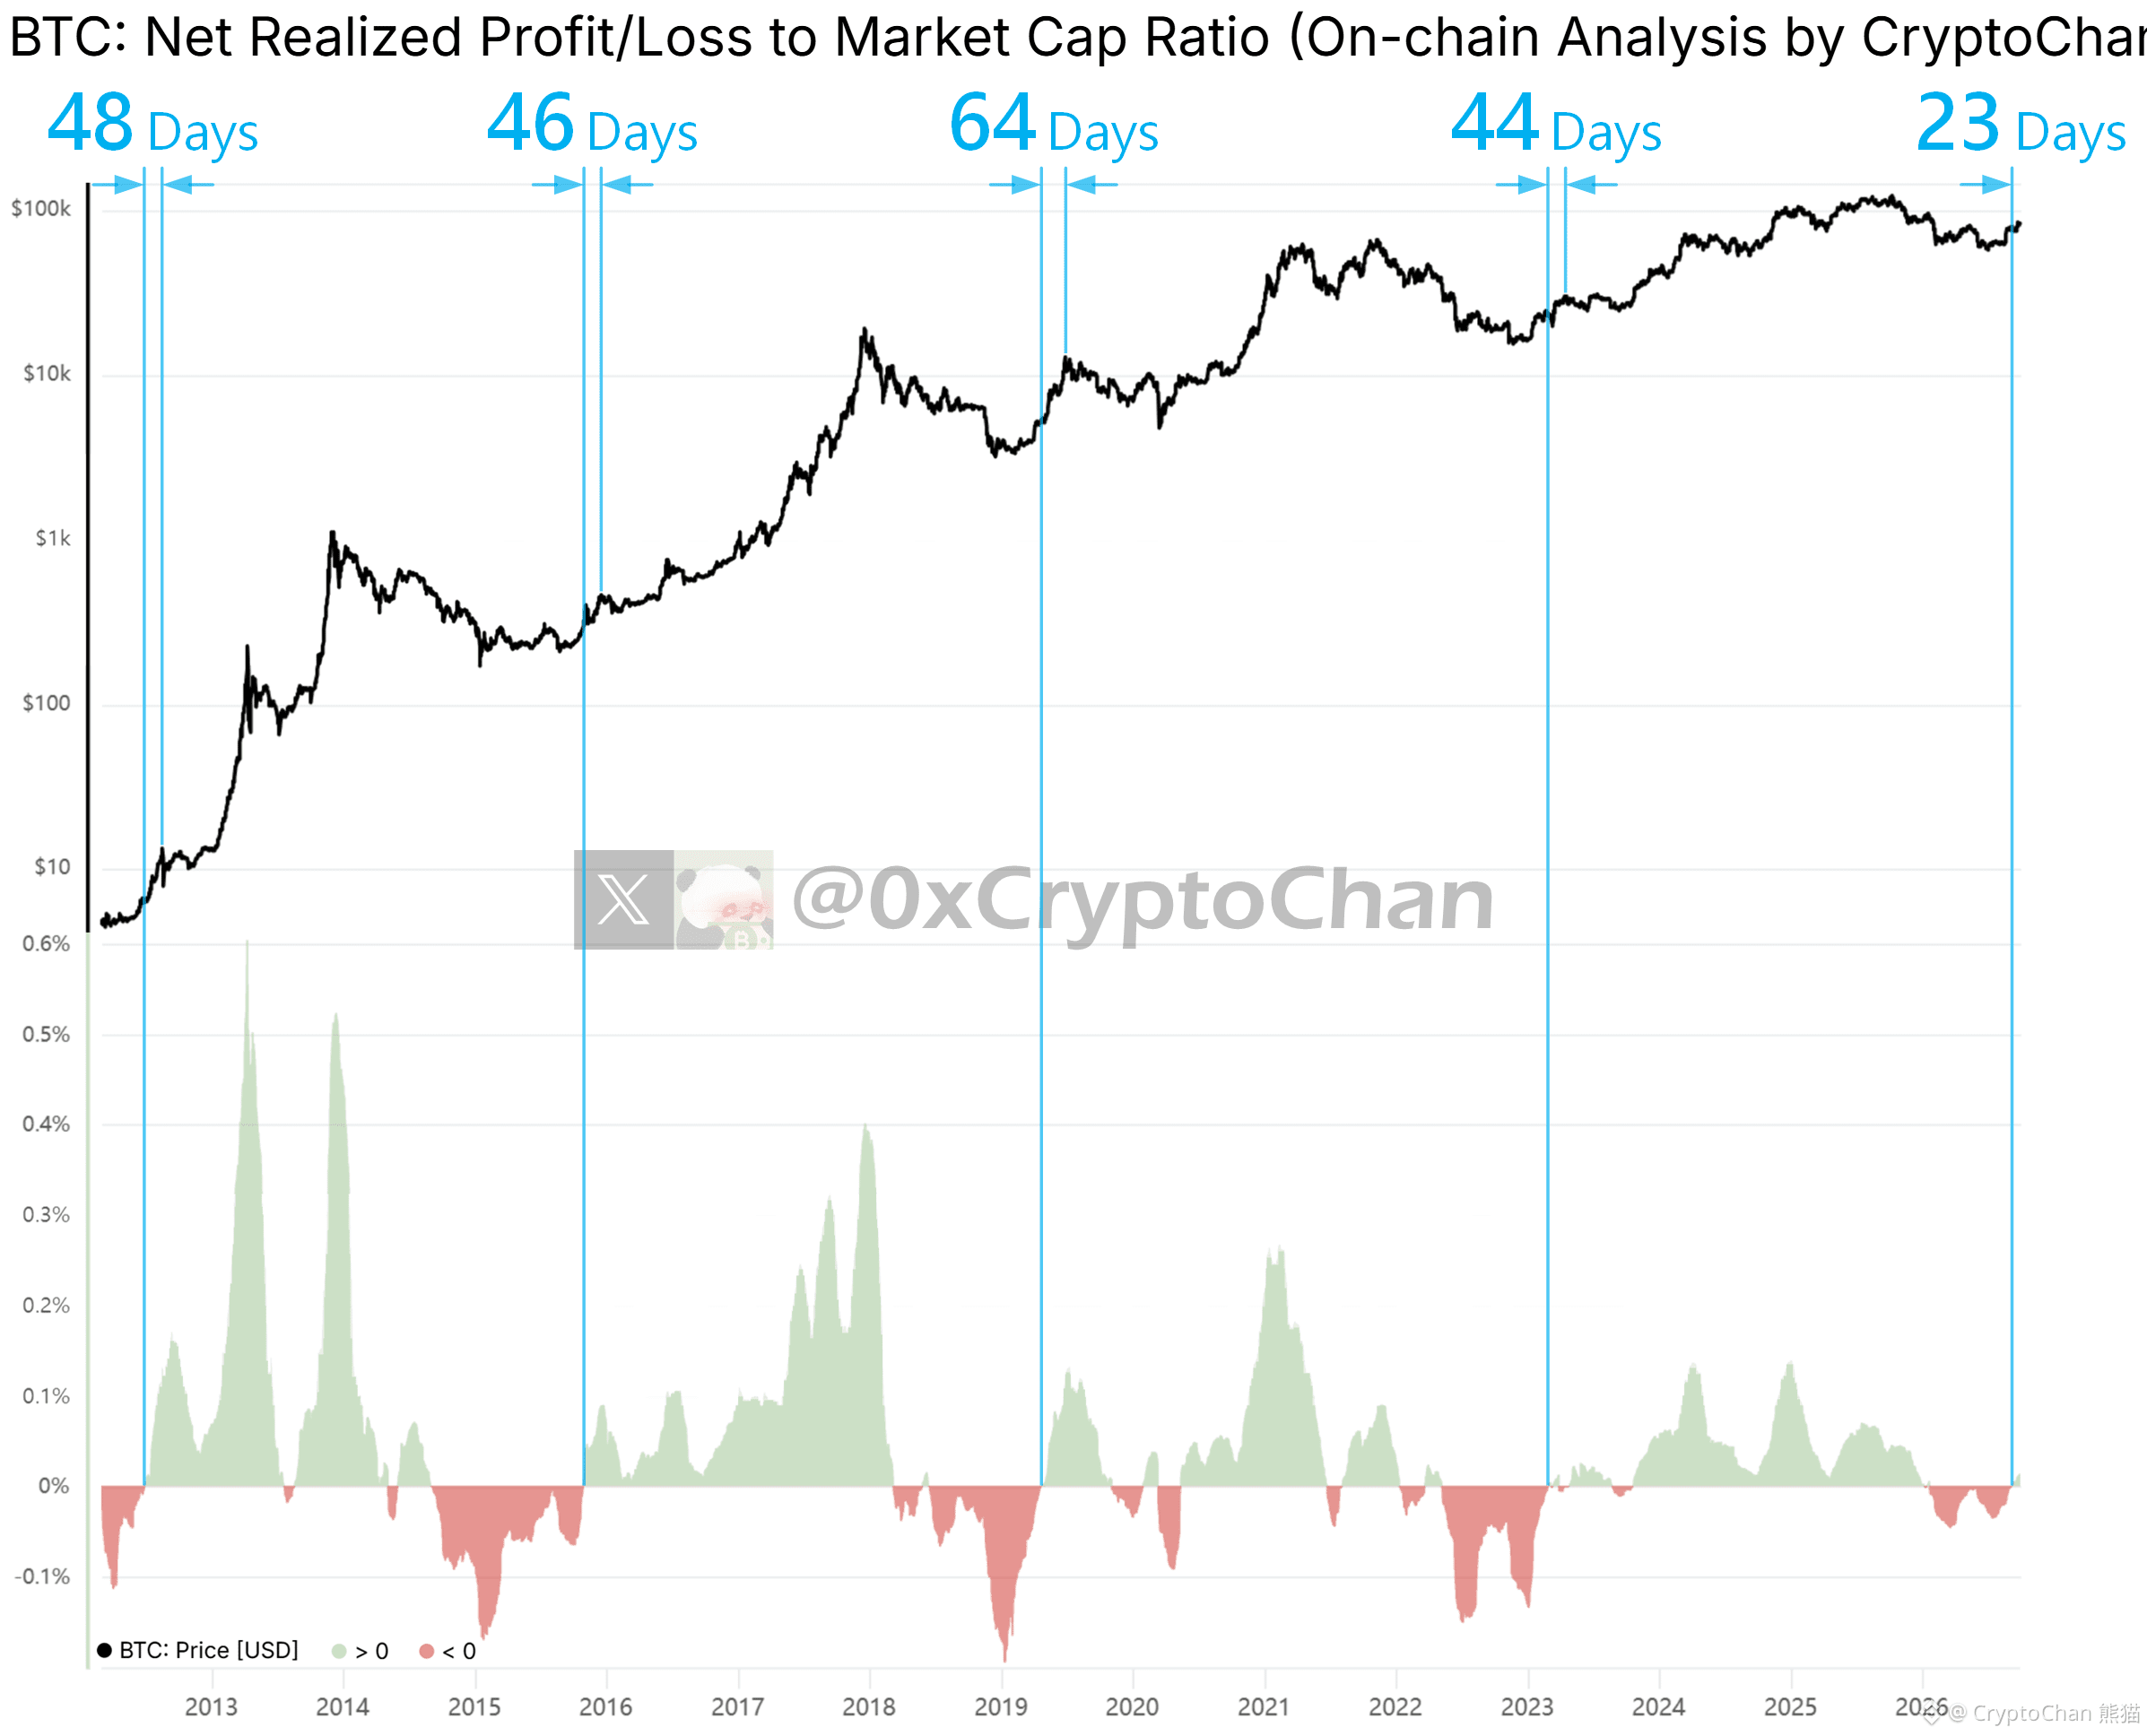
2012 red to green: 48 days later, reaches the bull market recovery top
2015 red to green: 46 days later, reaches the bull market recovery top
2019 red to green: 64 days later, reaches the bull market recovery top
2023 red to green: 44 days later, reaches the bull market recovery secondary top
2026 red to green: 23 days have already passed
┌── 🐼 On-chain data details ──┐
The indicator at the bottom of the chart is the percentage of total market cap represented by Bitcoin’s 60-day net realized profit/loss (USD).<0 red, >0 green
2012 red to green: 48 days later, reaches the bull market recovery top
2015 red to green: 46 days later, reaches the bull market recovery top
2019 red to green: 64 days later, reaches the bull market recovery top
2023 red to green: 44 days later, reaches the bull market recovery secondary top
2026 red to green: 23 days have already passed
┌── 🐼 On-chain data details ──┐
The indicator at the bottom of the chart is the percentage of total market cap represented by Bitcoin’s 60-day net realized profit/loss (USD).<0 red, >0 green