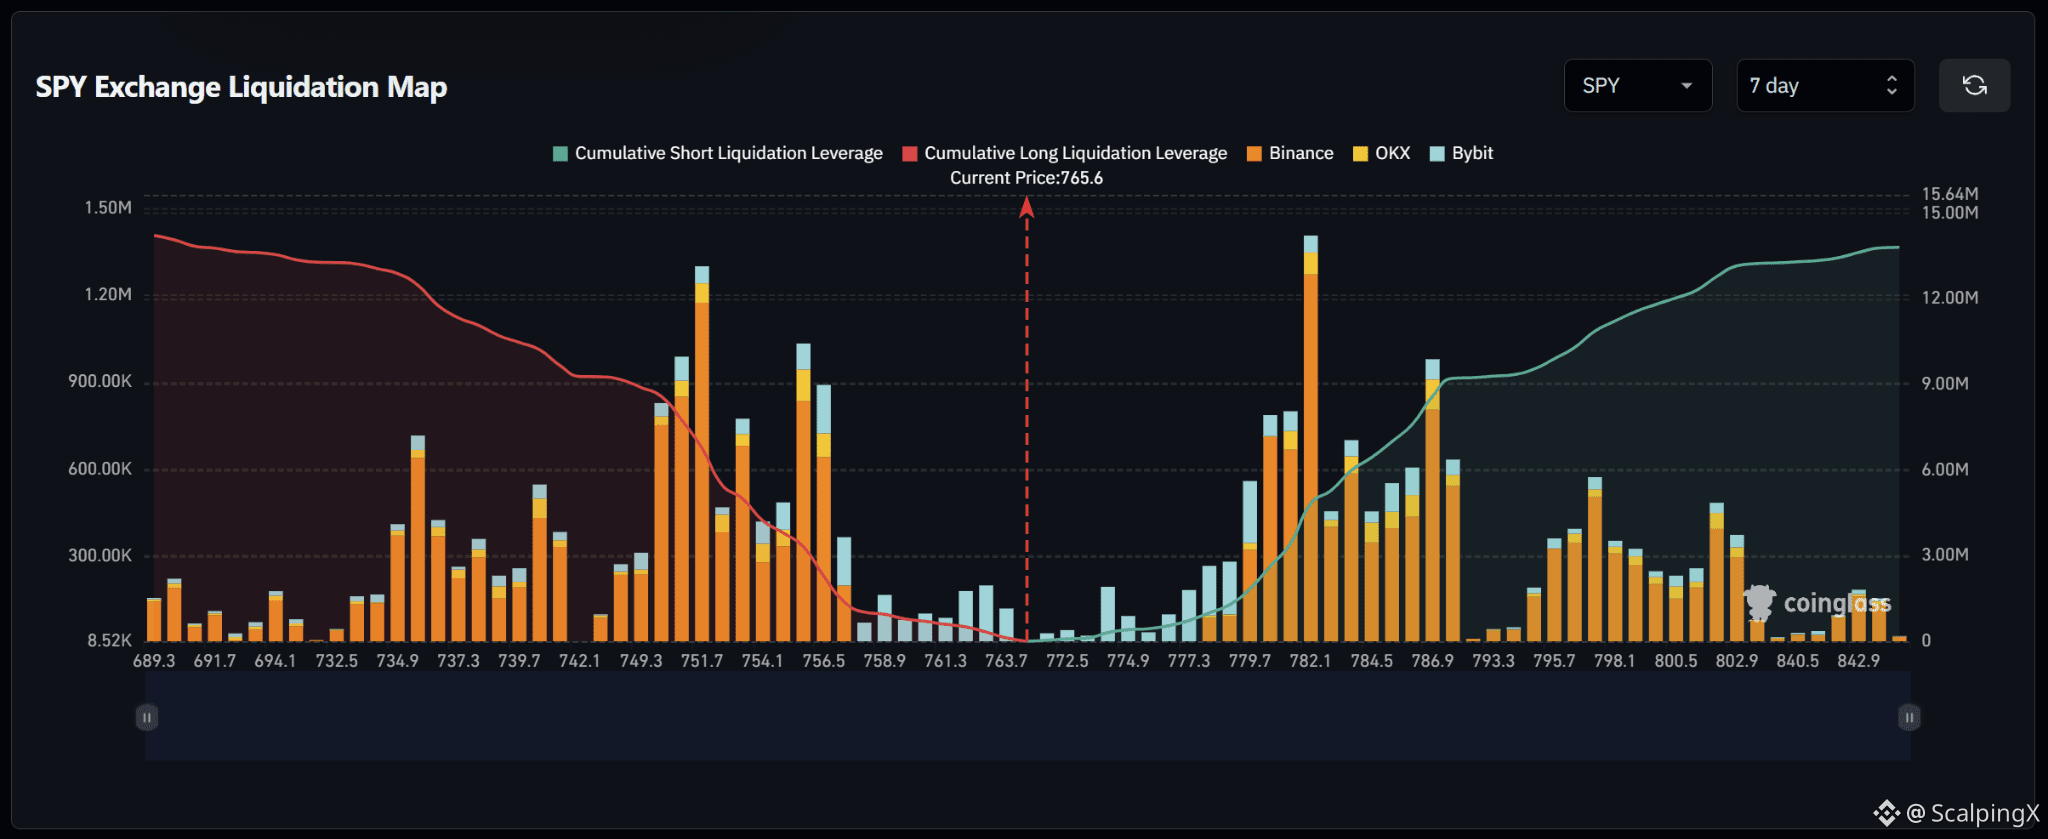
$SPYB – Liquidation Map (7 Days) – Current Price 765.6
🔎 The 7-day liquidation map is relatively balanced, with roughly 14 million USD in long liquidations below the current price and around 13–14 million USD in short liquidations above. Long-liquidation exposure is slightly larger, giving the structure a mild downside tilt rather than a strong imbalance.
📉 Below the market, long-liquidation liquidity is concentrated heavily across 749–757. The strongest cluster sits around 751–752 with a bar near 1.3 million USD, while 755–757 also contains several bars around 0.9–1.0 million USD. Losing 763–761 would shift attention toward 758–755 and then 752–749.
📈 Above the market, short-liquidation liquidity is concentrated across 779–787. The strongest cluster sits around 781–783 with a bar near 1.4 million USD, while 785–787 also carries several bars around 0.6–1.0 million USD. Further out, 795–803 forms another notable liquidity band.
🧭 The broader setup is close to balanced but carries a mild downside tilt. Losing 763–761 would increase the probability of a sweep toward 758–755, followed by 752–749. Breaking above 779–783 would instead expose 786–787 and then 795–803.
#LiquidationMap
🔎 The 7-day liquidation map is relatively balanced, with roughly 14 million USD in long liquidations below the current price and around 13–14 million USD in short liquidations above. Long-liquidation exposure is slightly larger, giving the structure a mild downside tilt rather than a strong imbalance.
📉 Below the market, long-liquidation liquidity is concentrated heavily across 749–757. The strongest cluster sits around 751–752 with a bar near 1.3 million USD, while 755–757 also contains several bars around 0.9–1.0 million USD. Losing 763–761 would shift attention toward 758–755 and then 752–749.
📈 Above the market, short-liquidation liquidity is concentrated across 779–787. The strongest cluster sits around 781–783 with a bar near 1.4 million USD, while 785–787 also carries several bars around 0.6–1.0 million USD. Further out, 795–803 forms another notable liquidity band.
🧭 The broader setup is close to balanced but carries a mild downside tilt. Losing 763–761 would increase the probability of a sweep toward 758–755, followed by 752–749. Breaking above 779–783 would instead expose 786–787 and then 795–803.
#LiquidationMap