

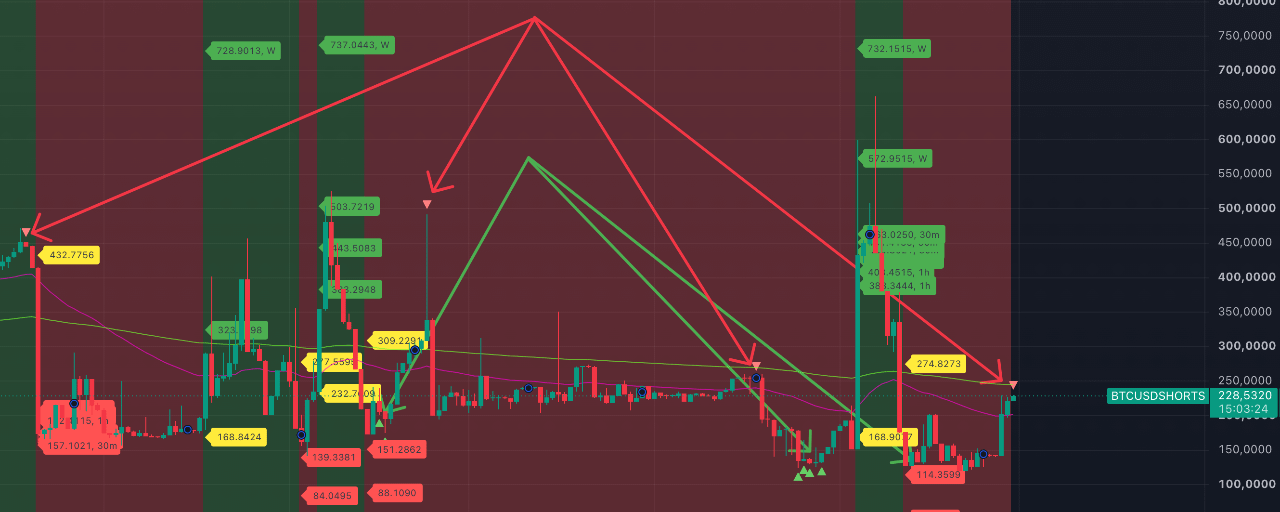


The BTCUSDSHORTS metric provides the probability of a drop in short pressure over the next three days. On the daily timeframe of the chart, a mark appeared for a potential high from our indicator.
The last time such markers appeared was on August 18, June 24, and April 18. We show on the #BTC price chart these dates and the move after such signals. These are not signals of “only up from now on,” but overall, taking the trend into account, the probability of going up is not small and it’s worth considering.
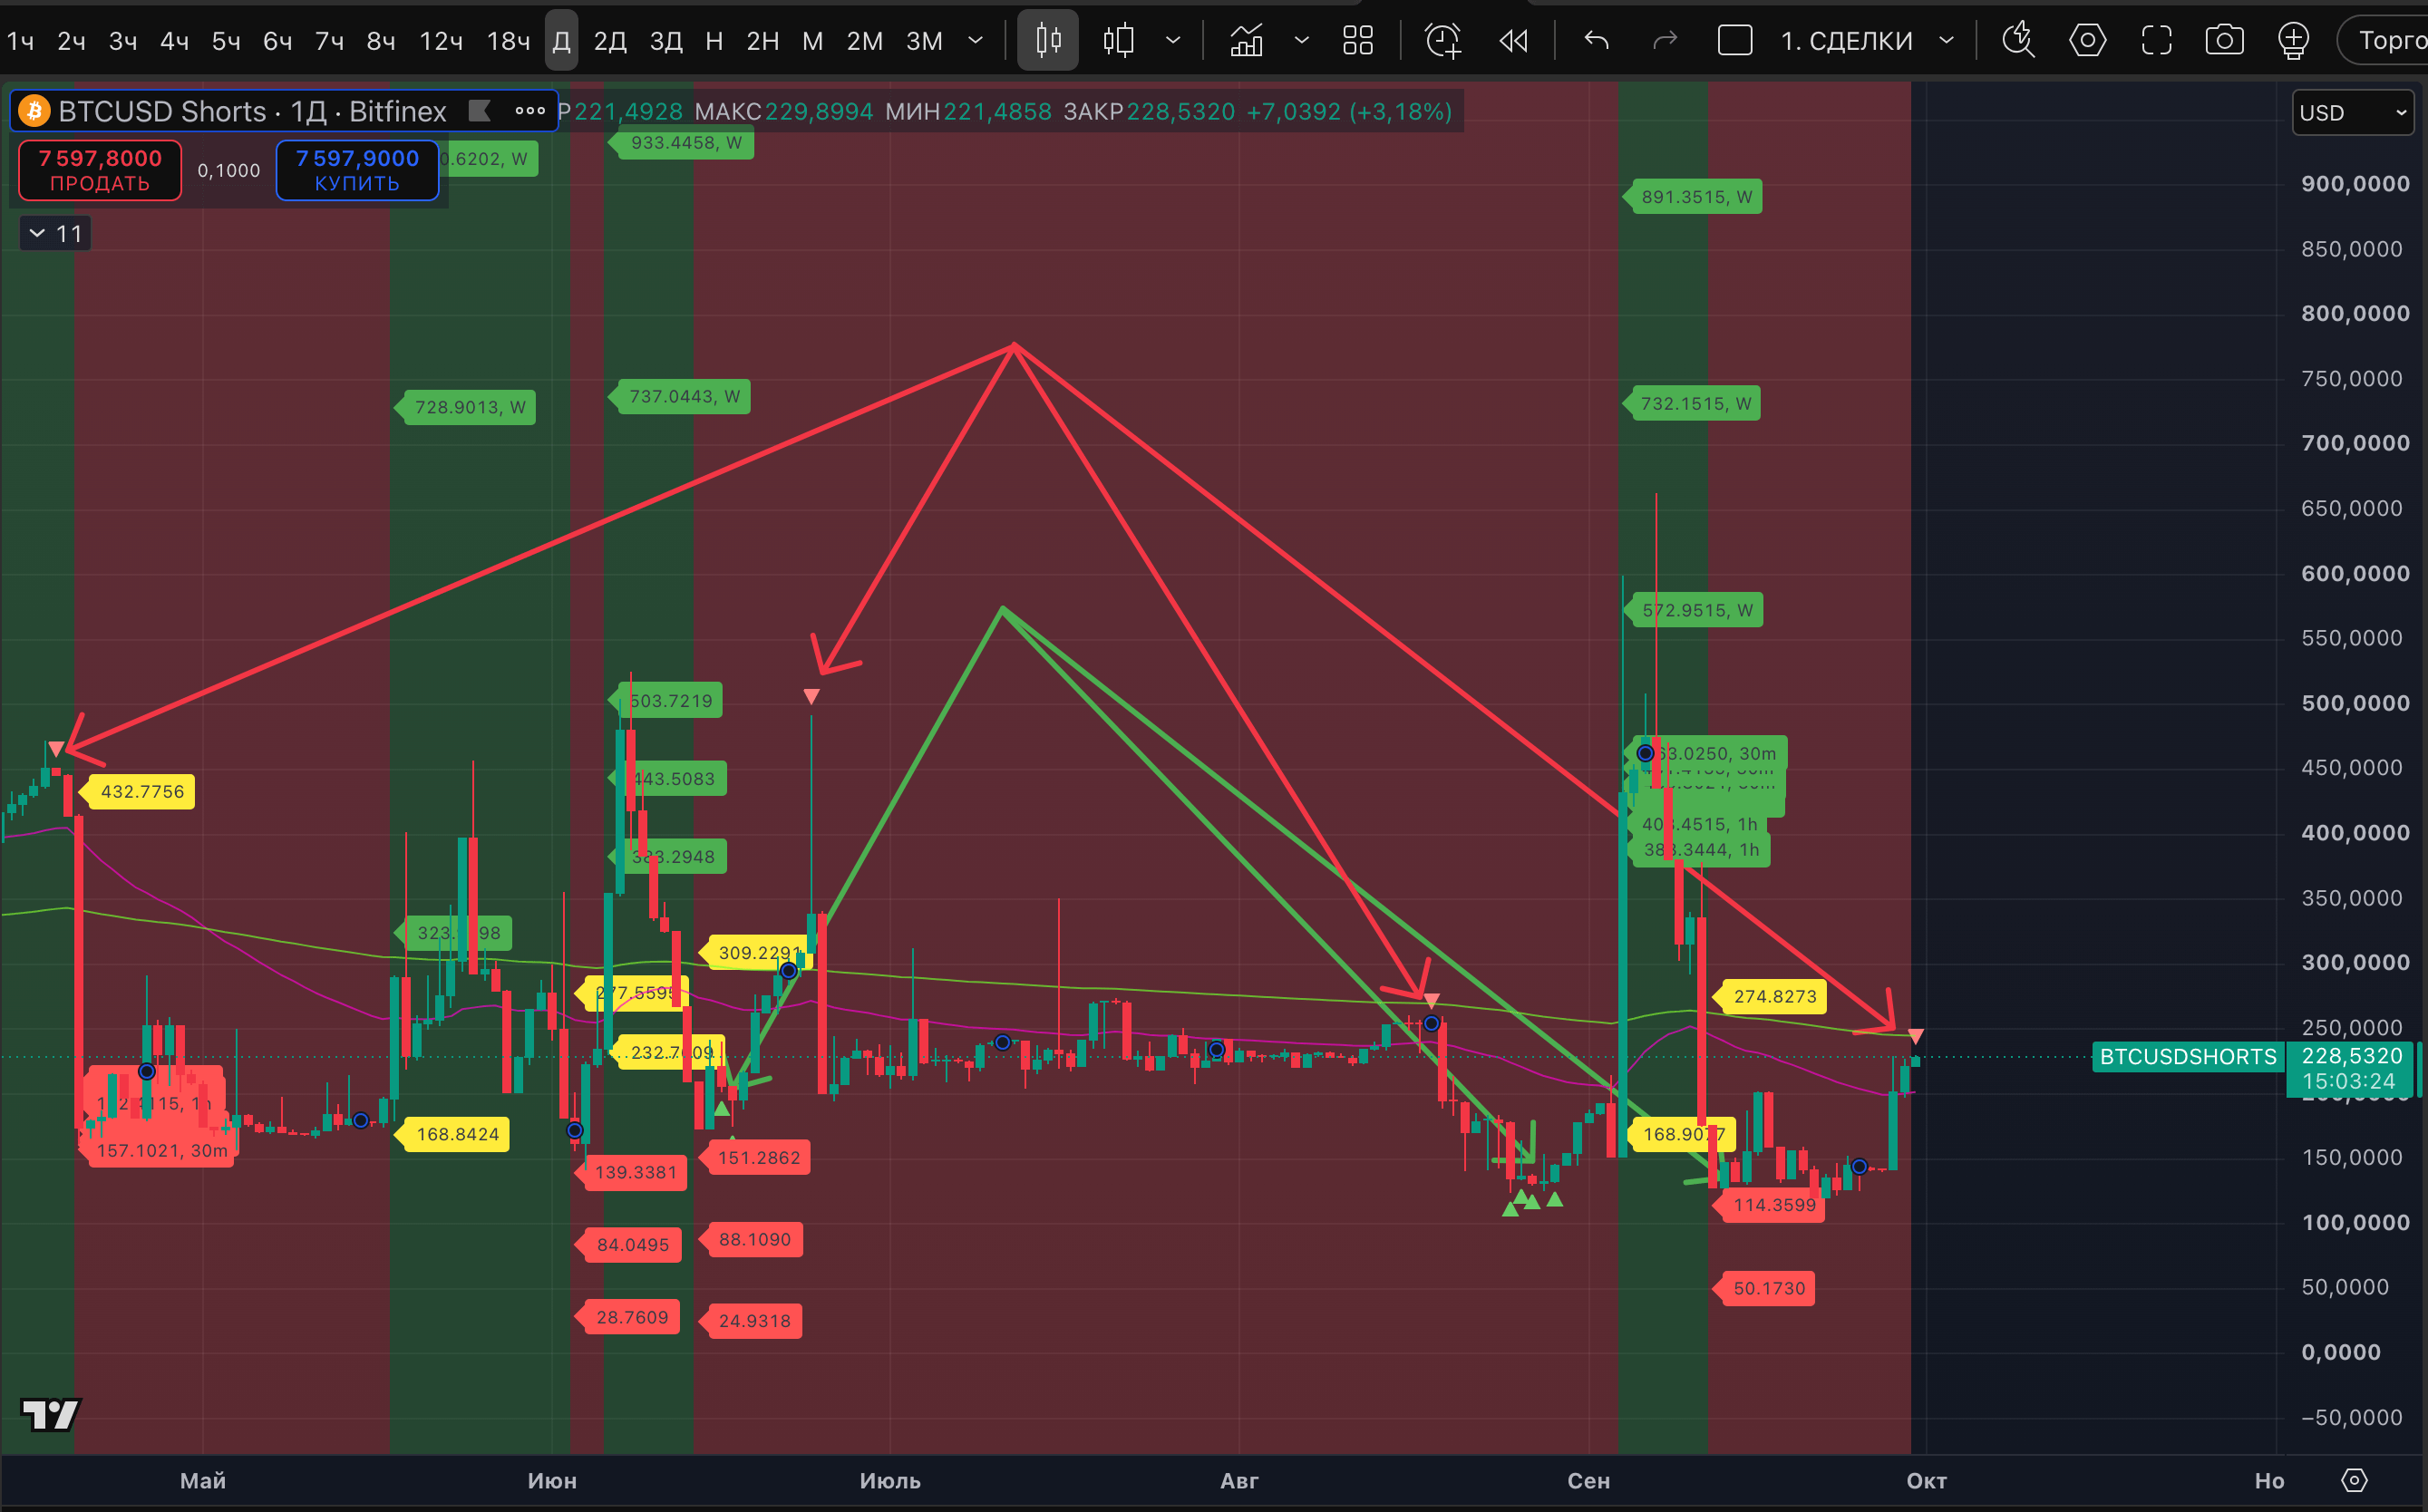
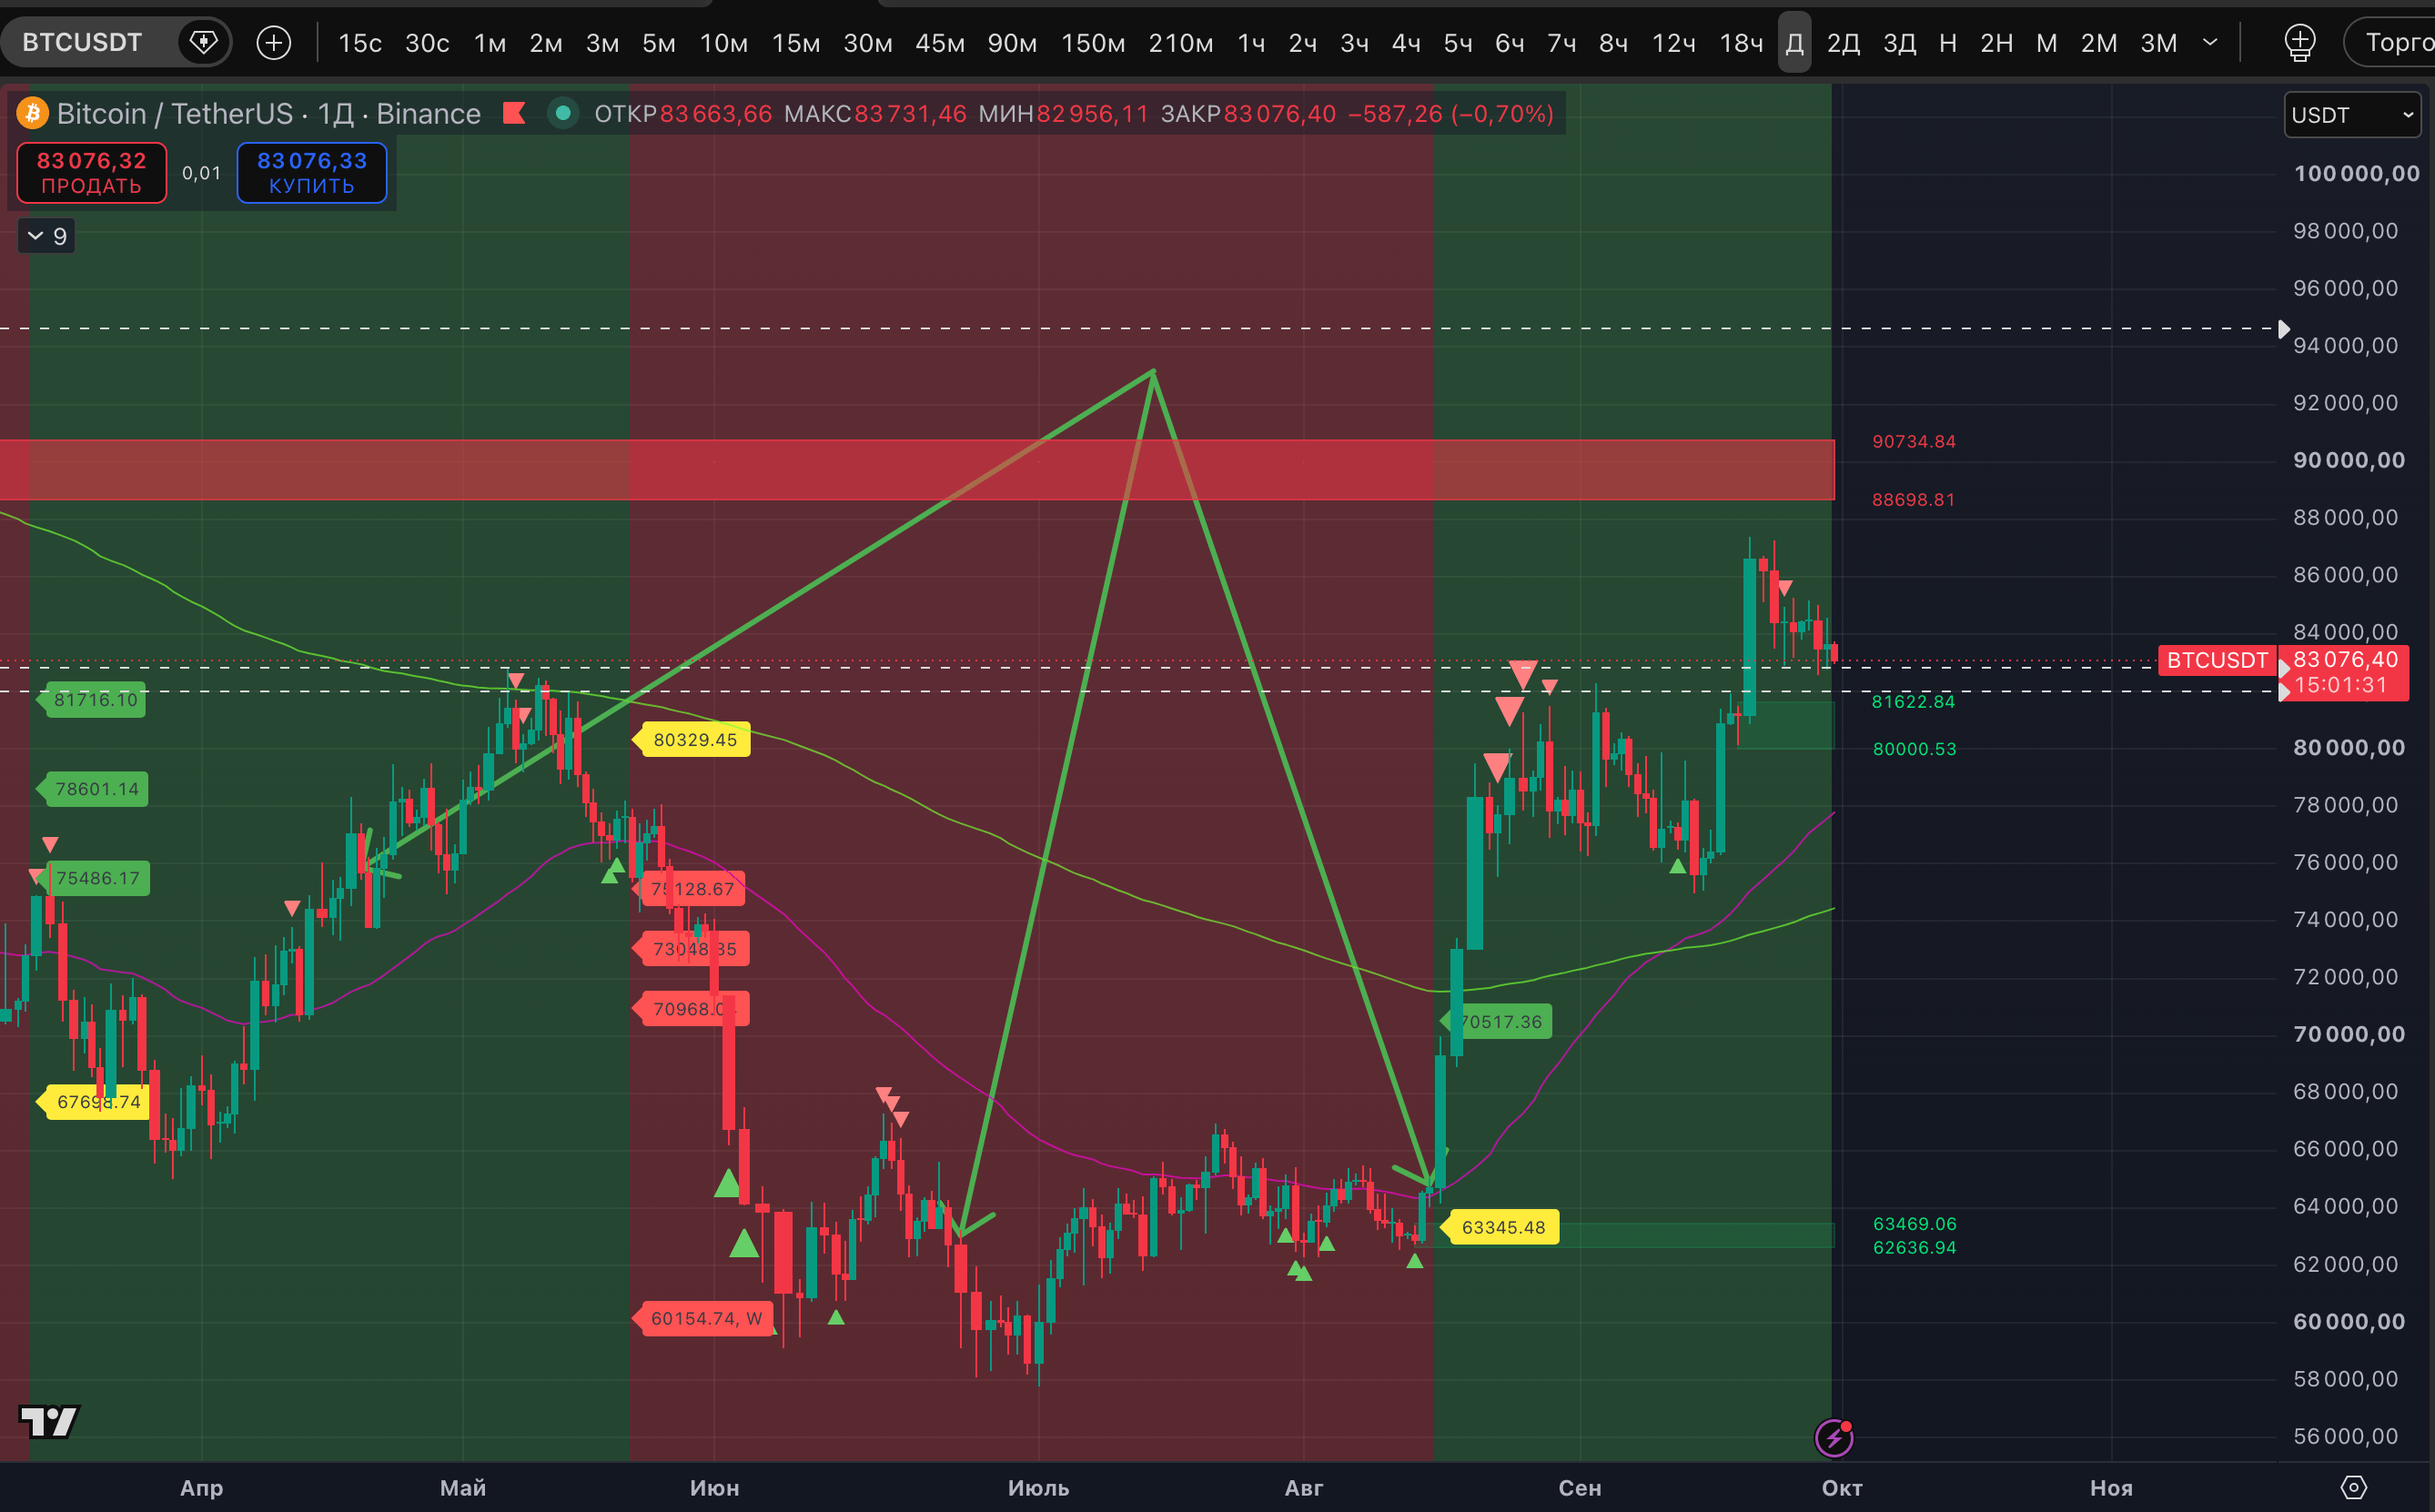
Given that there can be up to three labels—the речь is precisely about those three days that are highlighted in the headline. Therefore, if from September 30 to October 2 the sellers do not move the price into the new price range (i.e., “they won’t cause a noticeable dump and send the price under 80,000$”)—then a further correction will be in question. At least, if selling pressure eases and buyers’ interest returns.
It’s also important that in the three previous times, for a BTCUSDSHORTS reversal downward, only one label was enough.
Let us remind you that BTCUSDSHORTS, just like BTCUSDLONGS, are metrics from the crypto exchange Bitfinex. Analyzing them makes it possible to draw conclusions about the behavior of “smart money.” BTCUSDLONGS are longs on the exchange; they show the total volume of open margin long positions for BTC/USD. For shorts, BTCUSDSHORTS—respectively—shows the volume of short positions.
If we analyze the chart of the number of longs based on our indicator’s stable trends (where the chart often moves like a sine wave and is inversely correlated with the asset’s price), then the chart of the number of shorts is based on extreme signals, the labels of the high and the low.