【 $BTC four-year cycle series 84】
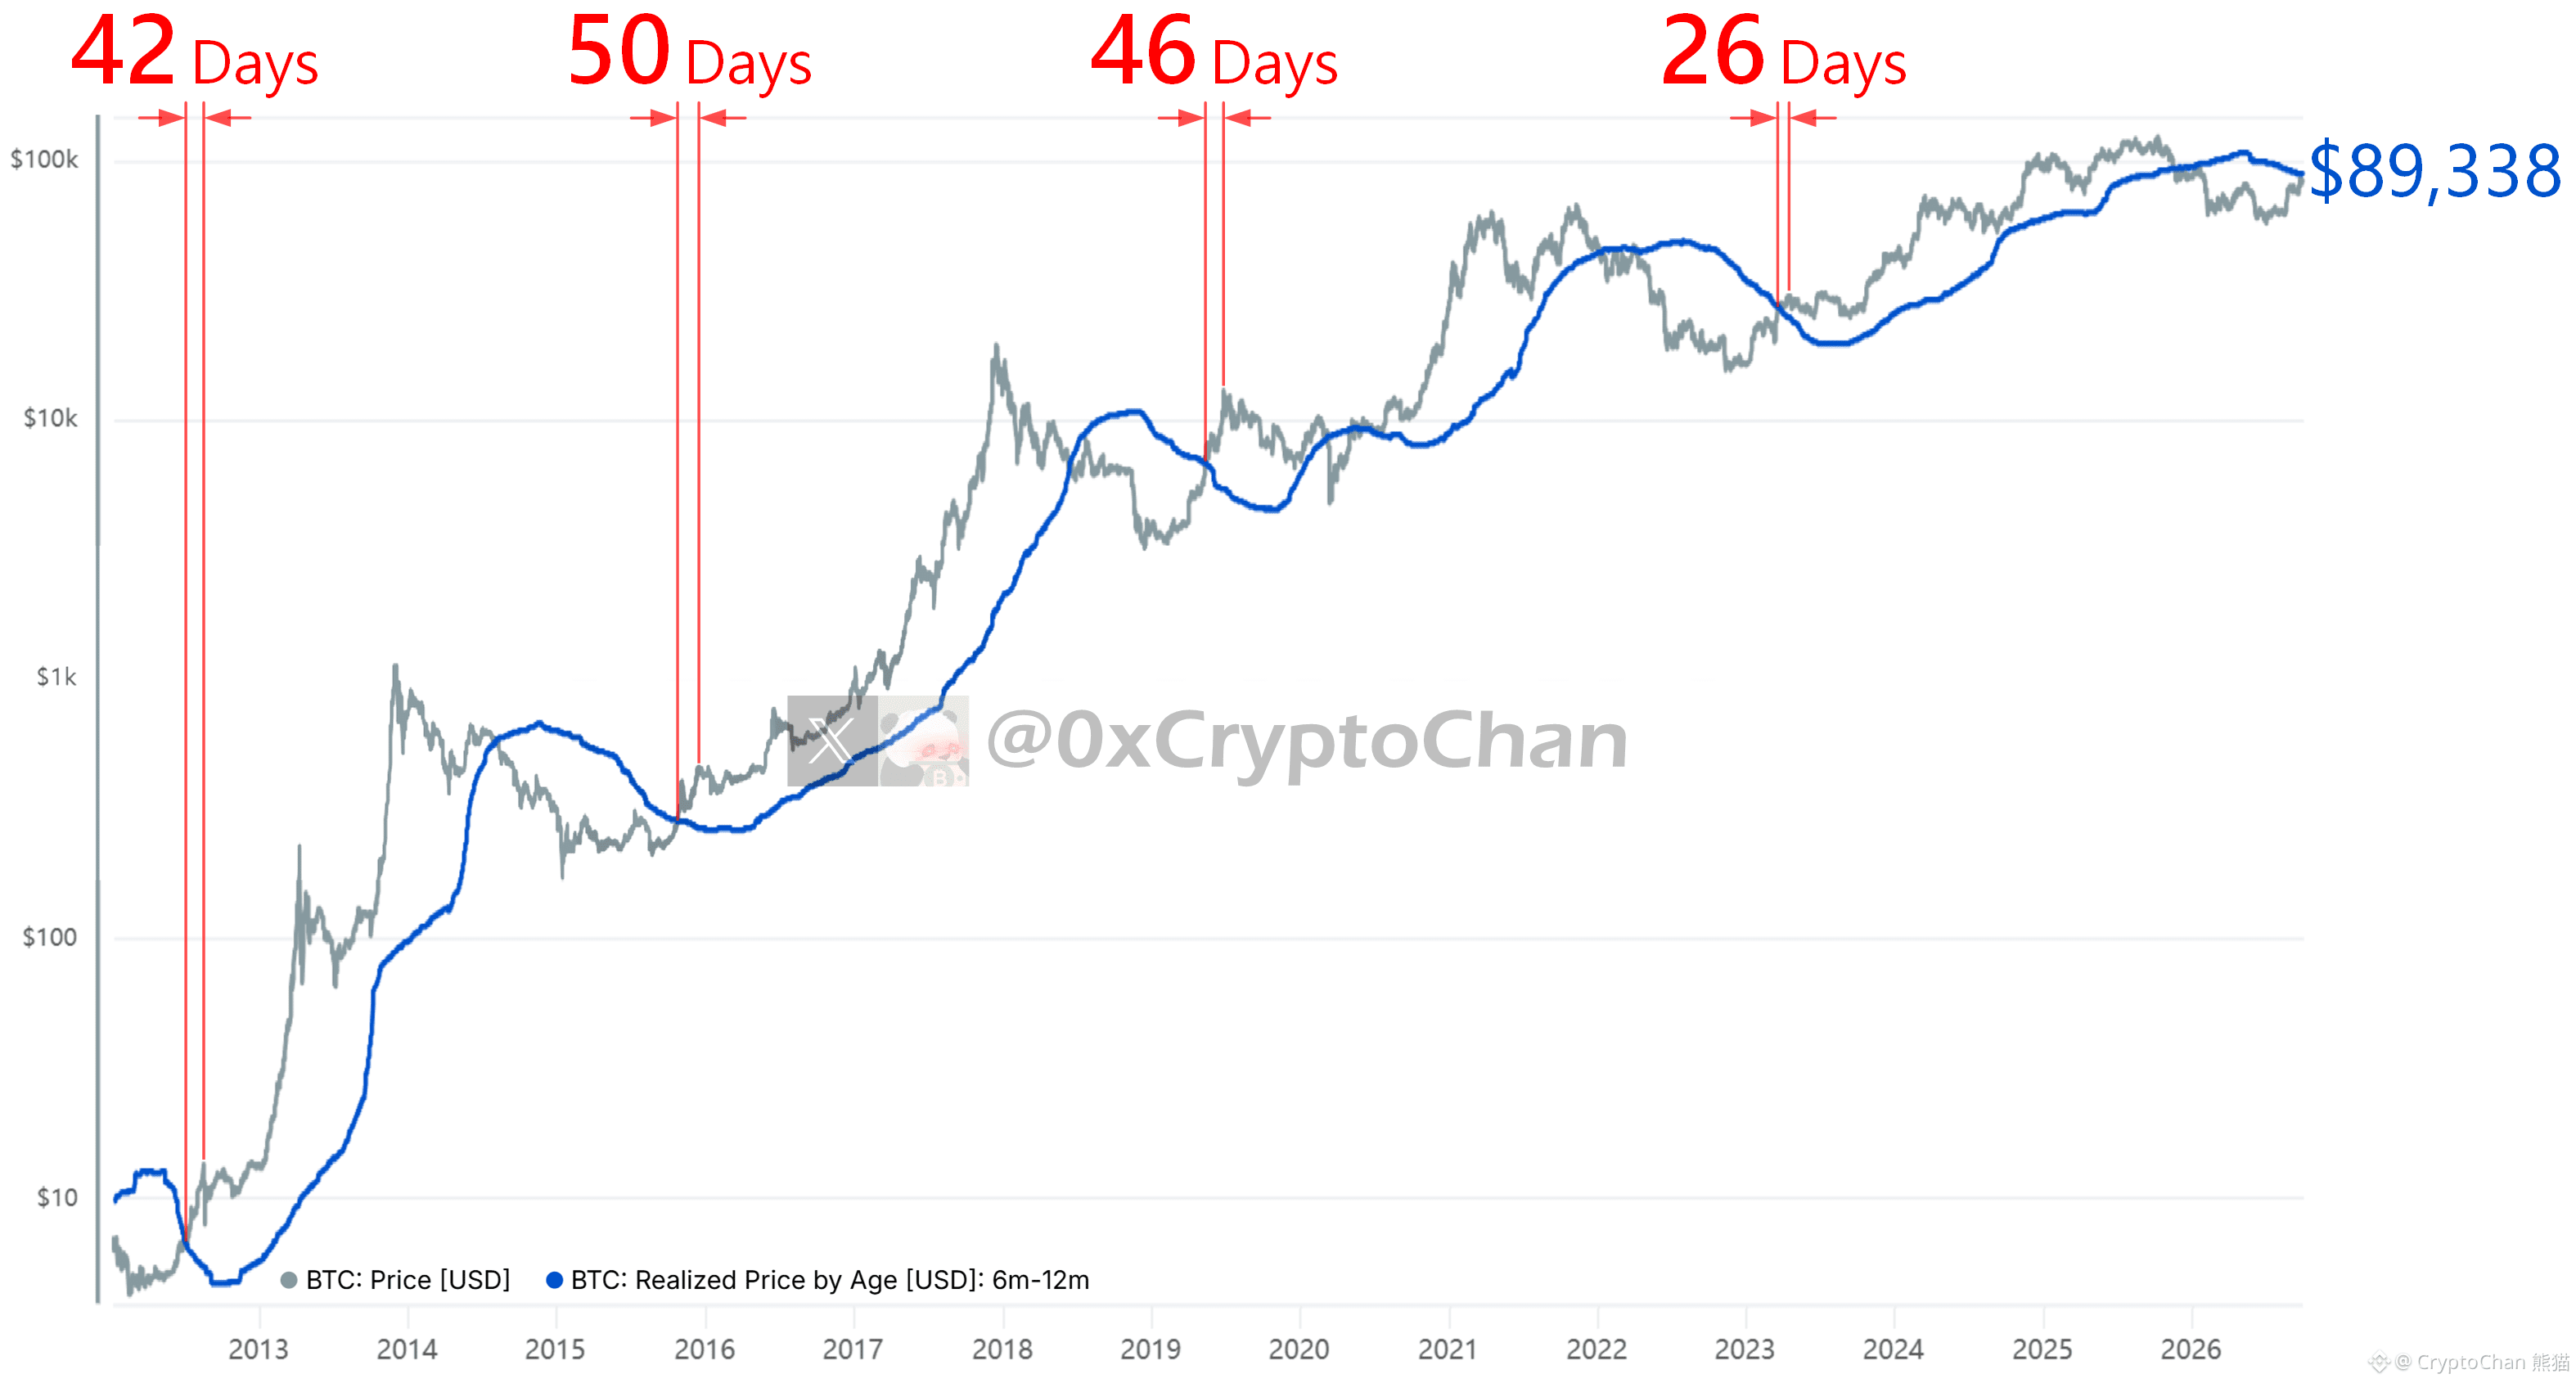
In 2012, the BTC price broke through the blue line: the bull market recovery top came 42 days later
In 2015, the BTC price broke through the blue line: the bull market recovery top came 50 days later
In 2019, the BTC price broke through the blue line: the bull market recovery top came 46 days later
In 2023, the BTC price broke through the blue line: the bull market recovery secondary top came 26 days later
Current blue line: $89,338
┌── 🐼 Indicator Details ──┐
Grey line: Bitcoin price
Blue line: the average buy price of BTC held on-chain for 6–12 months
In 2012, the BTC price broke through the blue line: the bull market recovery top came 42 days later
In 2015, the BTC price broke through the blue line: the bull market recovery top came 50 days later
In 2019, the BTC price broke through the blue line: the bull market recovery top came 46 days later
In 2023, the BTC price broke through the blue line: the bull market recovery secondary top came 26 days later
Current blue line: $89,338
┌── 🐼 Indicator Details ──┐
Grey line: Bitcoin price
Blue line: the average buy price of BTC held on-chain for 6–12 months